The Pipeline Report Template Your Forecast Meeting Actually Needs
It's Monday morning. You pull up the pipeline report template someone built in Sheets last quarter. There are 47 open deals, a few color-coded stages, and absolutely no way to tell which deals are real - half haven't had a next step logged in 21+ days. The forecast call starts in ten minutes.
Most pipeline report templates floating around online aren't reports at all. Smartsheet's version tracks product revenue and units plus costs per unit, not deal stages, not coverage, not velocity. That's a P&L worksheet wearing a pipeline report's name. Let's fix that.
What You Need (Quick Version)
Three report views cover every audience: a rep view sorted by next follow-up date, a manager view grouped by forecast category and close month, and an exec view showing coverage trends and commit/upside on a single slide.
Five KPIs make the report useful: coverage ratio, pipeline velocity, stage conversion rate, deal aging, and slippage. If your template doesn't track all five, it's a tracker pretending to be a report.
What a Pipeline Report Actually Is
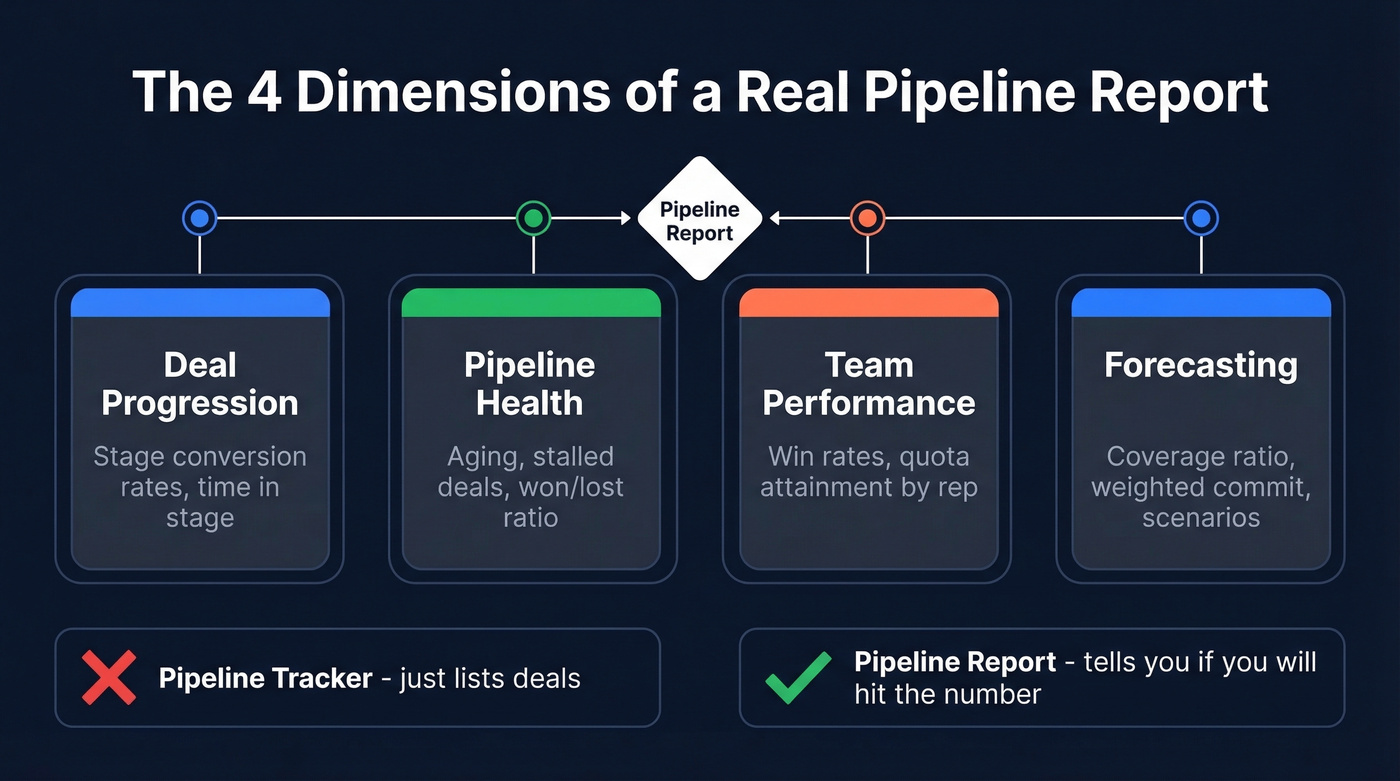
A pipeline tracker lists deals. A pipeline report tells you whether you'll hit the number.
A pipeline is internally focused - it tracks seller actions, deal progression, and performance against quota. A funnel tracks the customer journey. Mixing them up is how you end up with a spreadsheet that looks busy but says nothing useful to anyone in the room.
A real pipeline report covers four dimensions:
- Deal progression - stage conversion rates, time in stage
- Pipeline health - aging, stalled deals, won/lost ratio
- Team performance - win rates, quota attainment by rep
- Forecasting - coverage ratio, weighted commit, scenario planning
Template Columns Explained
You don't need twelve tabs. You need three: Raw Data, Report View, and Definitions. Build it in Excel or Google Sheets - both work, and over 80% of SMEs use Excel as a primary pipeline tracking tool. The column set below is everything you need for a free sales pipeline spreadsheet. There's a reason free templates keep circulating on Reddit - most small teams don't need a full CRM, they need a structured report that someone actually maintains.
Here's the column set for your Raw Data tab:
| Column | Purpose |
|---|---|
| Deal Name | Unique identifier |
| Company | Account name |
| Owner | Assigned rep |
| Stage | Current pipeline stage |
| Amount | Full deal value |
| Probability (%) | Stage-based close likelihood |
| Weighted Forecast | Amount x Probability |
| Close Date | Expected close |
| Next Step | Specific next action |
| Age (Days) | Days since creation |
| Forecast Category | Commit / Best Case / Pipeline |
| Source | Lead origin channel |
Use data validation dropdowns for Stage, Forecast Category, and Source. Dropdowns cut data entry errors by up to 35% and stop reps from inventing creative stage names like "Warm-ish" or "Probably Closing."
Your Report View tab pulls from Raw Data using pivot tables or INDEX/MATCH formulas. In Google Sheets, set Forecast Category as rows and Close Date grouped by month as columns, summing Amount - that gives you the manager forecast view in seconds. Same layout works in .xls files if your team prefers Excel.
The Definitions tab documents your stage names, exit criteria, and forecast category rules. When a new rep joins, this tab is their onboarding guide to your pipeline language. We've seen teams cut ramp time in half just by having clear, written definitions everyone can reference.
Filled Example With Real Numbers
Here's what the numbers look like in practice:
| Deal | Stage | Amount | Prob. | Weighted | Close Date | Category |
|---|---|---|---|---|---|---|
| Acme Corp | Negotiation | $120K | 70% | $84K | Jul 15 | Commit |
| Beta Inc | Demo Done | $85K | 40% | $34K | Jul 30 | Best Case |
| Gamma Ltd | Discovery | $200K | 20% | $40K | Aug 15 | Pipeline |
| Delta Co | Proposal | $65K | 50% | $32.5K | Jul 22 | Best Case |
| Epsilon | Qualification | $150K | 10% | $15K | Sep 1 | Pipeline |
If your quota is $500K, you need $1.5M-$2M in total pipeline to feel safe. This table shows $620K total, $205.5K weighted. That's a coverage problem - and you'd never see it in a tracker that just lists deals without probability weighting.
Here's the thing: if your average deal size is under $10K, you probably don't need a CRM at all for pipeline reporting. A well-structured Google Sheets template with these columns, updated consistently, will outperform a half-configured Salesforce instance every time.
A pipeline report with $620K in total value means nothing if half those contacts bounce. Prospeo delivers 98% email accuracy and 125M+ verified mobiles so every deal in your spreadsheet is attached to a real, reachable buyer.
Stop forecasting on bad data. Start with verified contacts at $0.01 each.
Five KPIs Every Report Needs
Coverage Ratio
Total pipeline value divided by quota. Weighted coverage - value times probability - gives you expected revenue. Enterprise teams target 3-5x, mid-market 2.5-4x, and high-velocity SMB 2-3x. If you're below those thresholds, the forecast call is going to be uncomfortable no matter how good your slide deck looks.
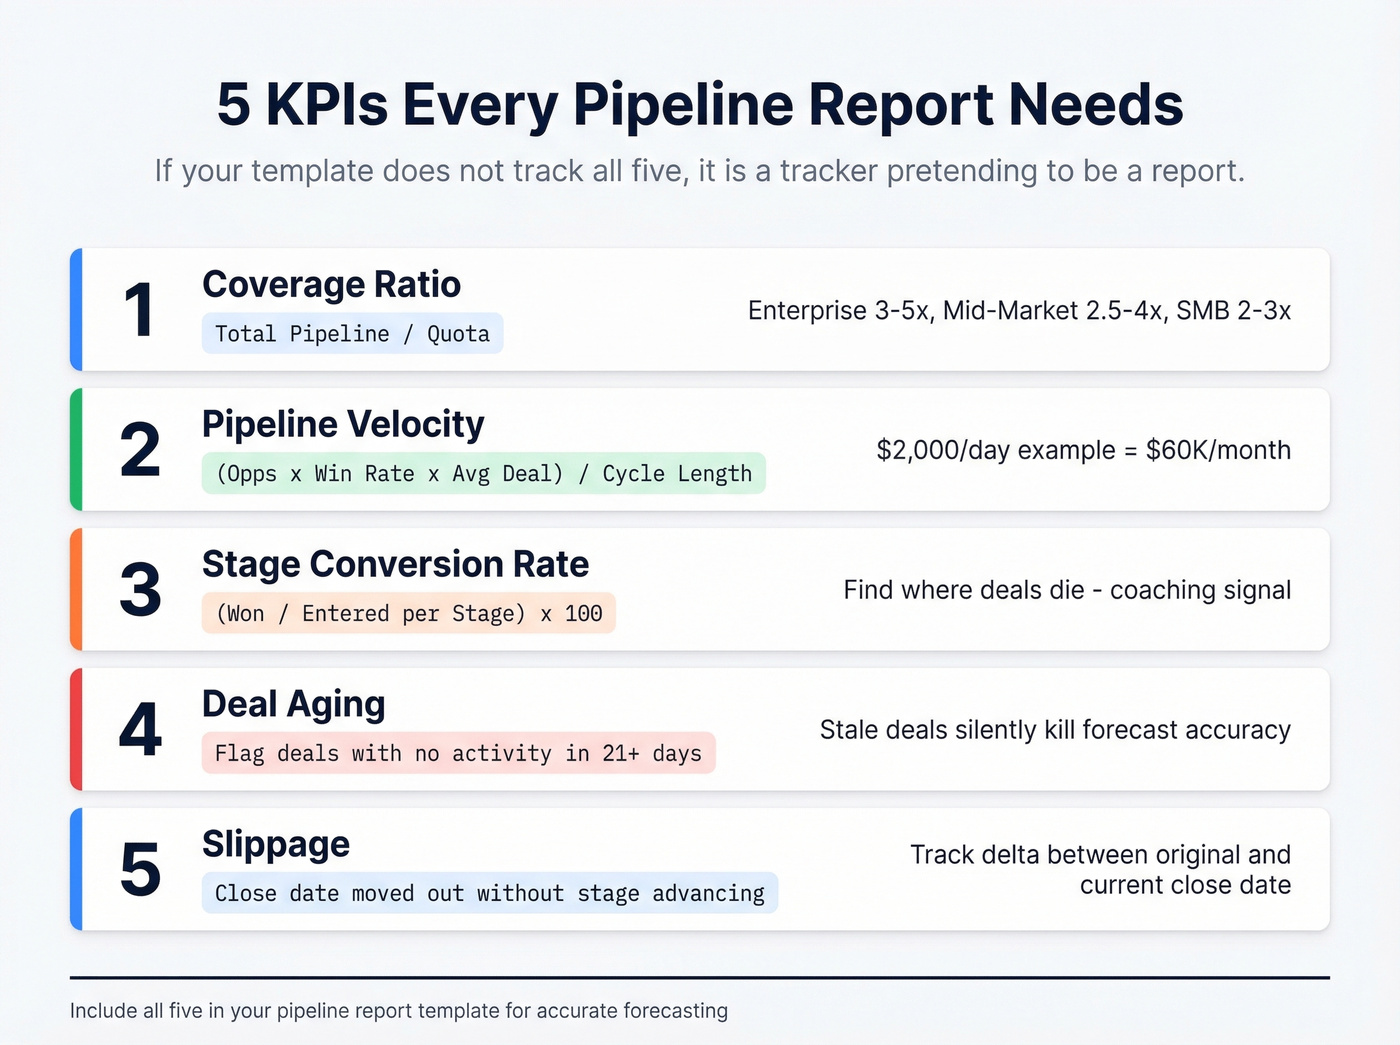
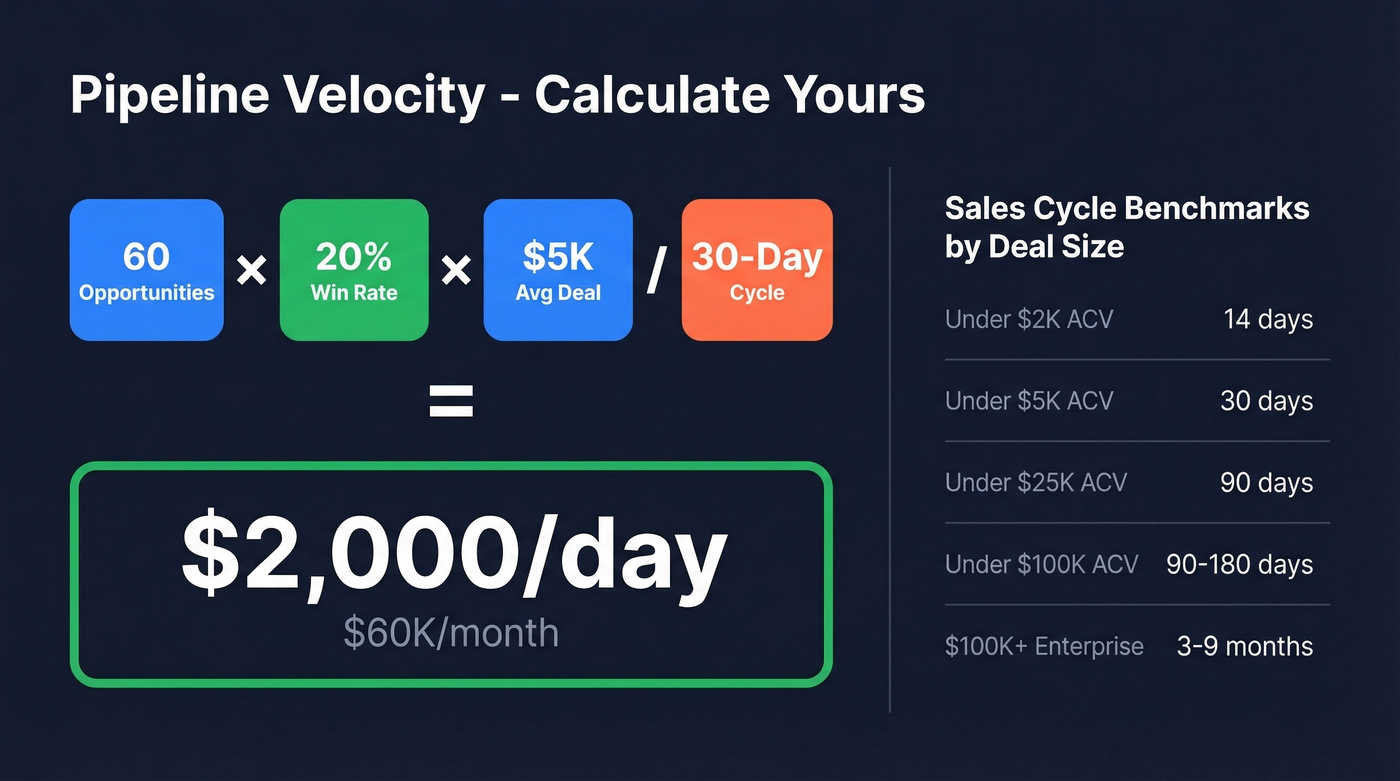
Pipeline Velocity
(Opportunities x Win Rate x Avg Deal Size) / Sales Cycle Length. A team with 60 opportunities, a 20% win rate, a $5K average deal, and a 30-day cycle generates $2,000/day in pipeline velocity - roughly $60K/month. Track this weekly to spot slowdowns before they hit the forecast. Sales cycle length varies by deal size: 14 days for sub-$2K ACV, 30 days for sub-$5K, 90 days for sub-$25K, 90 days for sub-$100K, and 3-9 months for $100K+ enterprise deals.
Stage Conversion Rate
(Opportunities won / Opportunities entered per stage) x 100. This tells you where deals die. If 50% of deals stall between Discovery and Proposal, that's a coaching problem, not a pipeline problem. (If you need a clean stage map, start with a standard B2B sales pipeline.)
Deal Aging
Flag any deal with no logged activity in 21+ days. Stale deals are the silent killer of forecast accuracy - they inflate coverage without contributing revenue. We run a "zombie deal" purge every two weeks on our own pipeline and it's consistently the highest-impact hygiene habit we've adopted.
Slippage
Deals where the close date moved out without the stage advancing. If a rep pushes a close date from July to September but the deal is still in "Proposal," something's wrong. Track the delta between original close date and current close date as a column - it makes the pattern impossible to ignore.
Running the Weekly Review
Here's the rhythm: reps update deal data daily or 2-3x per week. Managers review the full pipeline weekly. Execs get a monthly or quarterly summary with coverage trends and commit/upside breakdown.
Sort by next follow-up date. One sales rep on r/googlesheets built a pipeline file specifically because they needed auto-sorting by next follow-up - it's the single most common pain point with spreadsheet pipelines, and the one thing that makes reps actually open the template.
Enforce objective exit criteria per stage. "Sent proposal" isn't an exit criterion. "Customer confirmed budget and timeline in writing" is. The difference between these two definitions is the difference between a 40% win rate and a 25% win rate, because subjective stages let reps promote deals that haven't actually progressed.
Track net-new qualified opportunities added per month. If your coverage target is 3x and you're closing deals, the pipeline shrinks. Someone needs to be filling it. (If you want a repeatable system, use these pipeline generation ideas.)
Mistakes That Kill Pipeline Reports
Subjective stages without exit criteria. If "Qualified" means something different to every rep, your stage conversion data is noise. Define stages by customer actions, not seller opinions.
Stale deals inflating coverage. A "full pipeline" packed with low-quality leads is an illusion. 61% of B2B marketers send all leads to sales, but only 21% are qualified. Purge ruthlessly.
Unreachable contacts creating phantom pipeline. Dead emails and disconnected numbers mean deals that look active but can't progress. This is where data quality tools earn their keep - Prospeo's 98% email accuracy and 7-day data refresh cycle keep CRM contacts current so your pipeline report reflects real opportunities, not ghosts. (If you're evaluating providers, compare options in the best B2B contact database roundup.)
No aging or slippage tracking. Without these two metrics, you can't distinguish a healthy pipeline from a graveyard of pushed deals. Adding just these two columns transforms what your report can tell you.
Mixing pipeline reports with funnel reports. Pipeline is internal - seller actions, deal progression, quota attainment. Funnel is external - customer journey, drop-off points. Combining them produces a report that answers neither question well. Skip the hybrid approach. (If you need funnel-specific reporting, use B2B sales funnel metrics instead.)
The Exec/Board Pipeline Slide
Executives don't want your 47-row spreadsheet. They want one slide with a forward-looking narrative.
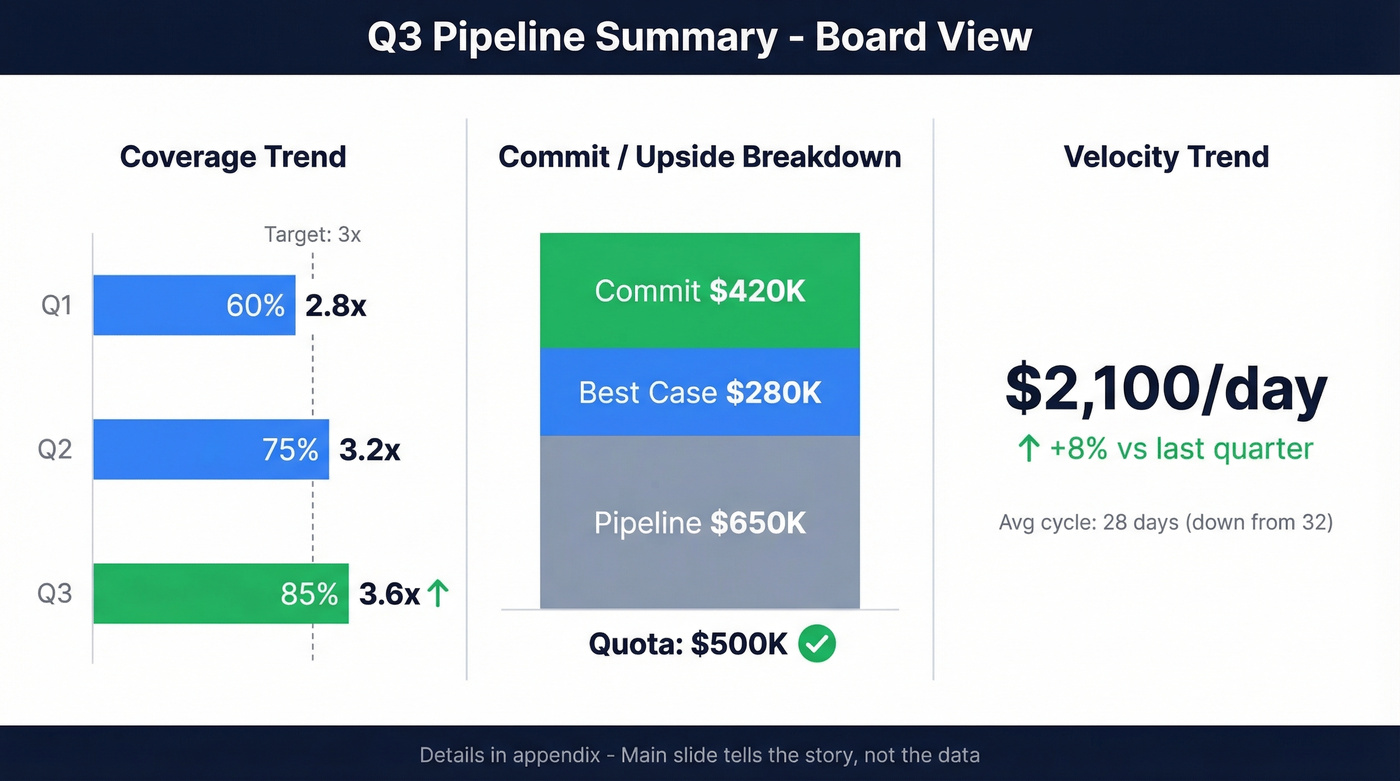
The headline reel: pipeline coverage trend comparing this quarter to the last two, commit/upside breakdown by forecast category, and velocity trend showing whether deals are moving faster or slower. Layout it like this - left third for coverage trend bars, center for commit/upside breakdown by category, right for the velocity metric with a directional arrow. Keep it consistent quarter-to-quarter so the board can compare apples to apples. The main slide tells the story, not the data - details go in the appendix.
For non-SaaS teams - construction, consulting, government contracting - swap deal stages for bid stages: active bids in pipeline, bid volume by period, and awarded contracts by period. The KPIs are the same; the vocabulary changes. (For a deeper forecasting layer, see sales forecast techniques.)
Coverage ratio below 3x? The fix isn't a better template - it's more qualified opportunities. Prospeo's 300M+ profiles with 30+ filters (intent data, job changes, headcount growth) let you fill pipeline gaps before your next forecast call.
Turn your coverage ratio from red to green this week.
Still have questions? Here are the ones we hear most.
FAQ
What's the difference between a pipeline tracker and a pipeline report?
A tracker lists deals and their current stages. A report layers in KPIs like coverage ratio, velocity, deal aging, and stage conversion rates so you can forecast outcomes and spot problems - not just count deals. Any pipeline report template worth using includes all five metrics.
What's a good pipeline coverage ratio?
Enterprise teams target 3-5x quota, mid-market B2B aims for 2.5-4x, and high-velocity SMB teams need 2-3x. Weighted coverage (deal value times close probability) is more accurate than raw totals because it accounts for deals that won't close.
How often should I update my pipeline report?
Reps should update deal data daily or 2-3x per week. Managers review the full pipeline weekly during a structured pipeline call. Execs receive a monthly or quarterly summary with coverage trends, commit/upside breakdown, and velocity changes.
Can I use a spreadsheet instead of a CRM?
For teams under ten reps, a Google Sheets or Excel template handles deal tracking, forecasting, and weekly reviews without a CRM license. The template above is free - copy it and customize stage names and exit criteria to match your process.
How do I keep pipeline data accurate?
Use data validation dropdowns to standardize stages, set objective exit criteria based on customer actions, and verify contact data regularly. Stale contact records are the fastest way to inflate a pipeline with deals that can't actually close - keeping emails and phone numbers current is just as important as keeping deal stages honest.