Projected Revenue: How to Calculate It in 2026
It's Thursday night. Your investor update is due Monday. You need a projected revenue figure and you've never built one. You look up the formula - and the first three sources give you three different answers, one of which is actually the formula for profit.
That's not a hypothetical. There's a real Reddit post from someone with "zero accounting abilities" whose accountant refused to build the report, so they had to figure it out alone. The fact that widely-cited financial guides can't get the basic formula right tells you everything about the state of financial content online.
Let's fix that.
What Is Projected Revenue?
Projected revenue is the total top-line sales a business expects to generate over a specific period - before subtracting any costs, expenses, or taxes. It's the money coming in the door, not what's left after you pay for things.
That distinction matters more than it sounds. Revenue sits at the top of your income statement. It's not profit, not net income, not EBITDA. It's the gross amount customers pay you for goods or services delivered.
One more distinction worth nailing down: a revenue projection isn't the same as a forecast or a budget, even though people use these terms interchangeably. The AICPA classifies both forecasts and projections as prospective financial statements and draws a clear line between them. A forecast reflects what you expect will happen given current conditions - grounded in today's data, often covering 1-12 months. A projection models hypothetical what-if scenarios under specific assumptions, often spanning 1-5 years, like "what happens if we hire 5 more reps and enter the UK market."
A budget is what management hopes to make happen. Three different tools, three different jobs.
The Formula Most Guides Get Wrong
Multiple top-ranking pages for "projected revenue formula" publish some version of this:
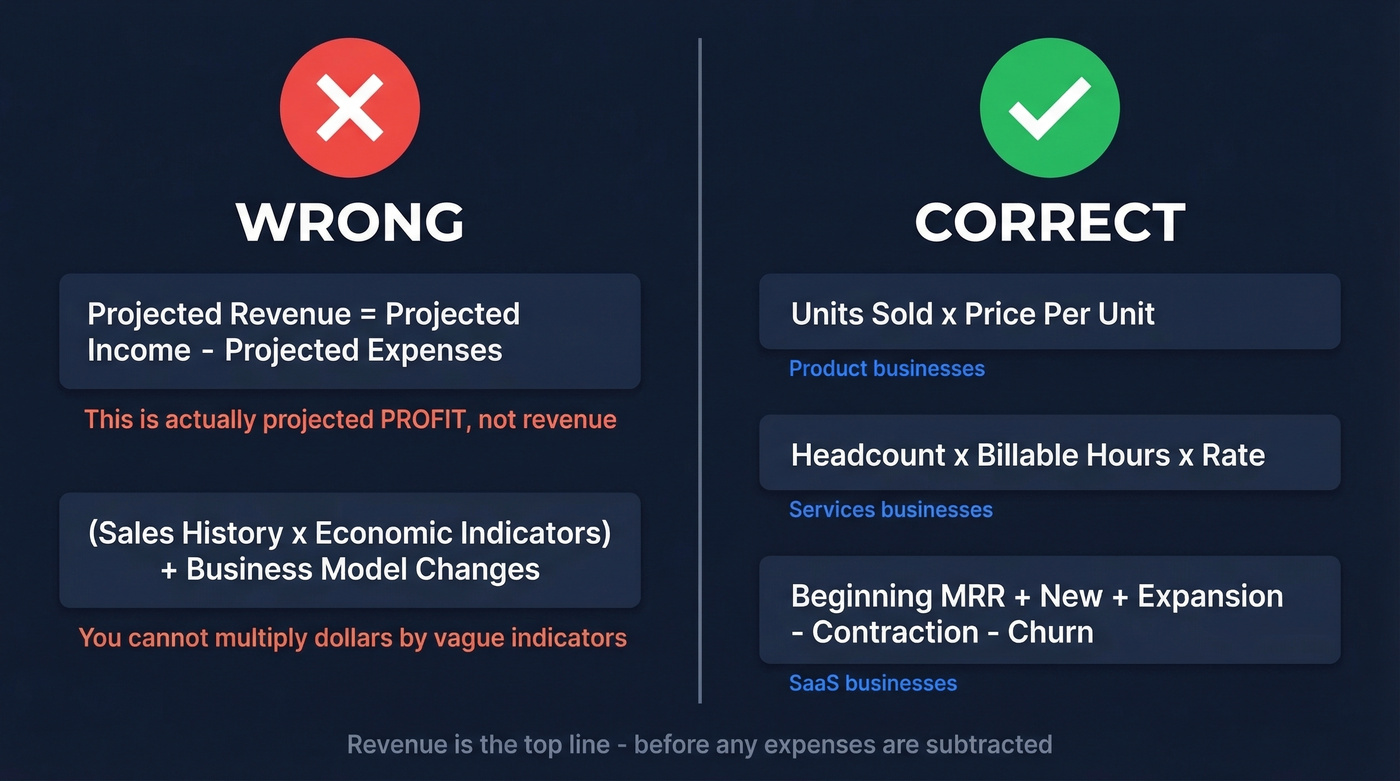
Projected Revenue = Projected Income - Projected Expenses
That's not revenue. That's projected profit. Revenue minus expenses equals what's left over - the bottom line, not the top line. BigTime's blog publishes this exact formula, then later contradicts itself with a perfectly correct services-based calculation.
Another top result offers this: "Projected Revenue = (Sales History x Economic Indicators) + Business Model Changes." You can't multiply a dollar figure by "economic indicators" and get a meaningful number. That's not a formula - it's a word salad.
Here's the thing: if you subtract expenses from income to get "revenue," your numbers will be wrong in a way that's hard to catch later. Revenue is calculated before expenses enter the picture. Full stop.
How to Calculate It - 5 Methods
Growth-Rate Method
Formula: Last Period Revenue x (1 + Growth Rate)
The quickest way to get a defensible number for a board deck. If you did $2M last quarter and you're growing at 15% QoQ, your projection for next quarter is $2.3M. Works best when growth is relatively stable and you aren't making major GTM changes. This is also one of the simplest approaches to calculating sales projections when you have consistent historical data.
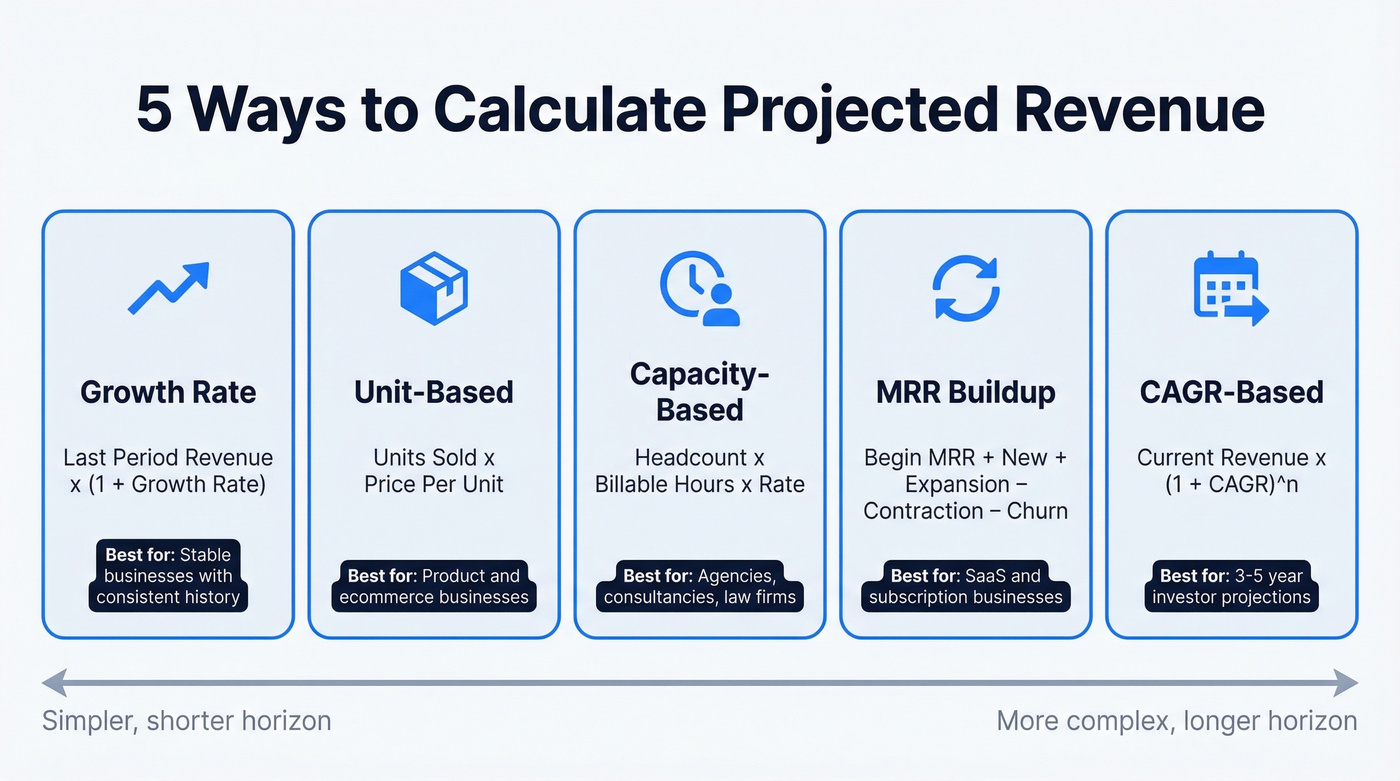
Unit-Based Method
Say you sell wireless earbuds at $79 each and moved 15,000 units last year. Your baseline sales projection is 15,000 x $79 = $1,185,000. That's it: Units Sold x Price Per Unit. Layer in seasonal adjustments - a Q4 holiday bump, a post-holiday Q1 dip - and you've got a model that's simple but surprisingly accurate. The key is getting your unit volume estimate right. That's where most of the error lives, not in the price.
Capacity-Based Method
Start with a real scenario. You've got 3 senior consultants billing 100 hours/month at $200/hr and 2 junior consultants billing 120 hours/month at $125/hr, across an 8-month engagement. That's (3 x 100 x 8 x $200) + (2 x 120 x 8 x $125) = $480,000 + $240,000 = $720,000 in expected revenue. The underlying formula: Headcount x Billable Hours x Hourly Rate. Services businesses - agencies, consultancies, law firms - live and die by this calculation.
MRR Buildup Method (SaaS)
Formula: Beginning MRR + New MRR + Expansion MRR - Contraction MRR - Churned MRR
For SaaS businesses, revenue is a waterfall. Stripe's SaaS revenue forecasting framework breaks this down well: start with current monthly recurring revenue, add new customers and expansion from upsells and seat additions, then subtract contraction from downgrades and churn from cancellations.
Cohort modeling makes this more powerful. Enterprise customers churning at 0.5-1.5% monthly behave very differently from SMB customers churning at 5-7% monthly. Blending them into one number hides the real dynamics (and is exactly why teams do dedicated churn analysis instead of hand-waving churn assumptions).
CAGR-Based Method (Multi-Year)
Formula: Current Revenue x (1 + CAGR)^n
When investors ask for a 3-5 year revenue projection, this is the backbone. CAGR smooths out year-to-year volatility and gives you a clean trajectory. Investopedia's approach recommends computing CAGR over multiple historical periods, then adjusting for market conditions. For teams with data science resources, regression analysis and ARIMA models can improve accuracy further - but they require clean historical data and statistical expertise most teams under $10M don't have.
Our take: Stop building 5-year projections and treating them as commitments. For most businesses, anything beyond 18 months is fiction. Use CAGR for investor decks and scenario planning, but focus operational energy on 12-18 month rolling forecasts.
A quick note on approach: these five methods are all bottom-up - you build from granular inputs like units, hours, or MRR components. Top-down projections work in reverse: estimate total addressable market, assume a market share percentage, and derive revenue. Bottom-up is more defensible; top-down is faster for early-stage sizing. Use both as a sanity check on each other.
Worked Examples by Business Model
Product Business
A DTC brand sells wireless earbuds at $79/unit. Last year they moved 15,000 units. They're projecting 20% growth from a new retail partnership, but Q1 is historically 30% below average.
Annual base projection: 15,000 x 1.20 = 18,000 units x $79 = $1,422,000. Quarterly breakdown with seasonality: Q1 gets ~18% of annual volume instead of a flat 25%, while Q4 gets ~32%. That seasonal adjustment is the difference between a useful projection and a misleading one.
Services Business
Using the consulting firm from the capacity method: 5 consultants, 8-month engagement, $720,000 in expected top-line revenue. The critical assumption is utilization rate. If your seniors are only 80% utilized due to vacation, admin work, and bench time, that $480K drops to $384K.
Always build in a utilization haircut. Too many services firms project at 100% utilization and then wonder why actuals come in light.
SaaS Business
Model a SaaS company with three pricing tiers:
| Tier | Monthly Price | Current Customers | Monthly Churn | New/Month |
|---|---|---|---|---|
| Starter | $99 | 150 | 5% | 25 (self-serve) |
| Pro | $499 | 40 | 3% | 8 (sales-led) |
| Enterprise | $2,499 | 8 | 2% | 2 (sales-led) |
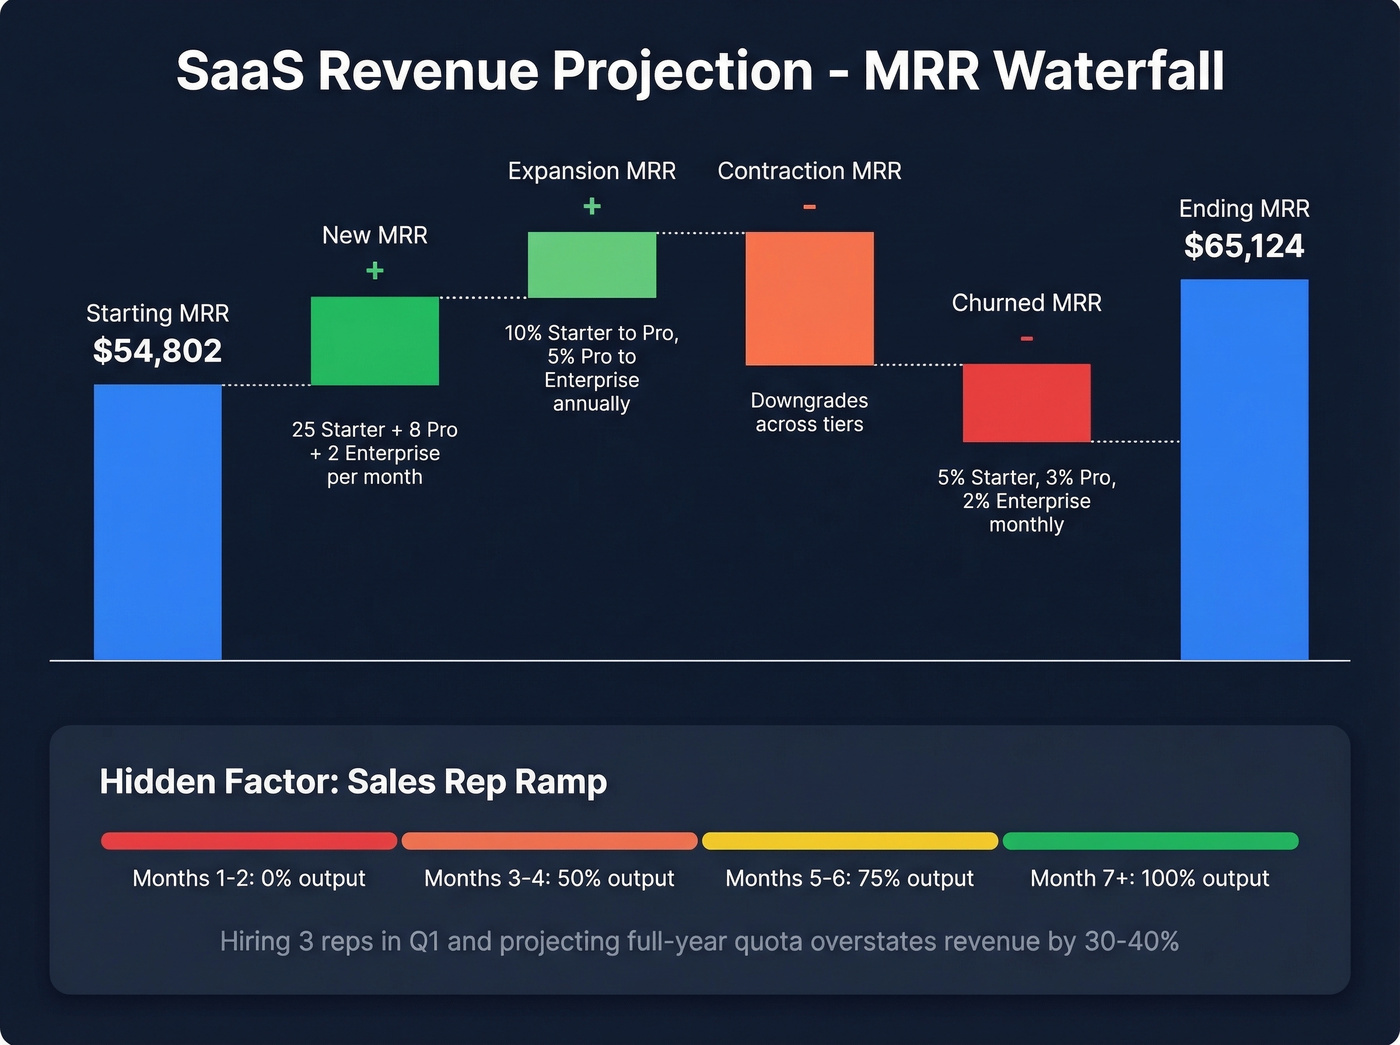
Current MRR: (150 x $99) + (40 x $499) + (8 x $2,499) = $54,802/month.
Now layer in the dynamics that make SaaS sales projections tricky. Upgrade rates: 10% of Starter customers move to Pro annually, and 5% of Pro move to Enterprise. Seasonality: Enterprise acquisition spikes to 150% in Q4 during budget flush, Pro drops to 70% in July/August, and Starter drops to 60% in December.
And here's the factor most models miss: sales rep ramp. A new AE doesn't hit full productivity on day one. Expect 0% output in months 1-2, 50% in months 3-4, 75% in months 5-6, and full quota after month 7. We've seen teams hire 3 reps in Q1 and project their full-year quota - overstating expected sales by 30-40%.
One more SaaS-specific data point worth flagging: the percentage of "old" annual recurring revenue in SaaS companies ranges from 29-53% of all revenue. If your model assumes 80% comes from renewals, you're building on a shaky foundation.
Revenue projections built on unit counts and growth rates are only useful if your pipeline is real. Prospeo gives sales teams 300M+ verified profiles with 30+ filters - buyer intent, headcount growth, funding - so the deals feeding your forecast actually close.
Stop projecting revenue from a pipeline full of dead leads.
ARR ≠ Revenue
This trips up even experienced finance teams. ARR is a point-in-time metric - it tells you what your run rate is right now. Revenue is what you actually recognized over a period. Related, but not interchangeable.
The conservative translation: take your beginning-of-month LARR (live/deployed ARR) and divide by 12 to get monthly revenue. Why LARR and not just ARR? Because there's a real distinction between CARR - contracted ARR from deals signed but not yet live - and LARR, which reflects ARR from customers actually using the product. If you've got a 60-day implementation cycle, a contract signed January 1st doesn't generate revenue until March.
Warning: If you're reporting ARR to investors but recognizing revenue on a different timeline, the gap between those numbers will eventually become a conversation you don't want to have. Align your projection methodology with your revenue recognition policy (ASC 606 / IFRS 15) from day one.
Mistakes That Kill Forecast Accuracy
1. Hockey stick without driver-based assumptions. Every startup deck has a hockey stick. Almost none can explain the mechanism that creates the inflection point. "We'll grow 300% in Year 3" isn't a projection - it's a wish. Tie every growth assumption to a driver: hires to capacity to pipeline to close rate to revenue. If you can't trace the math, investors won't trust it either.
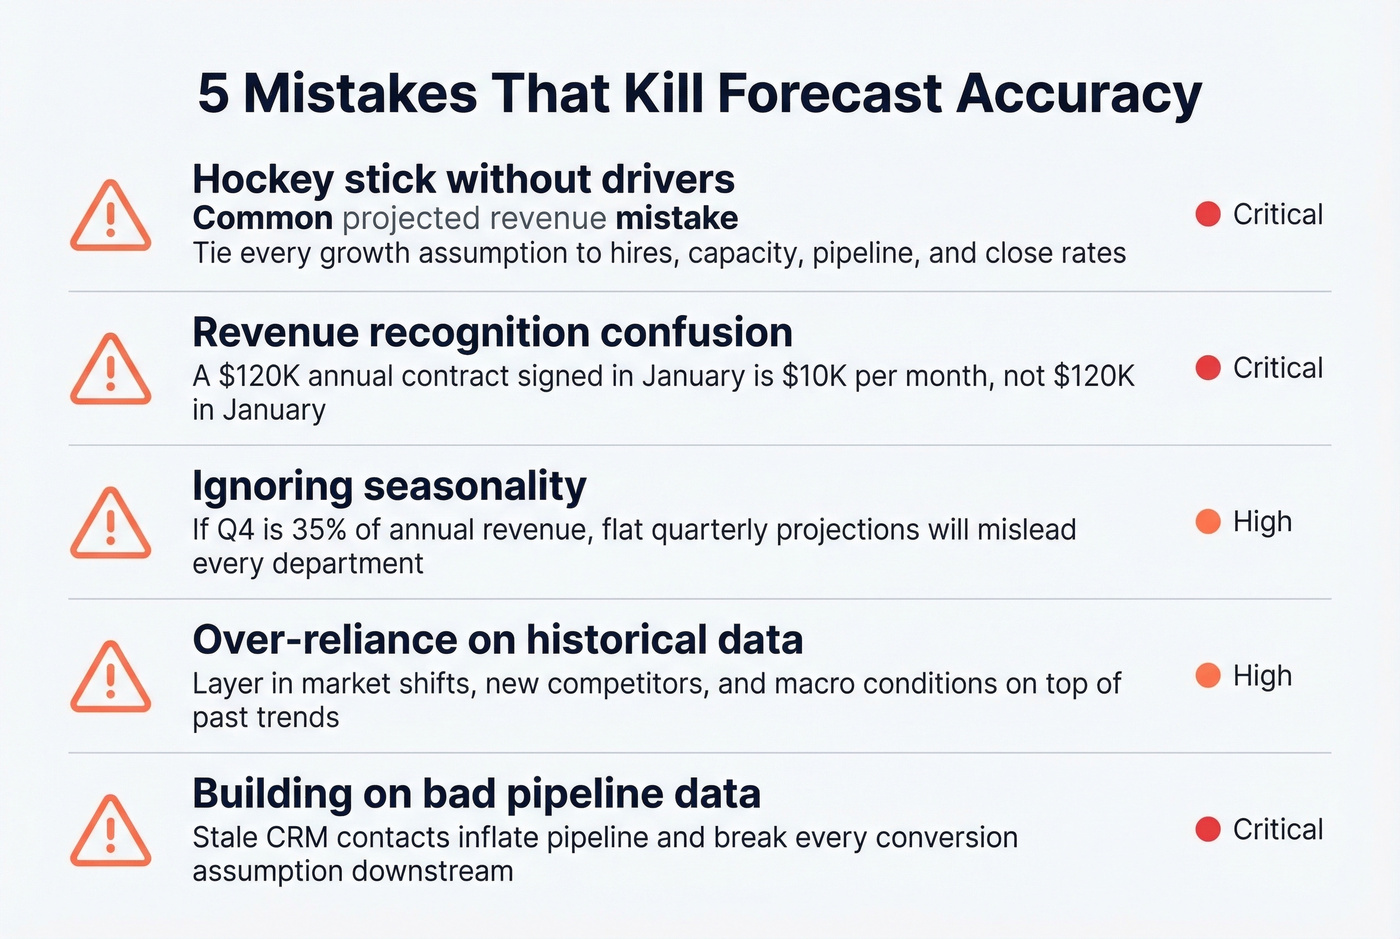
2. Revenue recognition confusion. A $120K annual contract signed in January isn't $120K of January revenue. It's $10K/month recognized over 12 months. Mixing up bookings (what you signed) with billings (what you invoiced) and revenue (what you recognized) is one of the fastest ways to produce a projection that looks great on paper and falls apart under scrutiny.
3. Ignoring seasonality. If your Q4 is consistently 35% of annual revenue and you're projecting flat quarters, your monthly numbers will be wrong even if the annual total is close. Seasonality affects hiring plans, cash flow, and capacity planning - not just the top line.
4. Over-reliance on historical data without external factors. History is a starting point, not a destination. Market shifts, new competitors, regulatory changes, and macroeconomic conditions all bend the curve. Layer in end-market growth rates and competitive dynamics on top of historical trends. Your sales projections should account for these external forces, not just extrapolate from last year's numbers.
5. Building on bad pipeline data. This one's subtle but devastating. If your CRM is full of stale contacts - wrong emails, outdated titles, people who left the company six months ago - your pipeline is inflated and every conversion assumption downstream is unreliable. Prospeo's email verification runs at 98% accuracy with a 7-day refresh cycle, so your pipeline reflects reality rather than wishful thinking. If you're diagnosing systemic sales pipeline challenges, this is usually one of the first root causes to audit.
How to Measure Forecast Accuracy
If you can't measure your forecast accuracy, you don't have a forecast. You have a guess.
| Accuracy Level | Range | What It Means |
|---|---|---|
| Acceptable | 80-85% | You're in the ballpark |
| Good | 85-95% | Reliable for planning |
| World-class | 95%+ | Single-digit error |
Track MAPE (mean absolute percentage error) as your primary metric - aim for 5% or less on quarterly forecasts and 8% or less on annual projections. MAE gives you the raw dollar variance. Forecast Bias tells you whether you're consistently over- or under-projecting, which is a pattern more dangerous than random error because it compounds over time.
Cycle time matters too. Your monthly forecast should close in 5-7 business days; quarterly projections in 10-12. If your finance team spends three weeks building a forecast, the data is stale before it's finished.
Here's a sobering benchmark: even after quotas were lowered by 13.3% in recent years, nearly 77% of sellers still missed quota according to Fullcast's benchmarks. That's not a quota-setting problem - it's a forecasting problem. (If you're building a repeatable process, it helps to align finance and RevOps on shared sales operations metrics so forecast error is visible and owned.)
Tools for Revenue Projections
| Tool | Starting Price | Best For |
|---|---|---|
| Google Sheets / Excel | Free / included | Everyone starting out |
| LivePlan | From $15/mo (annual) | Startups needing templates |
| Jirav | From $50/mo | Growing finance teams |
| Productive | From $9/user/mo (annual) | Services businesses |
| Zoho Finance Plus | From $249/mo (10 users) | Mid-market companies |
| Mosaic / Runway / Cube | Custom pricing | Scaling SaaS |
| Maxio / ChartMogul | Custom pricing | SaaS metrics tracking |
Under $5M ARR, start in Google Sheets. Seriously. A well-structured spreadsheet with an assumptions tab, a revenue build, and a monthly P&L will outperform any tool if the inputs are solid. We've seen teams spend months implementing FP&A software when their real problem was garbage assumptions, not a lack of features. For a free starting template, ProjectionHub offers a 1-year pro forma with exactly this structure - assumptions, revenue, operating expenses, salary planning, and outputs including a 12-month income statement, cash flow forecast, balance sheet projection, and charts.
Scaling past that, Jirav or Mosaic handle the complexity of multi-department models and rolling forecasts without requiring a full-time FP&A analyst. For SaaS-specific metrics like MRR waterfalls, cohort retention, and NRR, Maxio and ChartMogul are purpose-built.
Skip the enterprise tools if you're closing deals under $15K. You probably don't need a $3,000/month FP&A platform - you need accurate contact data and a clean spreadsheet. No forecasting tool will save you if your pipeline data is garbage. Fix the inputs first (starting with pipeline health and the assumptions that drive it).
Your MRR buildup model needs new customers flowing in predictably. Teams using Prospeo book 35% more meetings than Apollo users, with 98% email accuracy and bounce rates under 4% - turning your 'New MRR' line from a guess into a number you can defend.
Make your revenue projections actually hit. Start with better data.
FAQ
What's the difference between projected revenue and a forecast?
A forecast reflects expected outcomes based on current data and conditions. A projection models hypothetical what-if scenarios under specific assumptions - like entering a new market or doubling headcount. The AICPA draws this distinction clearly. Forecasts are operational; projections are strategic.
How far out should I project?
Focus on 12-18 months with quarterly rolling updates. Investors will ask for 3-5 year projections - build those as CAGR scenario models, but don't treat them as commitments. Anything beyond 18 months is directional, not operational.
What's a good forecast accuracy rate?
Aim for 85-95% accuracy on quarterly forecasts, measured by MAPE. Below 80% means your assumptions need rework. Above 95% is world-class - most teams should target 5% MAPE or less quarterly and 8% or less annually.
Can I project revenue without historical data?
Yes - use a bottom-up, driver-based approach. Estimate addressable market, conversion rates, average deal size, and sales capacity, then multiply through the funnel. This is how pre-revenue startups build credible sales projections for their first investor conversations.
How does pipeline data quality affect projections?
Stale CRM contacts with high bounce rates inflate your pipeline, making every downstream conversion assumption unreliable. Clean, verified contact data - refreshed weekly rather than monthly - keeps your revenue model grounded in real opportunities instead of phantom deals.