How to Reduce Customer Acquisition Cost: The Data-Backed Playbook
The median CAC-to-new-revenue ratio for SaaS hit $2.00 in 2024 - a 14% jump in a single year. Digital ad costs climbed another 5.13% market-wide. You're spending more to acquire customers who aren't necessarily worth more. That math breaks companies.
If you want to reduce customer acquisition cost, the answer isn't tweaking ad bids. It's fixing the structural problems underneath.
In our experience, the teams that actually lower CAC aren't optimizing campaign settings - they're fixing data quality and attribution. Most advice out there is generic ("optimize your funnel!") or too abstract to act on. We built this playbook on real benchmarks, a framework for the growth-vs-efficiency tradeoff, and 10 tactics ranked by impact.
The short version:
- Segment your CAC by channel. Blended CAC hides the real problem. In B2B SaaS benchmarks, organic CAC runs $205 while inorganic runs $341.
- Fix your outbound data quality. If your bounce rate is 5%+, you're burning budget invisibly on wasted rep time, tool spend, and domain reputation damage.
- Shift spend toward organic channels. Organic CAC is typically lower than inorganic across the industries in the data.
How to Calculate CAC (And Common Mistakes)
The formula is simple: (Total Marketing + Sales Costs) / New Customers Acquired = CAC.
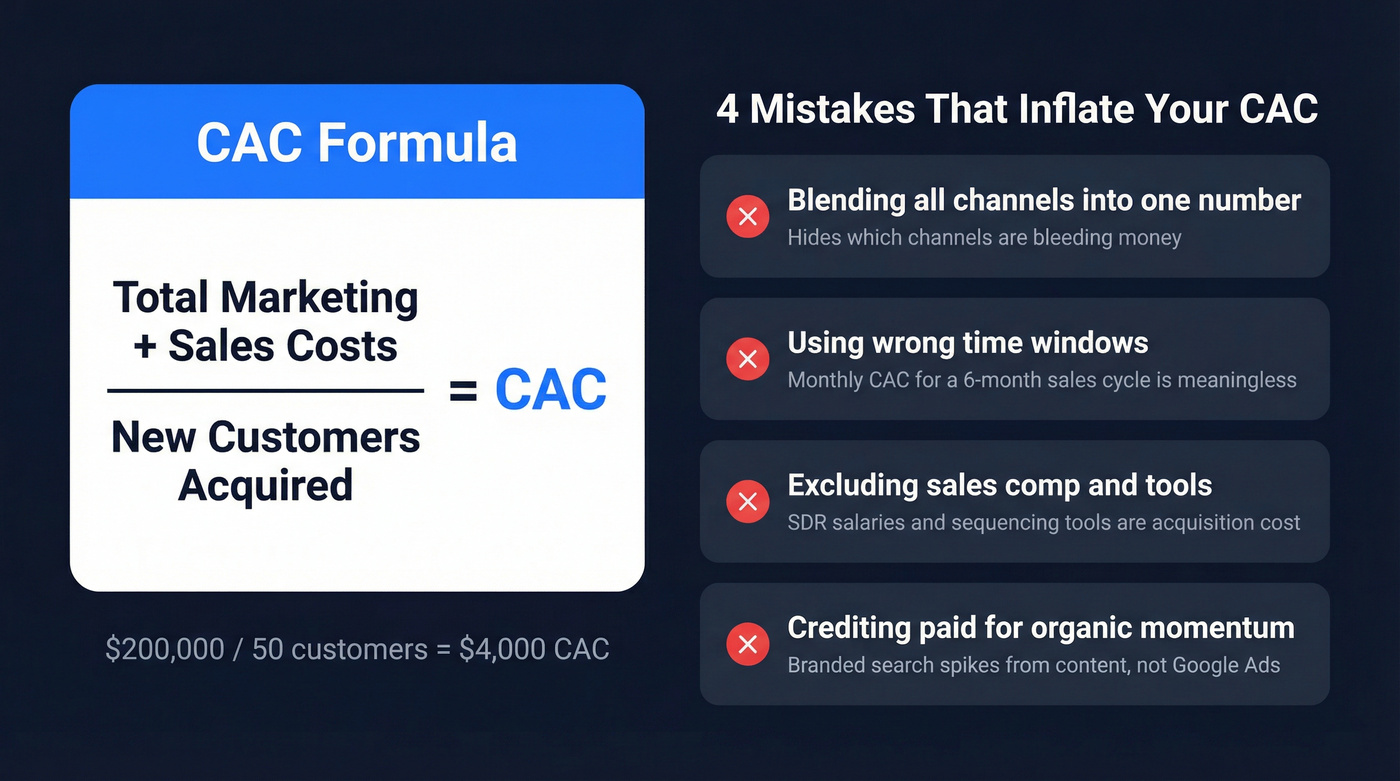
Say you spent $120,000 on marketing and $80,000 on sales in Q1 - including comp, tools, and overhead - and closed 50 new customers. Your CAC is $200,000 / 50 = $4,000. Straightforward, until you start making the mistakes nearly everyone makes.
Four mistakes that silently inflate your CAC number:
- Blending all channels into one number. A single CAC figure tells you nothing about which channels are efficient and which are hemorrhaging money. SEO and paid social have wildly different economics.
- Using wrong time windows. Calculating monthly CAC for a product with a 6-month sales cycle produces meaningless numbers. Match the window to your actual sales cycle length.
- Excluding sales comp and tools. If your SDRs cost $70K/year each and you're running $3K/month in sequencing tools, that's acquisition cost. Leaving it out flatters the metric.
- Misattributing organic lift to paid campaigns. That branded search traffic spiked after your content marketing hit its stride, not because of your Google Ads. Attribution models that give paid credit for organic momentum will steer you wrong every time.
CAC Benchmarks by Industry
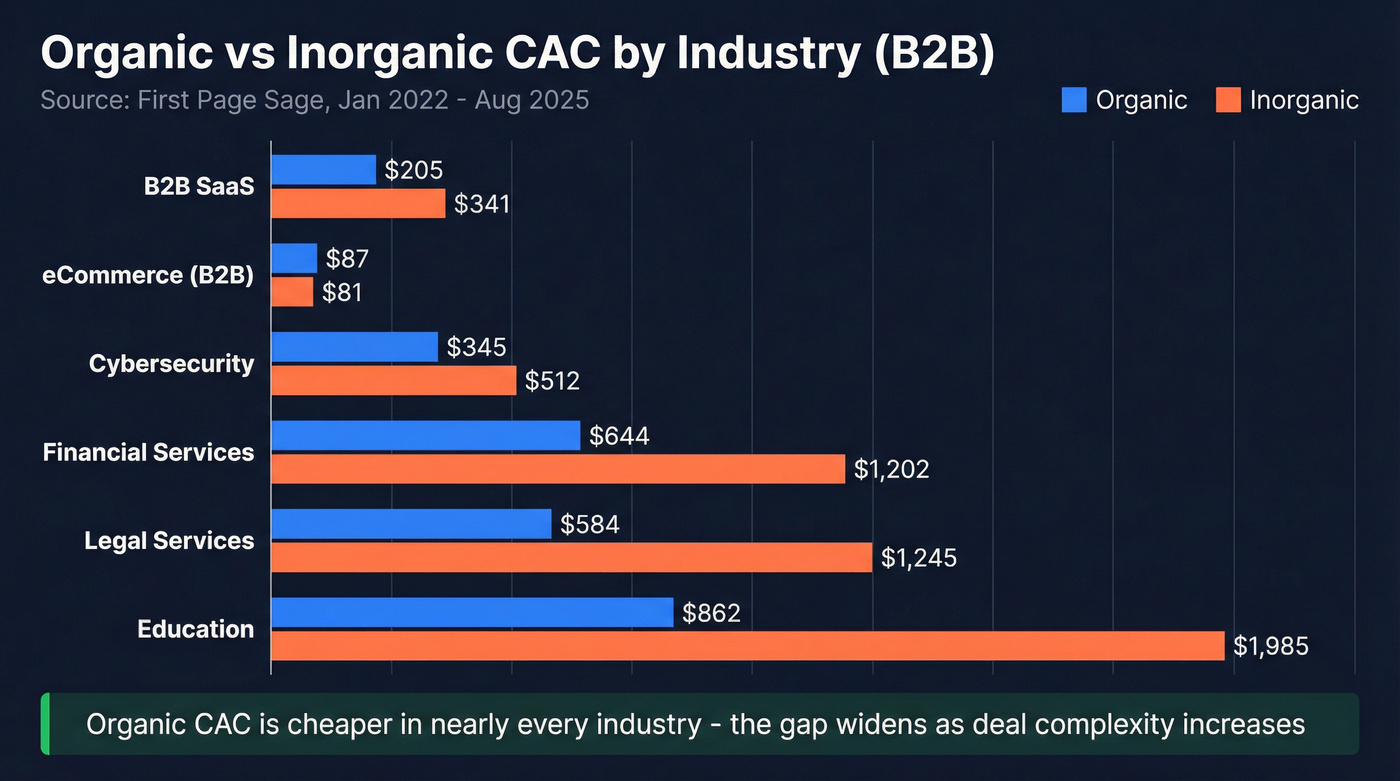
Benchmarks are directional, not gospel - but they're useful for spotting whether you're in the right ballpark or dramatically overspending. The most comprehensive B2B dataset comes from First Page Sage, covering client data from January 2022 through August 2025.
| Industry | Organic CAC | Inorganic CAC | Combined CAC |
|---|---|---|---|
| B2B SaaS | $205 | $341 | $239 |
| eCommerce (B2B) | $87 | $81 | $86 |
| Cybersecurity | $345 | $512 | $387 |
| Financial Services | $644 | $1,202 | $784 |
| Legal Services | $584 | $1,245 | $749 |
| Education | $862 | $1,985 | $1,143 |
| Fintech SaaS | - | - | $1,450 |
| Legaltech SaaS | - | - | $299 |
Fintech and Legaltech SaaS rows show combined-only figures due to insufficient channel-level data in the source.
The pattern is clear: organic CAC is materially cheaper than inorganic in most industries. Financial services is one of the starkest examples - $644 organic vs. $1,202 inorganic. For teams focused on lowering acquisition costs, shifting toward channels like SEO and content is the most reliable structural fix.
One caveat: First Page Sage's "combined" figure uses a 75/25 organic-to-inorganic weighting, which skews toward their client mix. Your actual blend will differ, and that's exactly why you need to segment by channel rather than relying on a single blended number.
Metrics That Actually Matter
CAC alone doesn't tell you if your business is healthy. Two companion metrics turn it from a number into a decision-making tool.
LTV:CAC Ratio
According to HBS Online research, an LTV:CAC ratio of 3 or higher indicates a scalable business. Below 1 means you're losing money on every customer. Between 1 and 2 is break-even territory that'll worry investors. At 3+, you've got room to reinvest in growth.
If your average customer generates $12,000 in lifetime value and costs $4,000 to acquire, your ratio is 3:1 - healthy. If that same customer costs $8,000 to acquire, you're at 1.5:1, and you need to either increase retention or cut acquisition costs.
CAC Payback Period
LTV:CAC tells you if the economics work eventually. Payback period tells you how long you're underwater. The Optifai benchmark study surveyed 939 B2B SaaS companies across Q1-Q3 2025 and found a median payback of 15 months.
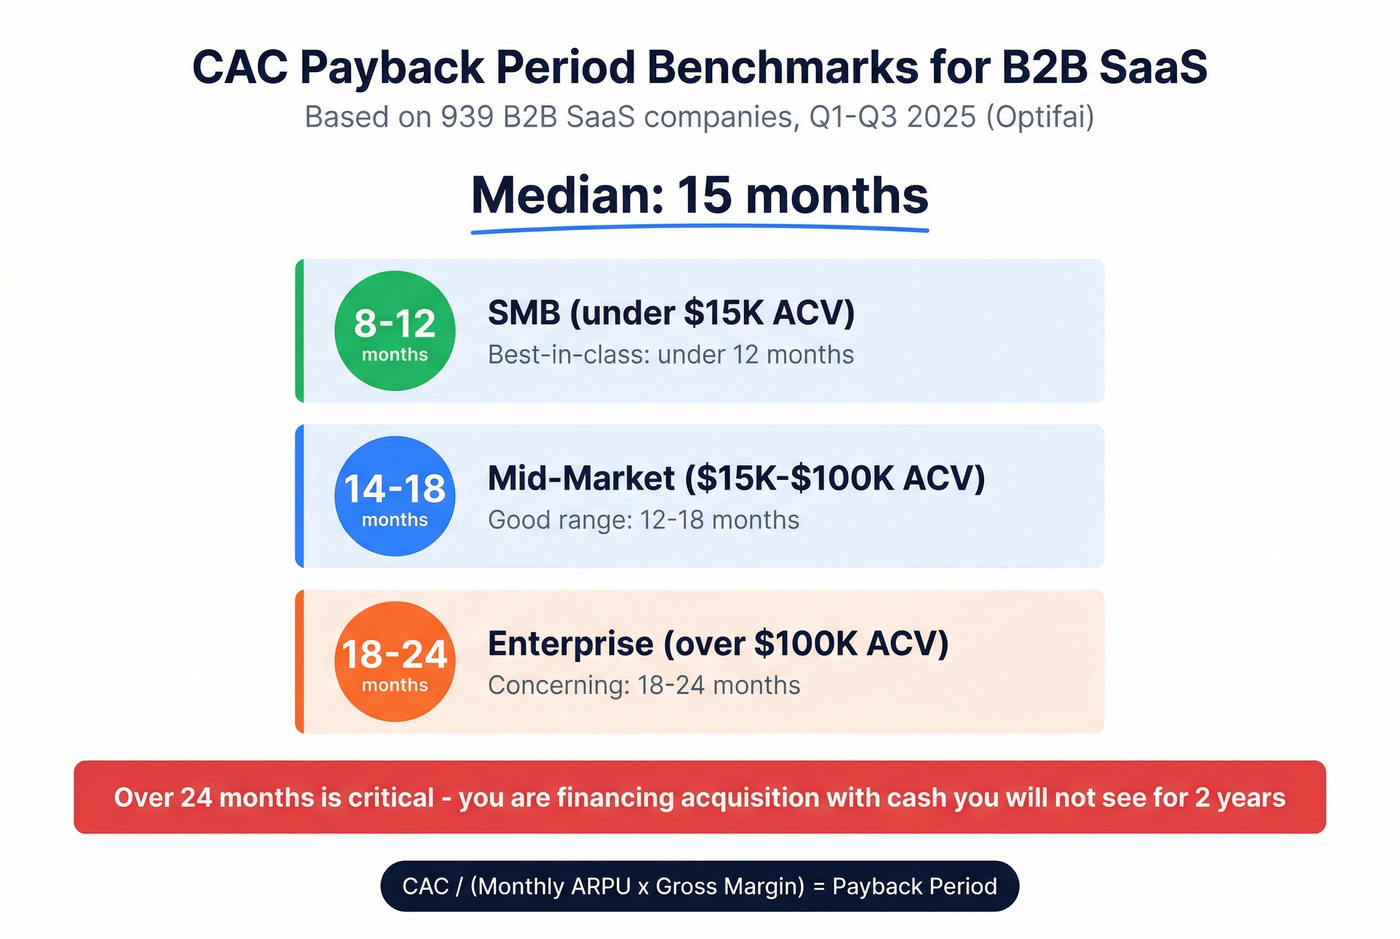
| ACV Segment | Target Payback | Health Band |
|---|---|---|
| SMB (<$15K) | 8-12 months | Best-in-class <12 |
| Mid-market ($15K-$100K) | 14-18 months | Good: 12-18 |
| Enterprise (>$100K) | 18-24 months | Concerning: 18-24 |
Anything over 24 months is critical. You're financing customer acquisition with cash you won't recoup for two years. For seed and Series A companies, investors want payback under 12 months.
The formula: CAC / (Monthly ARPU x Gross Margin). A $12,000 CAC with $1,000 monthly ARPU and 80% gross margin gives you 15 months. Tighten any of those three variables and the payback shrinks.
Bad data is a hidden CAC multiplier. Every bounced email wastes rep time, burns tool credits, and damages your domain reputation. Prospeo delivers 98% email accuracy with a 7-day data refresh - so your outbound spend actually converts instead of inflating acquisition costs.
Stop financing your competitor's inbox. Fix your data quality at $0.01 per email.
Growth vs. Efficiency: The Real Tradeoff
Here's where most CAC advice falls apart. Every tactic that reduces acquisition cost also tends to constrain growth. Cut paid spend and your CAC drops - but so does pipeline volume. This is the core tension.
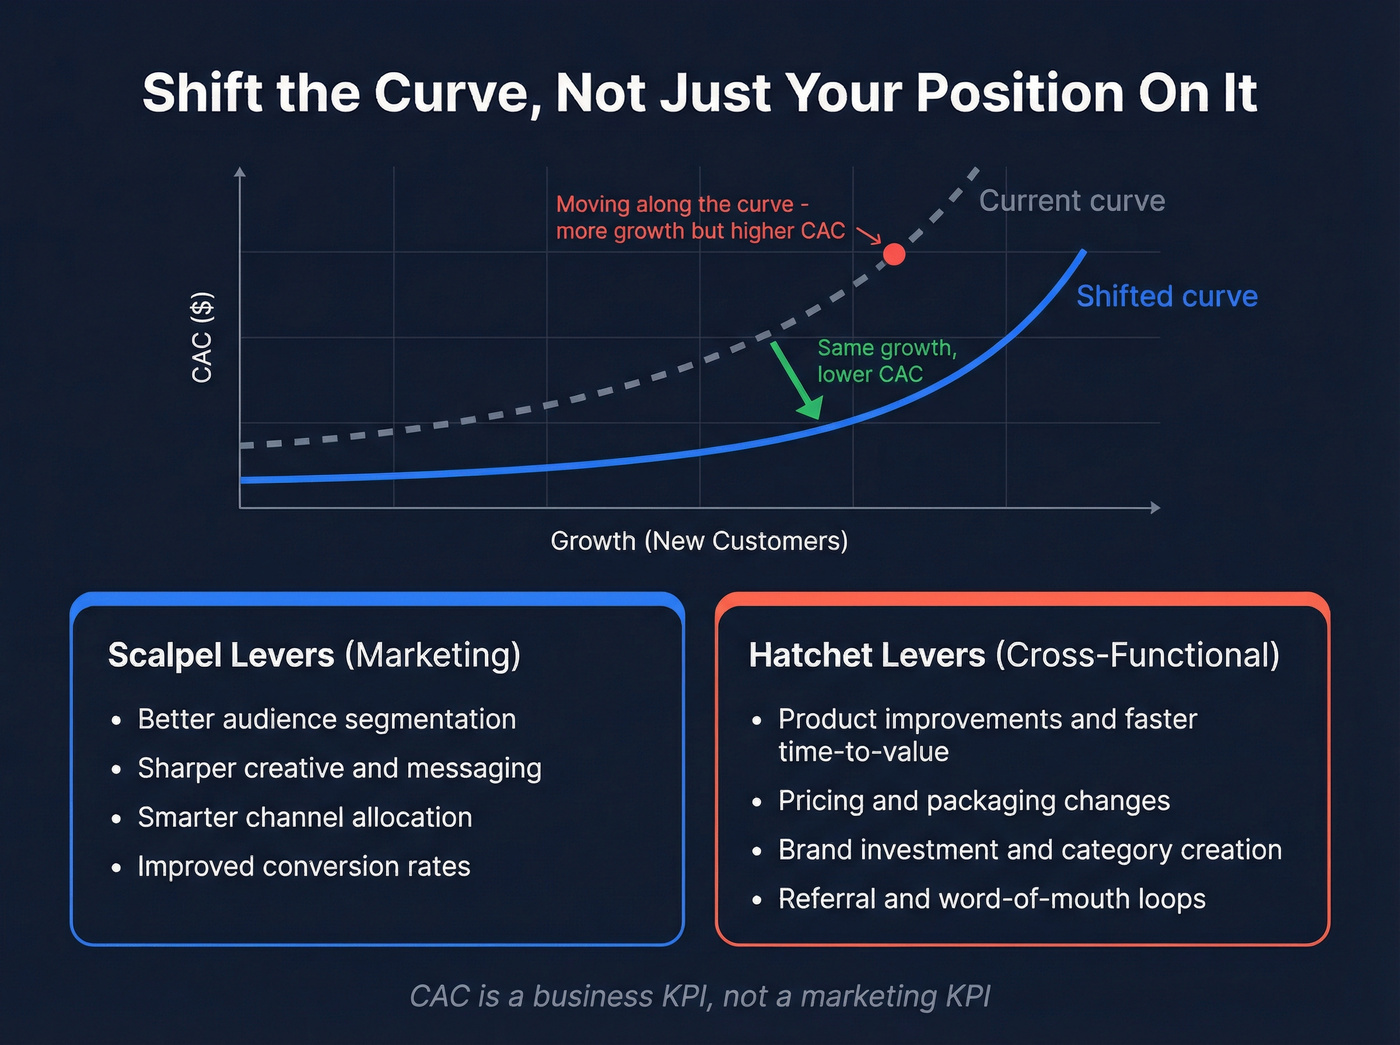
Right Side Up's "shift the curve" model captures this well. Think of your customers as concentric circles around your strongest value proposition. The inner circle - your ideal buyers - converts cheaply. As you push outward to reach less-perfect-fit prospects, CAC rises. That's moving along the curve.
Leadership doesn't want you to move along the curve. They want you to shift the entire thing - getting more growth at the same CAC, or the same growth at lower CAC. That requires a different set of levers entirely.
"Scalpel" levers are marketing execution: better segmentation, sharper creative, smarter channel allocation. "Hatchet" levers are cross-functional: product improvements, pricing changes, brand investment, category creation. CAC is a business KPI, not a marketing KPI. If your product's time-to-value is terrible, no amount of campaign optimization will fix your acquisition economics.
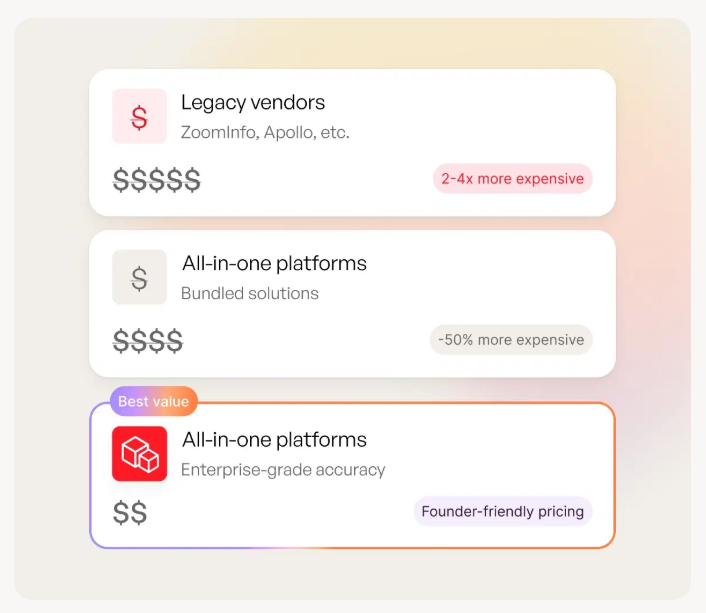
Here's the thing: if your deals average under $10K, you probably don't need ZoomInfo-level data infrastructure or enterprise marketing automation. A clean contact list, a solid sequence, and a product that delivers fast time-to-value will outperform a $100K/year cost of sales tech stack every time.
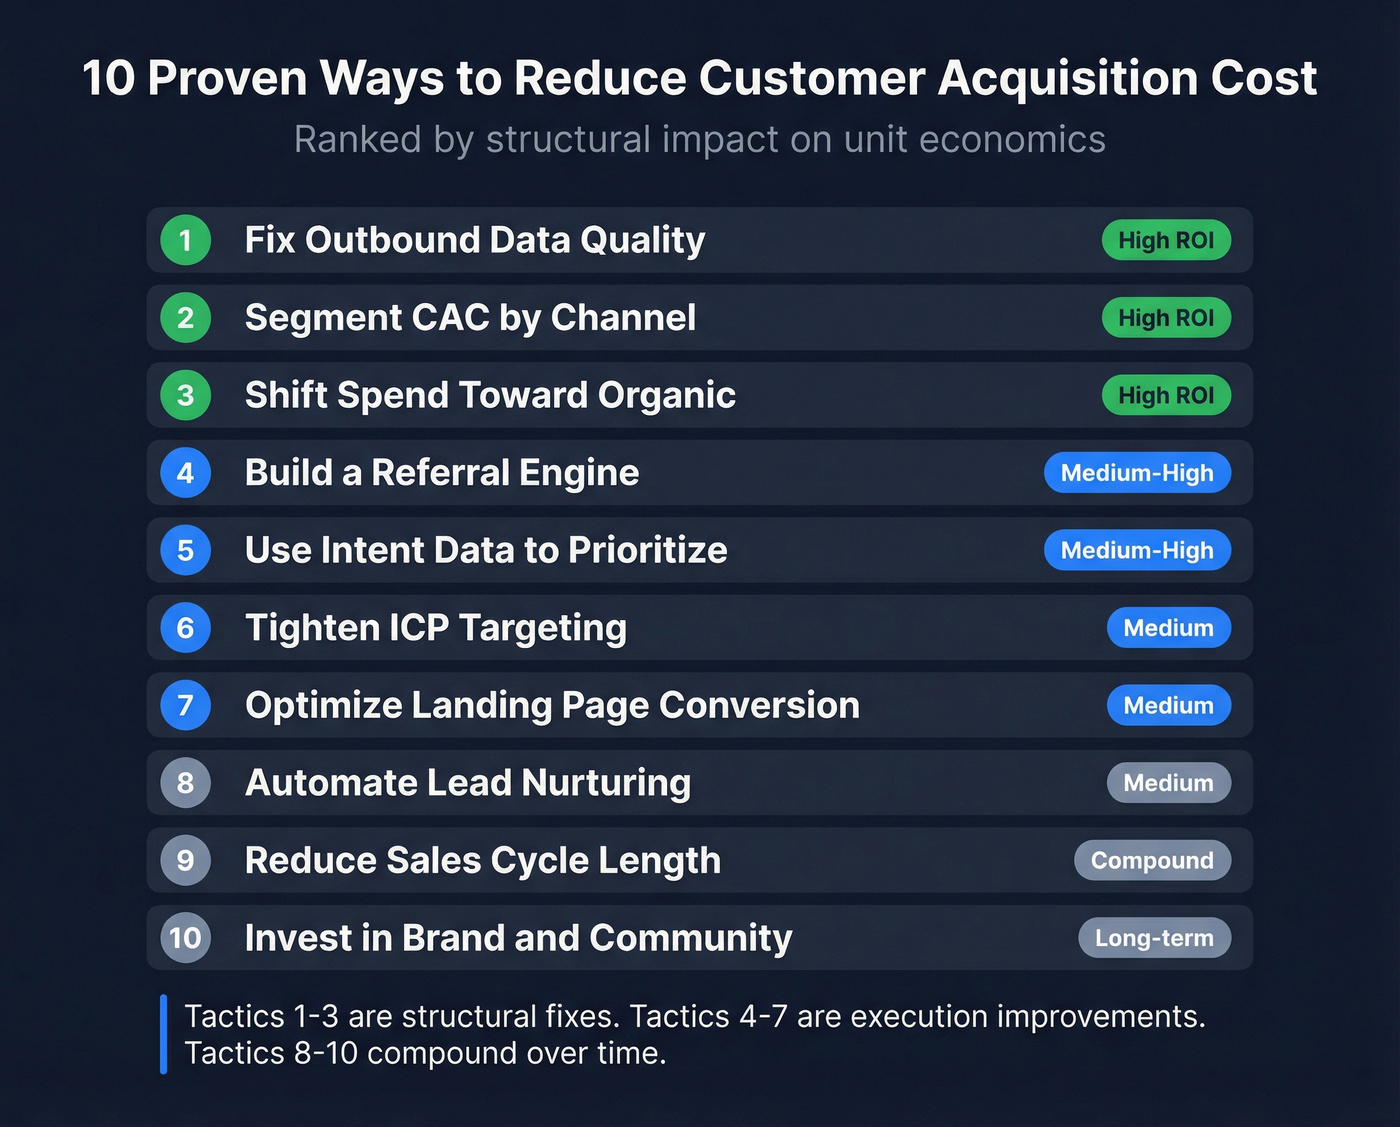
10 Proven Ways to Lower CAC
1. Fix Outbound Data Quality
Bad data is the most overlooked CAC inflator in B2B. When 20-40% of your emails bounce, you're not just wasting send credits - you're burning rep time on dead contacts, damaging sender reputation, and paying for sequencing tools that deliver messages to nobody.
I've seen this pattern repeatedly: a team blames their messaging or targeting when the real problem is that a third of their contact list is garbage. Meritt, an outbound agency, was running a 35% bounce rate before switching to Prospeo. After the switch, bounces dropped under 4% and pipeline tripled from $100K to $300K per week. Same team, same messaging, same ICP - just clean data.
Skip this tactic if your bounce rate is already under 3% and your reply rates are healthy. For everyone else, this is the highest-ROI fix you'll make.

Teams using Prospeo book 35% more meetings than Apollo users - same headcount, lower CAC. With 300M+ verified profiles, 30+ targeting filters, and intent data across 15,000 topics, you reach inner-circle buyers without pushing outward on the curve.
Shift the curve instead of moving along it. Start with data that actually connects.
2. Segment CAC by Channel
This is the single highest-leverage analytical move you can make. Blended CAC masks enormous channel-level variance. MQL-to-SQL conversion rates tell the story: SEO converts at 51%, email at 46%, PPC at 26%. Meanwhile, average B2B cost-per-lead runs $84 overall, $70 on Google Ads, and $110 on LinkedIn.
Do the math on your own channels. You'll almost certainly find that your organic customers are subsidizing your paid social customers. That doesn't mean you kill paid - it means you allocate with open eyes and hold each channel to its own efficiency standard.
3. Shift Spend Toward Organic
Once you've segmented, the move is obvious. In the First Page Sage dataset, organic CAC runs lower than inorganic in most industries. B2B SaaS: $205 vs. $341. The gap widens dramatically in financial services and education.
Organic takes longer to compound, which is why most teams over-index on paid. But every dollar shifted from paid to content, SEO, and community compounds over time rather than resetting to zero each month. The consensus on r/SaaS and r/startups is consistent: teams that scale paid spend before achieving product-market fit, then blame "high CAC," are solving the wrong problem. Organic forces you to build something worth finding.
4. Build a Referral Engine
Let's do the math: a $20 referral cost vs. a $239 blended SaaS CAC is a 90%+ reduction per referred customer. Referrals won't replace your entire acquisition engine - Prefinery's benchmark data shows the average SaaS referral rate sits at 4.75%. But those referred customers spend 25% more and churn 18% less, which means the LTV impact compounds well beyond the initial savings.
The catch: referral programs require a product worth referring. If your NPS is below 30, fix the product before building the program.
5. Use Intent Data to Prioritize
Cold outbound is expensive because most of your list isn't in-market. Intent data flips the equation by focusing reps on prospects actively researching solutions like yours. Intent-prioritized outbound typically converts 2-3x higher than cold lists - same rep time, dramatically higher conversion.
Do this, not that:
- Don't spray 1,000 cold emails at a static list and hope for 1% reply rates.
- Target 200 prospects showing active buying signals and convert at 3-5%.
You can layer intent signals with firmographics and role filters to find the right people at the right companies at the right time - tools like Bombora track thousands of intent topics that signal active buying research.
6. Optimize Conversion Rates
CRO is a pure CAC lever: same spend, more customers, lower cost per acquisition. The mistake most teams make is optimizing everywhere at once. Find your highest-drop-off stage and fix that first.
Here's a quick calculation: if 60% of your demos don't convert to proposals, a 20% improvement in that single stage has the same CAC impact as cutting your marketing budget by 20% - without losing any pipeline volume. Pull up your funnel metrics right now and find the biggest leak. That's where the money is, not your landing page headline.
7. Improve Retention
Acquiring new customers costs 5-25x more than retaining existing ones. Existing customers are 60-70% likely to buy again vs. 20% for new prospects, and a 5% retention increase drives 25-95% more profit.
Retention doesn't show up in the CAC formula directly, but it shows up in LTV:CAC and payback period. Every customer who churns at month 4 instead of staying for 24 months effectively triples your real acquisition cost. We've watched teams obsess over top-of-funnel efficiency while ignoring a 15% monthly churn rate that made every acquisition dollar worthless. Lowering CAC means nothing if you can't keep the customers you've already paid to acquire.
8. Accelerate Time-to-Value
The faster a new customer reaches their "aha moment," the less likely they are to churn in the first 90 days. Early churn is the silent CAC killer - you've paid full acquisition cost for a customer who never generates meaningful LTV.
Streamline onboarding, reduce setup friction, and get users to value before buyer's remorse kicks in. The best teams measure time-to-first-value in hours, not weeks.
9. Adjust Pricing Strategy
Pricing is a payback period lever most teams ignore entirely. Annual plans paid upfront recover CAC immediately instead of over 12 monthly installments. Setup fees offset acquisition costs on day one. Usage-based pricing that grows with the customer shortens effective payback by front-loading revenue from high-usage accounts.
If your payback period exceeds 18 months, pricing restructuring will move the needle faster than any marketing tactic.
10. Invest in Brand
Brand is the ultimate curve-shifter. Strong brand awareness increases inbound conversion rates, shortens sales cycles, and reduces the cost of every other channel. It's the "hatchet" lever from the framework - cross-functional, slow to build, but powerful once it compounds.
We've watched teams spend 18 months building brand through content, community, and thought leadership, then see their paid CAC drop 30-40% because prospects already knew who they were before clicking an ad. Brand is the only lever that makes every other lever work better.
Strategic Mistakes That Inflate CAC
Beyond the calculation errors above, five organizational mistakes quietly destroy your acquisition economics:
Treating CAC as a marketing-only metric. Product, sales, and CS all influence acquisition cost. A slow onboarding flow or a confusing pricing page is a CAC problem, not a marketing problem.
Optimizing CAC without considering payback. A $500 CAC that pays back in 6 months is healthier than a $200 CAC that takes 24 months. The number without the timeline is meaningless.
Ignoring channel mix drift. Your channel mix shifts as you scale. The paid-to-organic ratio that worked at $1M ARR will produce very different CAC at $10M. Revisit quarterly.
Scaling paid before product-market fit. This is the most expensive mistake in SaaS. Pouring money into ads for a product with 8% monthly churn is lighting cash on fire. Fix retention first.
Letting data quality degrade silently. Contact databases decay at 2-3% per month. If you're not actively maintaining data freshness, your outbound CAC creeps up 20-30% annually without anyone noticing.
FAQ
What is a good customer acquisition cost?
B2B SaaS averages $239 per the First Page Sage dataset, but the real benchmark is your LTV:CAC ratio - aim for 3:1 or higher. A $5,000 CAC is perfectly healthy if your LTV is $20,000. A $200 CAC is terrible if customers churn in two months.
How can I reduce customer acquisition cost without slowing growth?
Segment CAC by channel and double down on your most efficient sources, then fix data quality issues that silently inflate outbound costs. The goal is to shift the efficiency curve - getting the same or more pipeline at lower cost - rather than simply cutting spend.
How do you calculate CAC payback period?
Divide your CAC by monthly ARPU multiplied by gross margin. A $12,000 CAC with $1,000 monthly ARPU and 80% gross margin gives you 15 months - right at the B2B SaaS median. Under 12 months is best-in-class; over 24 months is a red flag.
What's the difference between CAC and CPA?
CPA measures cost per any conversion - a signup, download, or trial start. CAC measures cost per paying customer and is always higher because not every conversion becomes a customer. Use CPA for channel optimization; use CAC for business-level economics.
How does bad data inflate acquisition costs?
Bounced emails and wrong numbers waste rep time and tool spend without producing customers. If 20% of your list bounces, you're paying 20% more per prospect reached. Cleaning your data with a verification tool that refreshes weekly - rather than relying on stale databases - eliminates this hidden cost. Even free-tier tools like Hunter can help smaller teams start cleaning lists immediately.