Average Email Campaign Open Rate: What the Data Says in 2026
Your colleague says their open rate is 45%. Yours is 25%. Before you spiral, consider this: they're on Klaviyo sending to a 5,000-person ecommerce list, and you're on HubSpot sending B2B newsletters to 50,000 contacts. You're comparing apples to refrigerators.
We synthesized multiple major benchmark datasets covering 44B+ emails to pin down the average email campaign open rate. The numbers range from 15% to 43.46% - and that spread tells you everything about why this is the most misleading metric in email marketing.
Here's the quick version:
- Marketing campaigns (MPP included): ~31-43%
- Adjusted for MPP inflation + bot noise: 20-28%
- B2B specifically: ~18-23% in many benchmarks
- What to actually track: click rate, CTOR, conversions - opens are directional only (see Open Rate vs Click Rate)
What Is Email Open Rate?
Email open rate measures the percentage of delivered emails that recipients opened:
Open Rate = (Unique Opens / Delivered Emails) x 100
"Unique opens" means each recipient counts once, even if they open the email five times. "Total opens" counts every instance. Most ESPs default to unique opens in their reporting, but not all - and that distinction matters more than you'd think when comparing rates across platforms.
Say you send 10,000 emails, 500 bounce, and 3,800 of the remaining 9,500 open at least once. That's a 40% open rate. Simple enough. The problems start when you try to compare that number to anyone else's.
Email Open Rate Benchmarks in 2026
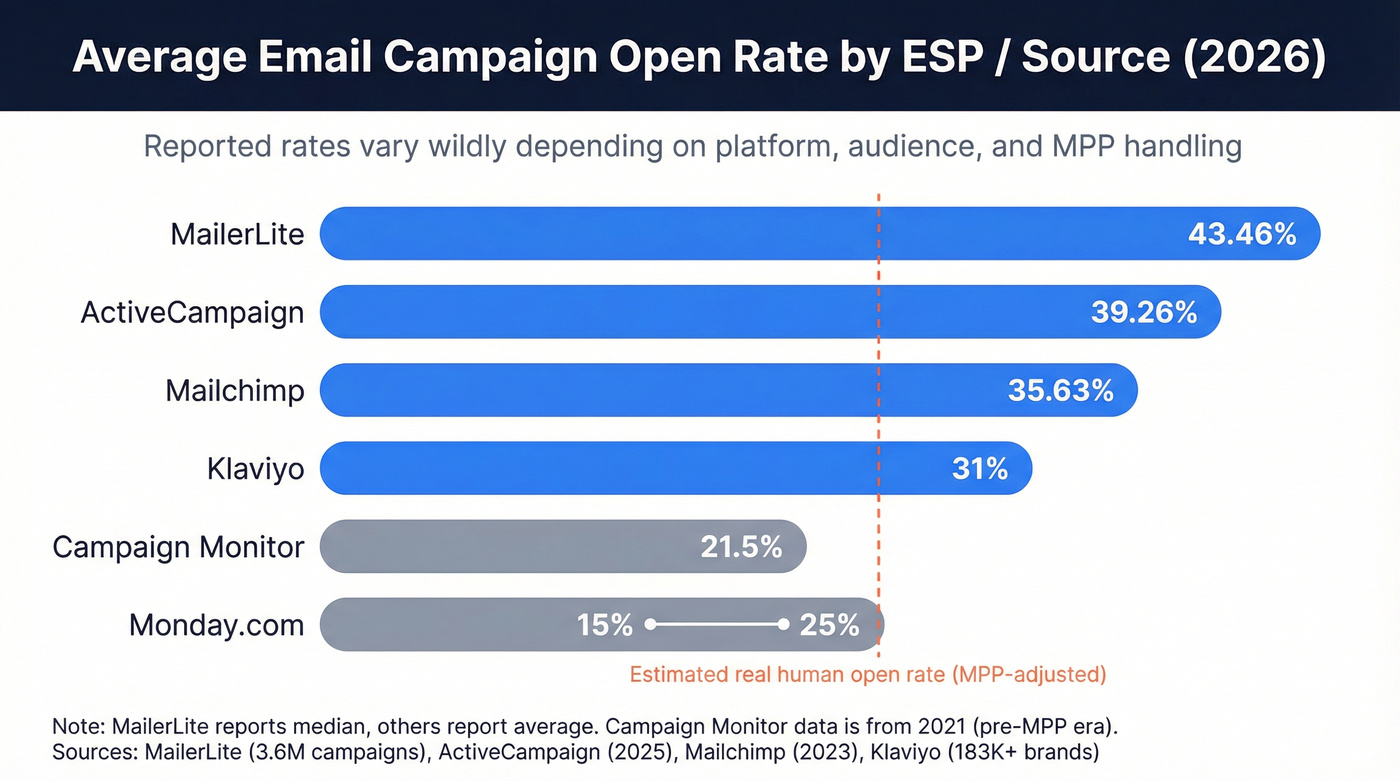
Here's what major sources report. Notice how wildly the numbers diverge.
| ESP / Source | Reported Rate | Dataset / Period | MPP Handling |
|---|---|---|---|
| MailerLite | 43.46% (median) | 3.6M campaigns, Dec 2024-Nov 2025 | Included (caveat noted) |
| ActiveCampaign | 39.26% (average) | Jan 1-Dec 10, 2025 | Included by default |
| Mailchimp | 35.63% (average) | 2023 data | Can exclude MPP opens for emails sent on/after June 22, 2024 |
| Klaviyo | 31% (average) | 2026 benchmarks (183,000+ brands) | Not specified |
| Monday.com | 15-25% | 2026 | Not specified |
| Campaign Monitor | 21.5% (average) | 2021 data (reported in 2022 benchmarks) | Pre-MPP era |
| Brevo | Not disclosed | 44B+ emails, 2025 | Says it accounts for Apple MPP |
A practical benchmark for modern ESP-reported data is roughly 31% to 43%, depending on list quality, audience, and how the platform counts opens.
If you adjust for Apple Mail Privacy Protection and security/bot noise, 20-28% is a useful estimate for "real human opens" in many audiences. For B2B, benchmarks commonly land lower: monday.com puts B2B around 18-22%, and SalesHive cites a 22.8% median B2B open rate from a 2023 analysis of 4.3B emails. (If you're running cold outbound, expect even lower.)
Monday.com's 15-25% range is the outlier on the low end, likely reflecting a broader mix of sends. Campaign Monitor's 21.5% is from 2021 - if you're still citing it, you're working off pre-MPP-era measurement.
Let's be honest: most teams obsess over whether their open rate is "good" when the real question is whether it's even measuring anything. Apple accounts for 49.29% of email opens as of early 2025, and MPP can register opens that never happened. Stop benchmarking fiction. Benchmark clicks.
Source quality ranking: MailerLite offers the best disclosure - median, dataset size, time window. ActiveCampaign and Klaviyo provide solid recent data. Brevo has the largest dataset but won't publish the number. Mailchimp's data is useful but older. Campaign Monitor is outdated for post-MPP benchmarking.
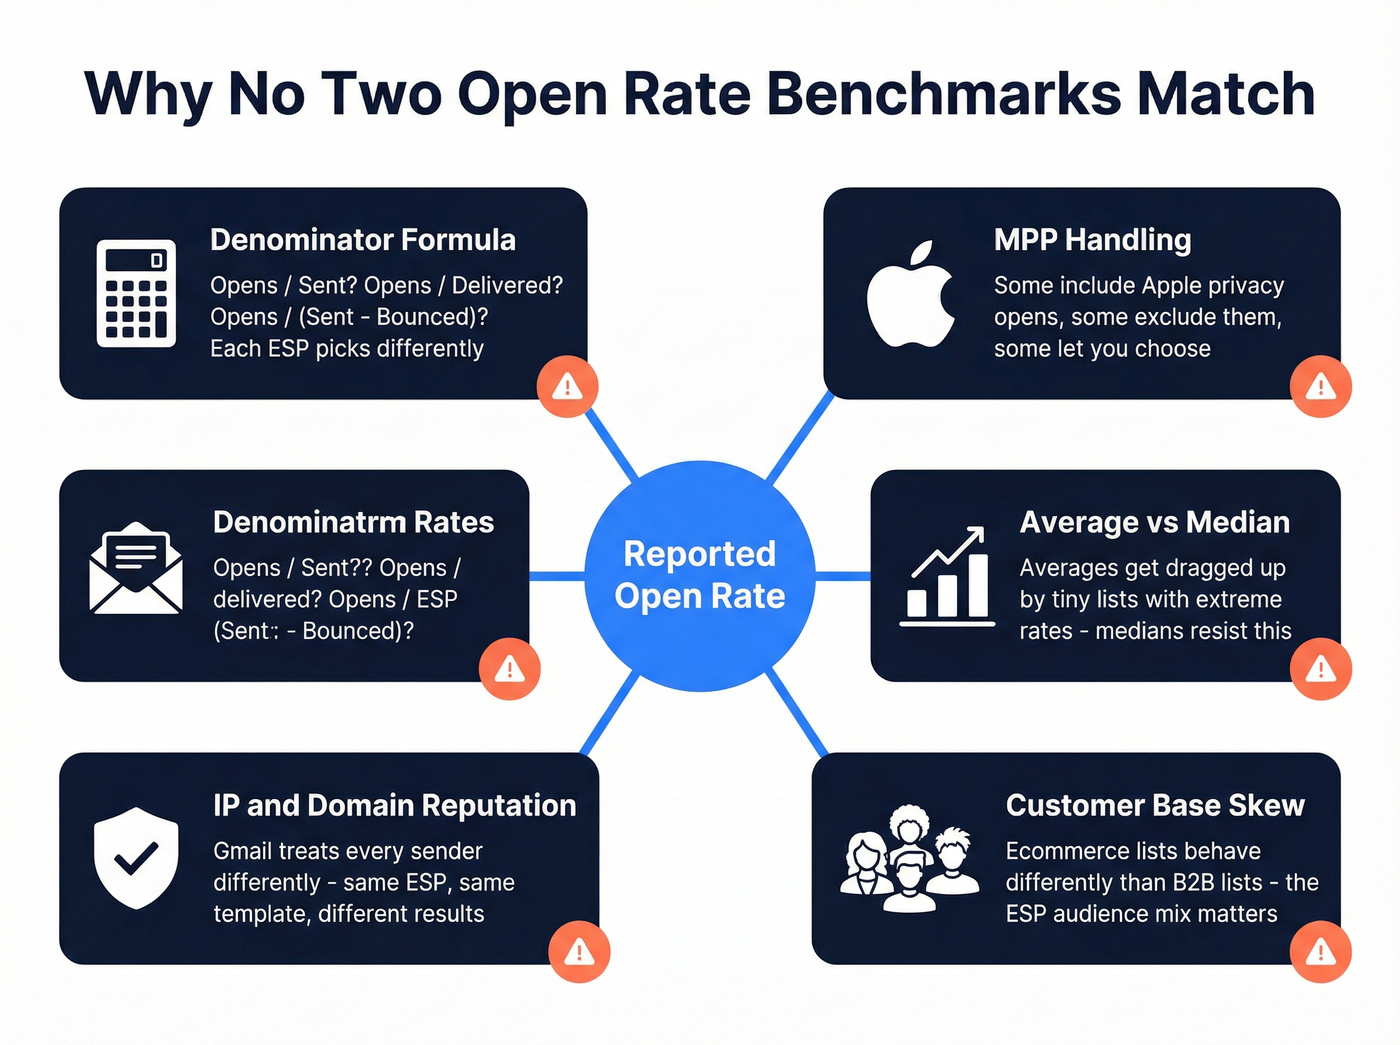
Why Every Benchmark Differs
ActiveCampaign says it plainly: comparing open rates between ESPs isn't a good way to choose a platform. Too many variables change simultaneously.
| ESP | Denominator | Unique vs. Total Default | MPP Policy | Customer-Base Skew |
|---|---|---|---|---|
| MailerLite | Opens / (Sent - Bounced) | Unique | Included | SMB, small engaged lists |
| ActiveCampaign | Opens / (Sent - Bounced) | Unique | Included | Broad: SMB to mid-market |
| Mailchimp | Opens / (Sent - Bounced) | Unique | Optional exclude (post June 2024) | SMB to enterprise, mixed |
| Klaviyo | Opens / Delivered | Unique | Not specified | Ecommerce-heavy |
| Monday.com | Not specified | Not specified | Not specified | CRM users, mixed sends |
| Campaign Monitor | Opens / Sent | Unique | Pre-MPP | Agency and enterprise |
Beyond these table-level differences, mailbox provider reputation and IP reputation create recipient-level filtering that no benchmark can account for. Two senders using the same ESP, same template, same subject line can get different open rates because Gmail treats their sending IPs differently. (If you're troubleshooting, start with an email deliverability checklist.)
MailerLite reports medians while ActiveCampaign reports averages. That alone can swing the number by several points, because a handful of tiny lists with extreme open rates drag the average up while barely affecting the median.
When MailerLite reports 43.46% and Monday.com reports 15-25%, neither is wrong. They're measuring different populations with different methods. Treating any single benchmark as "the" number is the mistake.
Open rates are inflated by bots and Apple MPP. The metric that actually matters? Whether your emails reach real inboxes. Prospeo's 5-step verification delivers 98% email accuracy - so your bounce rate stays under 4%, not your open rate benchmark.
Fix the data first. The metrics follow.
Open Rates by Industry
Industry matters more than most marketers realize. A software company and a nonprofit shouldn't be measuring themselves against the same yardstick, and yet that's exactly what happens when people Google "average open rate" and grab the first number they see.
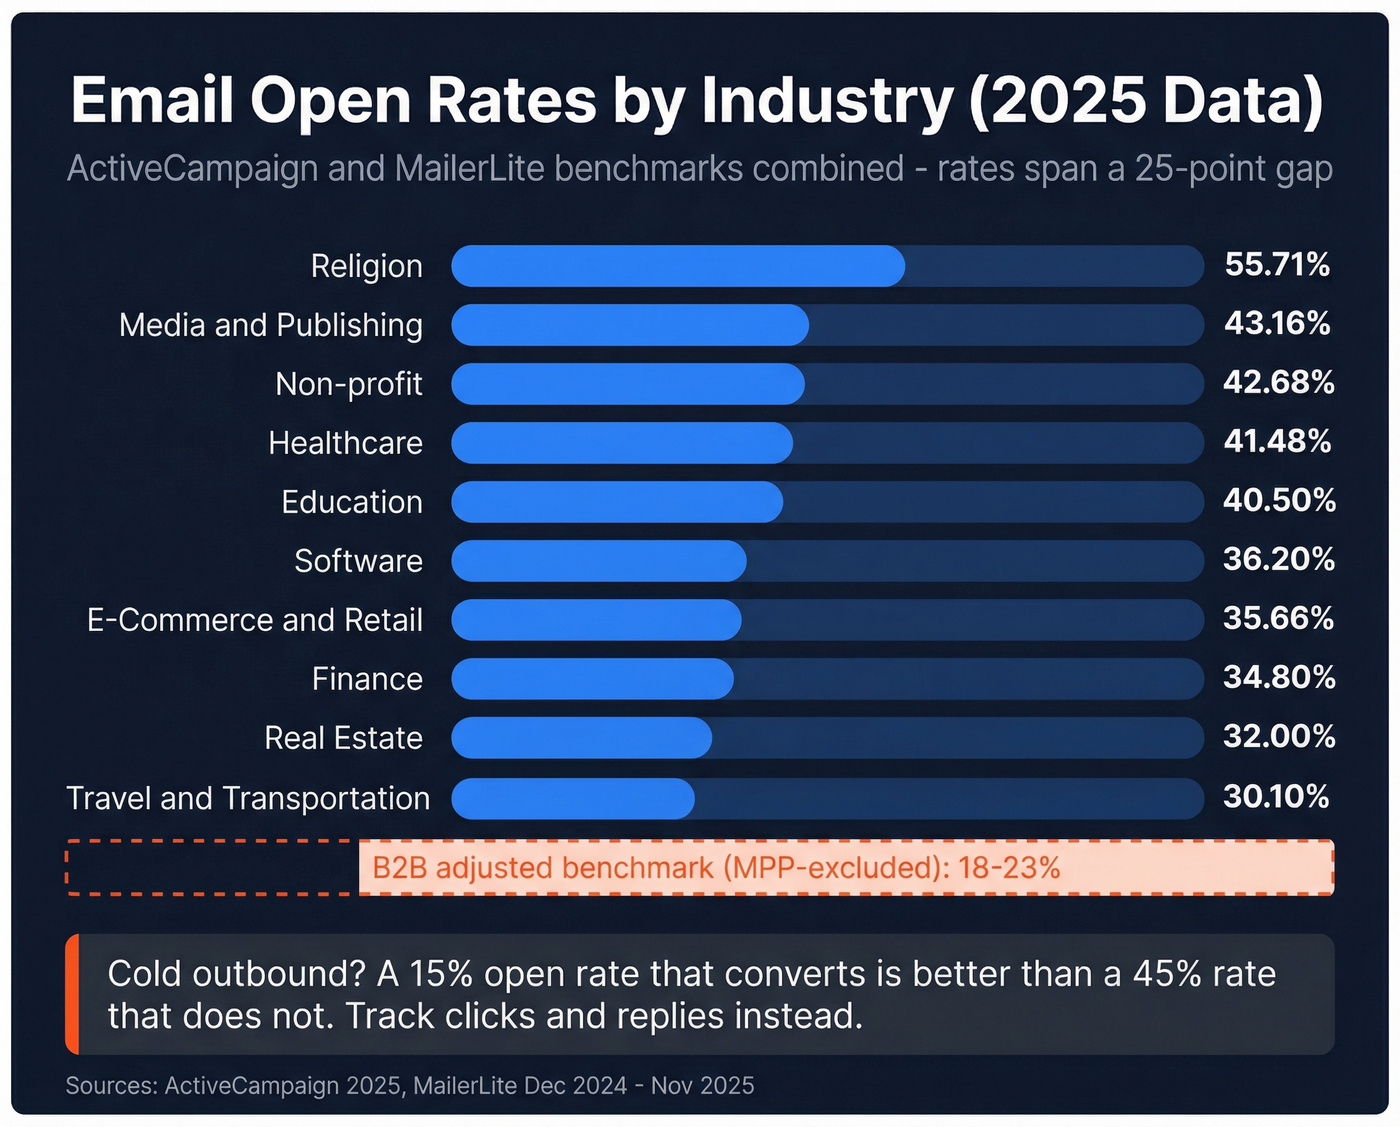
From ActiveCampaign's 2025 dataset:
- Media/Publishing: 43.16%
- Non-profit: 42.68%
- Healthcare: 41.48%
- Software: 36.20%
- E-Commerce/Retail: 35.66%
MailerLite's 2025 dataset shows just how wide the spread can get: open rates span 30.10% to 55.71%, with Religion (55.71%) at the top and Travel & transportation (30.10%) at the bottom. That's a 25-point gap between verticals using the same platform.
B2B cross-industry benchmarks commonly sit lower than opt-in newsletter benchmarks. Monday.com puts B2B around 18-22%, and SalesHive cites a 22.8% median from a 2023 B2B dataset. If you're running cold outbound, expect even lower - we've seen teams celebrate 15% on cold sequences, and honestly, that's fine if the clicks convert. (For subject line ideas when lists go stale, see re-engagement email subject lines.)
Why Your Open Rate Is Probably Inflated
Apple Mail Privacy Protection, introduced in September 2021, preloads tracking pixels for Apple Mail users. The email registers as "opened" whether the recipient reads it or not. Apple accounts for 49.29% of all email opens as of early 2025.
That's a huge chunk of unreliable open data. EmailTooltester also found roughly 27% of opens in one of their newsletters came from MPP.
When you combine MPP with corporate security scanners and bot pre-fetching, estimated inflation runs 5-15 percentage points depending on your audience's device mix. This is why reported averages have drifted upward since 2021 even as actual engagement hasn't necessarily improved.
ESPs handle this differently, which compounds the comparison problem:
| ESP | MPP Default | Change Date | User Control |
|---|---|---|---|
| Mailchimp | Can exclude MPP opens | June 22, 2024 | Option available for emails sent on/after that date |
| ActiveCampaign | Includes MPP | Aug 2022 | Filter per report |
| Brevo | Includes MPP | Feb 6, 2025 | Manual opt-out |
Here's the thing: when you compare your Mailchimp open rate to a friend's ActiveCampaign rate, you might be comparing MPP-excluded data to MPP-included data. The gap can be 10+ points from methodology alone - before you even consider list quality or content.
What to Track Instead of Opens
Opens are directional at best. Here's the metric hierarchy that actually tells you something:
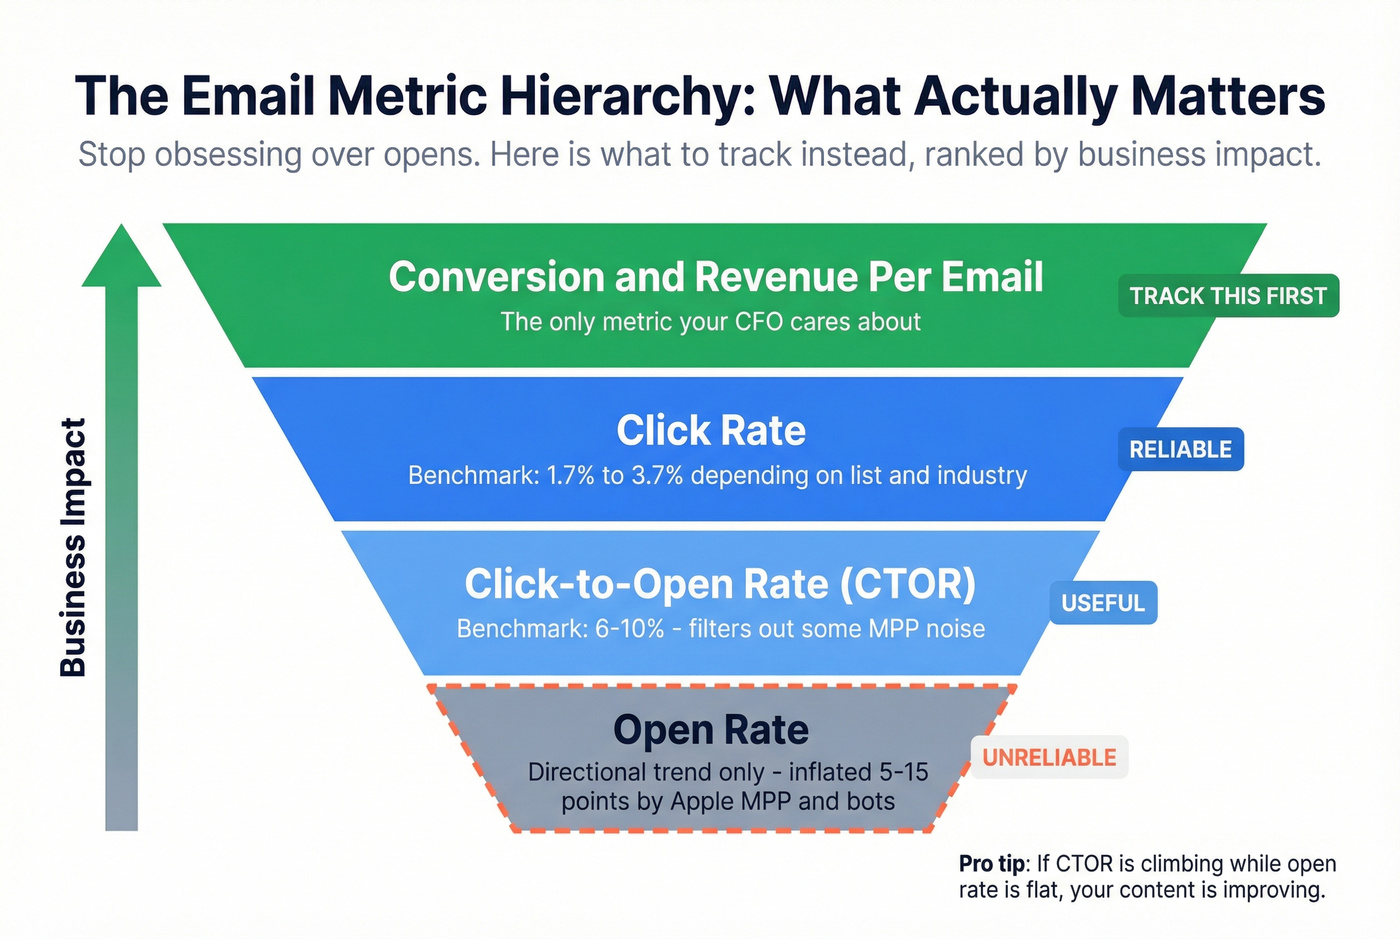
- Conversion / revenue per email - the only metric your CFO cares about
- Click rate - typically around 1.7% to 3.7% depending on list and industry
- Click-to-open rate (CTOR) - benchmark: 6-10% (MailerLite's 2025 median: 6.81%)
- Open rate - directional trend indicator only
CTOR is particularly useful because it measures engagement among people who actually opened - filtering out some of the MPP noise. If your CTOR is climbing while your open rate is flat, your content is getting better even if the top-line number doesn't move.
One interesting wrinkle from MailerLite's 2025 data: unsubscribe rates jumped from 0.08% to 0.22%, partly because Gmail UI changes make it easier to unsubscribe. Paradoxically, this can improve your open rate over time - disengaged subscribers remove themselves, leaving a more active list behind. Don't panic at rising unsubs. It's the metric cleaning itself.
The framework is simple. Opens for directional trends. Clicks for engagement. Conversions for ROI.
How to Improve Your Open Rate
Here's what moves the needle, ordered by impact.
Subject lines and sender name. Keep subject lines under 50 characters - under 9 characters performs best in some association-focused datasets, though that's hard to pull off consistently. More importantly, keep your sender name recognizable. People open emails from names they trust, not from "Marketing Team" or "noreply@." (If you're writing outbound, use these outreach email templates.)
Send timing and frequency. Tuesday through Thursday remains the sweet spot. Brevo's benchmark guidance points to Monday and Tuesday as peak days, with weekends performing worst. Stick to 1-3 emails per week. More than that and you'd better have exceptional content, or you'll watch your unsub rate climb fast. (For prospecting-specific timing, see best time to send prospecting emails.)
Segmentation and automation. Automated flows often outperform batch campaigns on engagement. Segment by behavior, not demographics. Someone who clicked your last three emails is a fundamentally different audience than someone who hasn't opened in 90 days - treat them that way. (If you want a deeper framework, see behavioral segmentation.)
List Hygiene: The Overlooked Lever
Here's the causal chain most marketers miss: bad email addresses lead to bounces, bounces damage sender reputation, damaged reputation tanks inbox placement, and lower inbox placement kills open rates. Your open rate problem might not be a content problem at all. It might be a data quality problem. (Related: hard bounce.)
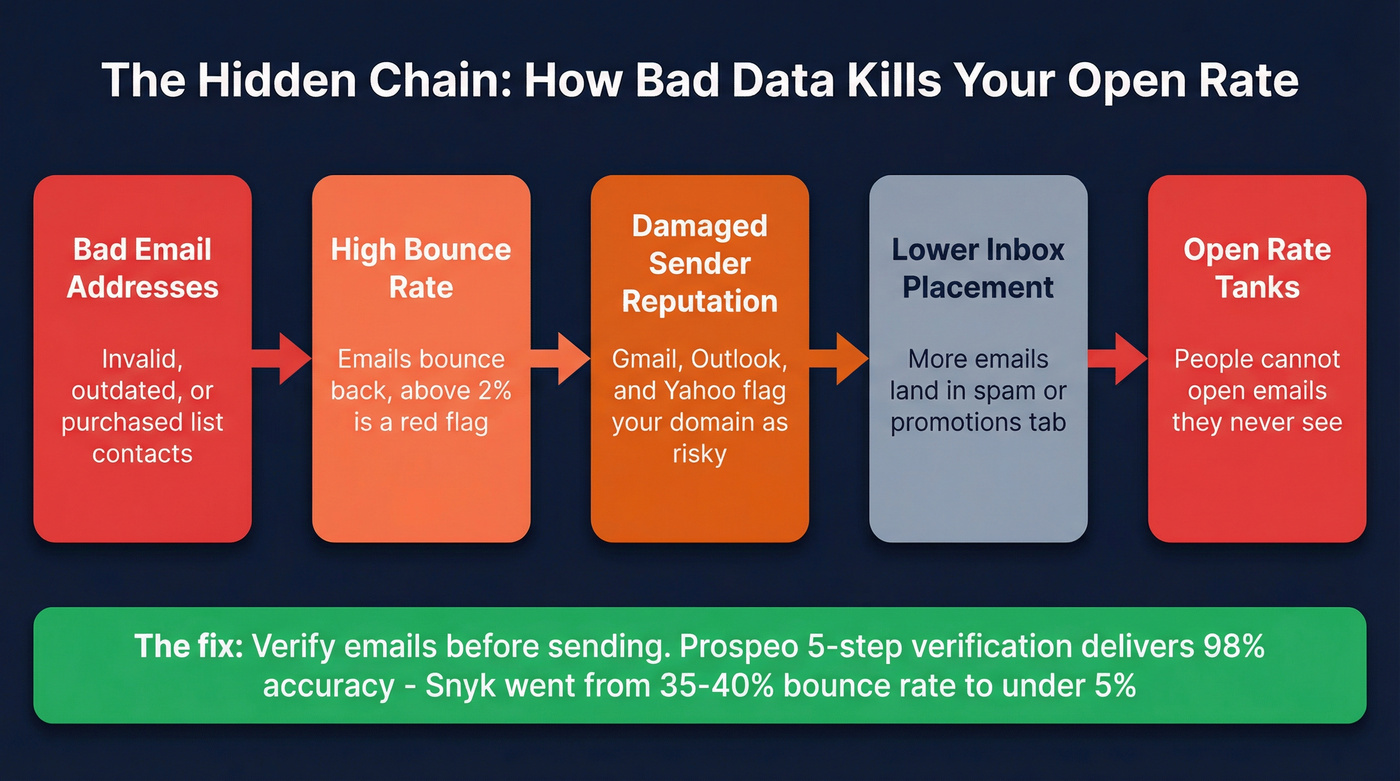
Clean your list every 3-6 months, and verify before every major campaign. Prospeo's 5-step verification catches invalid addresses, spam traps, and honeypots before they tank your sender reputation. At 98% email accuracy, the results back it up - Snyk's team went from a 35-40% bounce rate to under 5%, and their AE-sourced pipeline jumped 180%. (If you're comparing tools, start with email ID validators.)
If your bounce rate is above 2%, you don't have an open rate problem. You have a list quality problem. Fix that first, and the open rate follows.
You just read that B2B open rates sit around 18-23% - and half those opens might be fake. Instead of chasing a broken metric, build lists with contacts verified every 7 days. Prospeo gives you 143M+ verified emails at $0.01 each, so every send counts.
Benchmark-proof your outbound with data that's actually fresh.
FAQ
What's a good open rate for an email campaign?
Anything above 25% after adjusting for MPP inflation is solid for most senders. Ecommerce brands on platforms like Klaviyo often see 30%+, while B2B senders typically land in the 18-23% range. Compare against your own historical trend rather than chasing a single universal benchmark.
How does Apple MPP affect open rates?
MPP preloads tracking pixels, registering opens that never happened. Apple accounts for 49.29% of email opens, inflating reported rates by an estimated 5-15 percentage points. Some ESPs let you exclude MPP opens; others include them by default - always check your platform's settings before drawing conclusions.
What's the difference between open rate and CTOR?
Open rate measures unique opens divided by delivered emails. CTOR measures unique clicks divided by unique opens - the benchmark sits around 6-10%. CTOR is more reliable post-MPP because it evaluates engagement among actual openers, filtering out phantom opens from privacy features and bots.
How can I improve deliverability to boost open rates?
Verify your list every 3-6 months using a tool like Prospeo, Hunter, or ZeroBounce. Keep bounce rates under 2%, authenticate with SPF/DKIM/DMARC, and remove subscribers who haven't engaged in 90+ days. Clean data is the single biggest deliverability lever you can pull.
What's a good open rate for B2B email?
B2B open rates commonly land around 18-23% across major benchmarks. If your ESP includes MPP opens by default, your reported number likely overstates real engagement. Track CTOR and click rate alongside opens for a more accurate picture of how your campaigns actually perform.