Open Rate vs Click Rate: The Metric You're Optimizing Is Probably Wrong
Your CMO just shared the monthly email report. Open rates are up 15%, the team's celebrating, and someone's already crediting the new subject line strategy. Meanwhile, pipeline hasn't moved. Replies are flat. Click-throughs are actually down.
The open rate vs click rate debate isn't academic - it's the difference between celebrating vanity metrics and tracking what drives pipeline.
The Short Version
- Click rate is the first metric that requires a human decision. Open rate doesn't.
- Post-Apple MPP, roughly 20-50% of recorded opens are machine-generated depending on your audience mix and email client distribution.
- Industry benchmarks are useful as context, not targets. Benchmark against your own 3-12 months of data.
- If you're reporting open rates to leadership without an MPP caveat, your numbers are misleading.
Definitions That Actually Matter
Formulas first, opinions after.
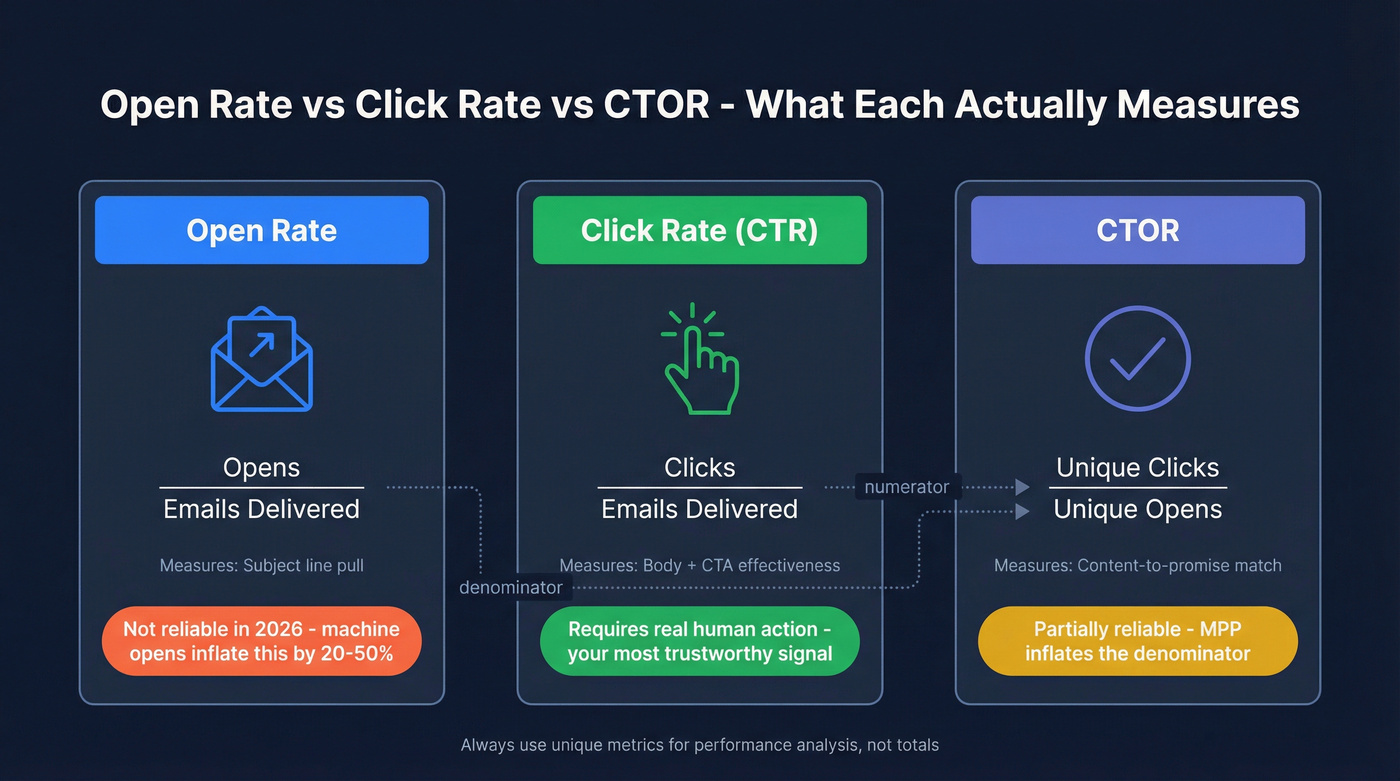
Open rate = total opens / emails delivered. It tells you whether your subject line and sender name earned attention - or at least, it used to.
Click rate (CTR) = total clicks / emails delivered. It tells you whether the email body and CTA convinced someone to act. This requires a conscious decision from a real person, which is why it's the more trustworthy signal.
Click-to-open rate (CTOR) = unique clicks / unique opens. This measures whether your content delivers on the subject line's promise. If CTOR is high but CTR is low, people who open are engaged - you just aren't getting enough opens, or you've got a email deliverability problem. A healthy CTOR typically falls in the 20-30% range; below that often signals a content mismatch between what the subject line promises and what the email delivers.
One nuance most guides skip: total vs. unique. Total counts every open or click, including repeats from the same person. Unique counts each person once. Unique metrics are almost always what you want for performance analysis.
| Open Rate | Click Rate | CTOR | |
|---|---|---|---|
| Measures | Subject line pull | Body + CTA effectiveness | Content-to-promise match |
| Formula | Opens / delivered | Clicks / delivered | Unique clicks / unique opens |
| Requires human action? | Not reliably | Yes | Yes |
| Reliable in 2026? | Directional only | Yes | Partially (MPP inflates denominator) |
Why Open Rate Became Unreliable
In September 2021, Apple launched Mail Privacy Protection. The mechanics are straightforward: Apple Mail preloads email content - including tracking pixels - through proxy servers before the recipient ever sees the message. The pixel fires. Your ESP records an "open." But nobody actually opened anything.
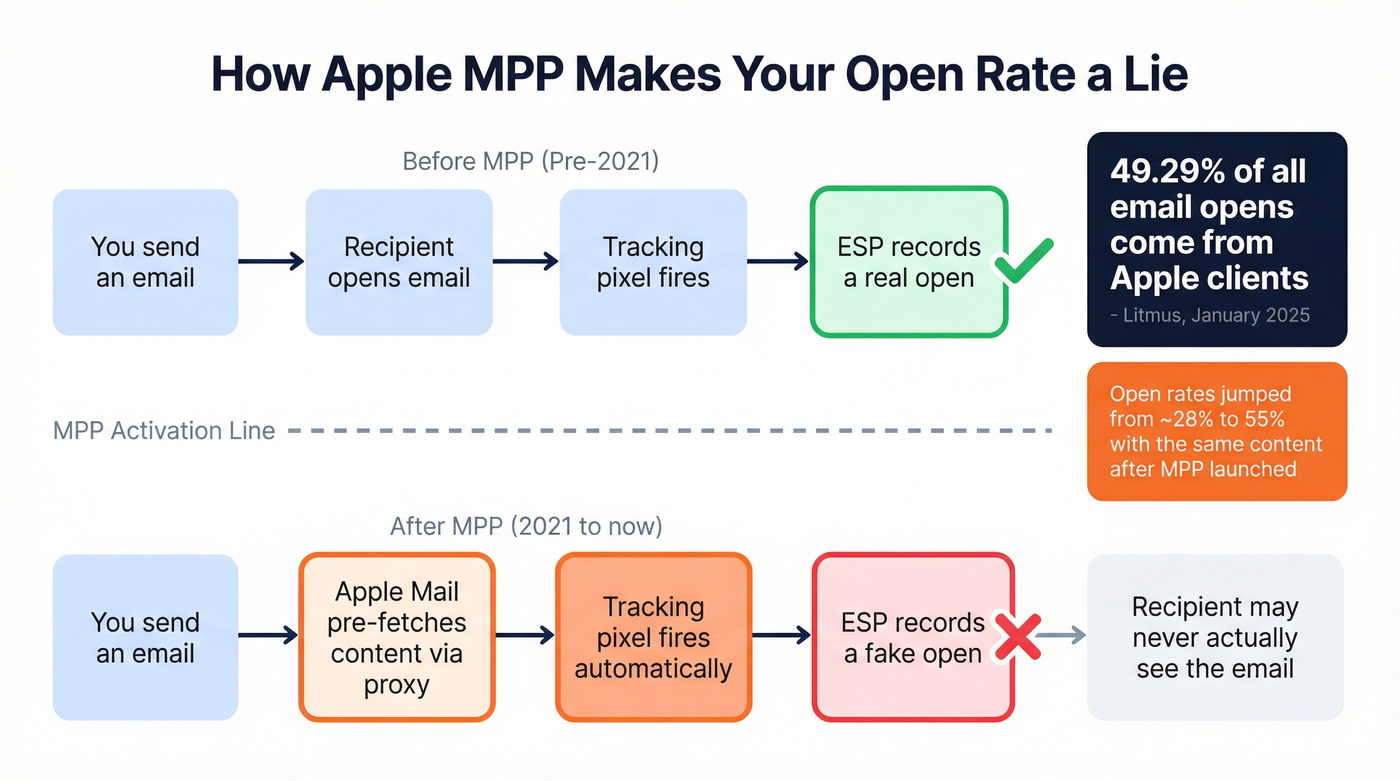
The scale is massive. Litmus reported that Apple clients accounted for 49.29% of all email opens as of January 2025. For some lists, that means nearly half your "opens" are ghosts. One documented example shows open rates jumping from ~28% to 55% after MPP rolled out - same content, same audience, completely artificial inflation. EmailTooltester's own newsletter sees about 27% of opens from MPP, which tracks with what most B2B senders experience.
Here's the thing: your ESP is probably handling this differently than you think. Mailchimp can exclude Apple MPP opens, but only for emails sent after June 22, 2024. ActiveCampaign includes them by default but blocks MPP opens from triggering automations - a smart safeguard. Brevo changed its default on February 6, 2025 to include Apple MPP opens unless you manually exclude them. If you haven't checked your settings recently, your reports are mixing real and machine opens without telling you.
The practical takeaway: open rate is a deliverability pulse check at best. It's not an engagement metric anymore. (If you're still relying on opens for reporting, see our breakdown of email deliverability tracking.)
Your open rate and click rate are only meaningful if emails actually reach real inboxes. A 12% bounce rate doesn't just hurt deliverability - it warps every metric in this article. Prospeo's 5-step verification with catch-all handling and spam-trap removal delivers 98% email accuracy at ~$0.01 per email.
Fix the denominator before you optimize the numerator.
2026 Benchmarks by Industry
Two benchmark datasets are worth your time. They measure different things, so let's look at both.
Mailchimp Industry Benchmarks (billions of emails, 1,000+ subscriber campaigns):
| Industry | Avg Open Rate | Avg Click Rate |
|---|---|---|
| Business & Finance | 31.35% | 2.78% |
| Nonprofits | 40.04% | 3.27% |
| Education & Training | 35.64% | 3.02% |
| E-commerce | 29.81% | 1.74% |
| All users | 35.63% | 2.62% |
Mailchimp's benchmarks include an explicit MPP caveat, which is refreshingly honest. The open rates here are inflated by the same machine opens we just discussed.
Klaviyo 2026 Benchmarks (183,000+ brands, skewed toward e-commerce):
| Metric | Campaign Avg | Campaign Top 10% | Flow Avg | Flow Top 10% |
|---|---|---|---|---|
| Open rate | 31% | 45.1% | - | - |
| Click rate | 1.69% | 3.38% | 5.58% | 10.48% |
The campaign vs. flow split is the insight most articles miss. Automated flows - welcome sequences, abandoned carts, post-purchase - consistently crush campaigns on click rate: 5.58% average vs. 1.69%. If you're holding your welcome sequence to the same click-rate standard as your monthly newsletter, you're comparing apples to oranges.
Top-10% thresholds matter more than averages. If your campaigns hit 3.38%+ click rate, you're in elite territory. Below 1.69%, there's clear room to improve.
Diagnose Your Metrics
Instead of chasing benchmarks, use this diagnostic framework to figure out what's actually broken.
| Scenario | Open Rate | Click Rate | Diagnosis | Next Step |
|---|---|---|---|---|
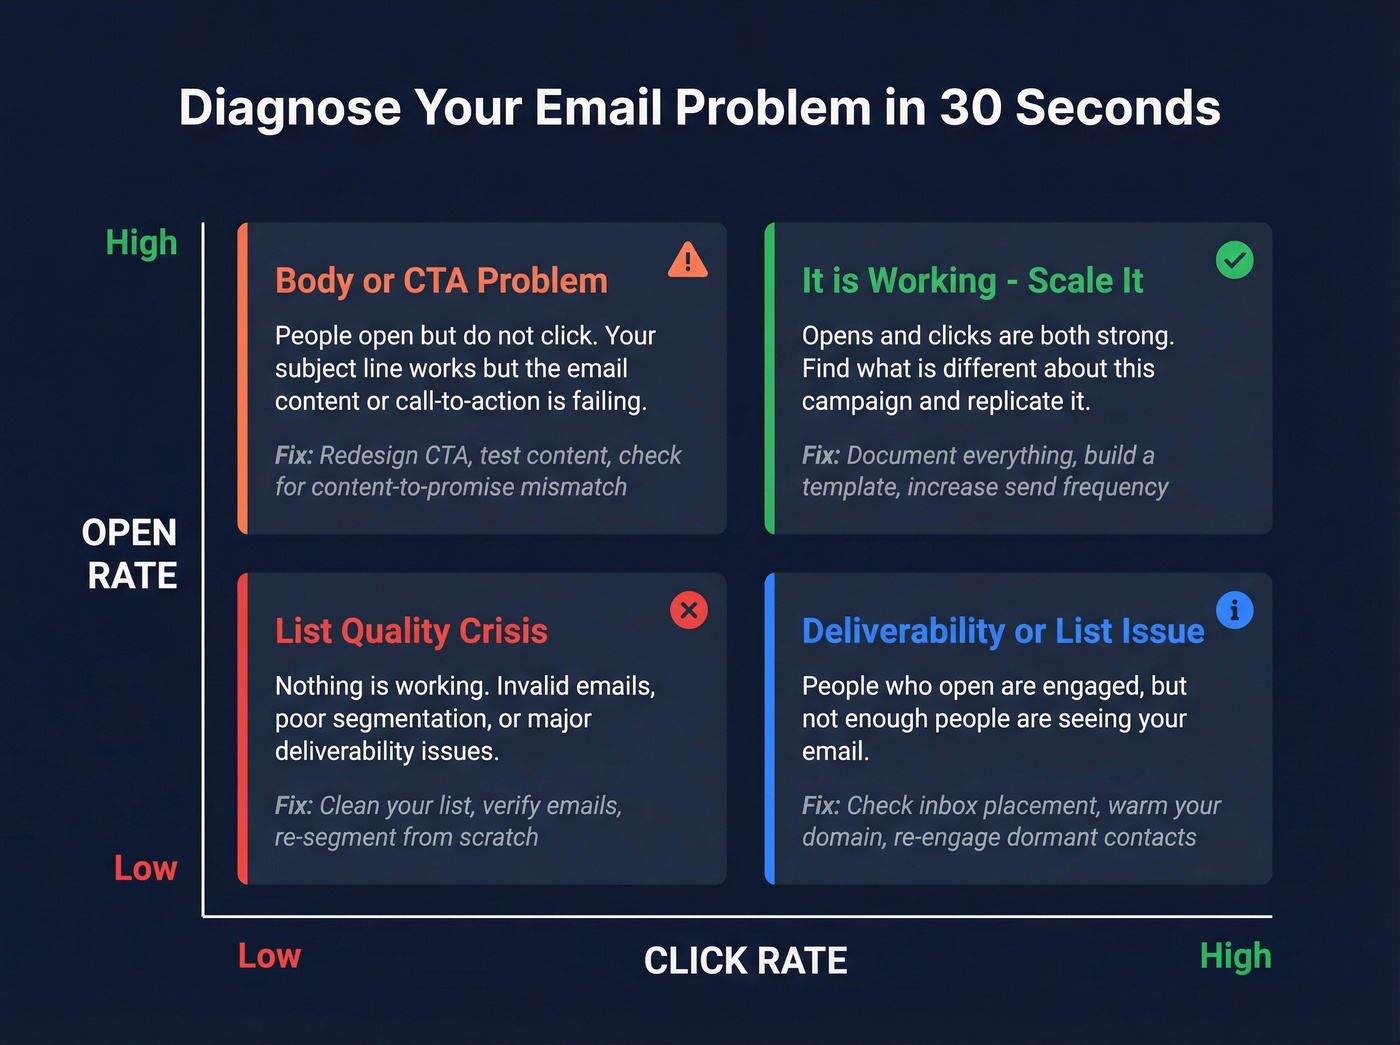
| High open, low click | ↑ | ↓ | Body/CTA problem | Redesign CTA, test content |
| Low open, high CTOR | ↓ | ↑ (relative) | Deliverability or list issue | Check inbox placement, re-engage |
| Low open, low click | ↓ | ↓ | List quality crisis | Clean list, verify emails, re-segment |
| High open, high click | ↑ | ↑ | Working - scale it | Identify what's different, replicate |
Let's make the Klipfolio example concrete. You send 100,000 emails. 50,000 show as opened. 1,000 click. Your CTR is 1%, your CTOR is 2%. The CTOR tells you the content is underperforming for openers. But if a chunk of those 50,000 "opens" are MPP ghosts, your real CTOR is 3-4% - which changes the diagnosis entirely.

The "list quality crisis" scenario deserves special attention because it poisons every other metric. Invalid emails bounce, shrinking your "delivered" count and distorting the rates calculated from it. We've seen teams troubleshoot subject lines and CTA buttons for weeks when the real problem was a 12% bounce rate warping their denominators. Verifying emails before they hit your ESP fixes this upstream - tools like Prospeo run 5-step verification with catch-all handling and spam-trap removal at roughly $0.01 per email, which is cheaper than the domain reputation damage a dirty list causes. (If you want the full breakdown, start with invalid emails and then email verification for outreach.)
How to Improve Click Rate
Open rate optimization is mostly subject line tricks. Click rate optimization is where real revenue lives.
Redesign your CTA. A single, clear call-to-action outperforms multiple competing links. Make the button visually obvious, place it above the fold, and use action-specific copy. "See the demo" beats "Learn more" every time. If you want a structured testing plan, use an email A/B testing workflow.
Segment ruthlessly. Sending the same email to your entire list is the fastest way to tank click rates. Even basic segmentation by industry, role, or engagement recency lifts clicks because the content feels relevant. If you need a framework, start with behavioral segmentation. The consensus on r/emailmarketing is that even crude two-segment splits outperform blasting your whole list - and we've found the same thing in our own campaigns.
Look, here's a take that'll get me in trouble: if your deals typically close under five figures, you probably don't need hyper-personalized email sequences. Basic segmentation plus a strong CTA will outperform a mediocre personalization engine nine times out of ten. Save the dynamic content blocks for enterprise deals where the extra effort pays for itself.
A/B test CTAs, not just subject lines. Most teams obsess over subject line testing because open rate is the easiest metric to move. But testing button copy, placement, and design against click rate gives you data on what actually drives action.
Stop optimizing for opens. Clickbait subject lines inflate open rates and destroy click rates. If your subject line promises something the email doesn't deliver, you'll see high opens, low CTOR, and eventually, unsubscribes. Skip this approach entirely - the short-term open rate bump isn't worth the long-term list damage. (Related: does open tracking hurt cold email.)
The Metrics That Actually Matter
Here's the hierarchy we use when evaluating email performance. Understanding open rate vs click rate is the foundation, but the real value comes from looking beyond both.
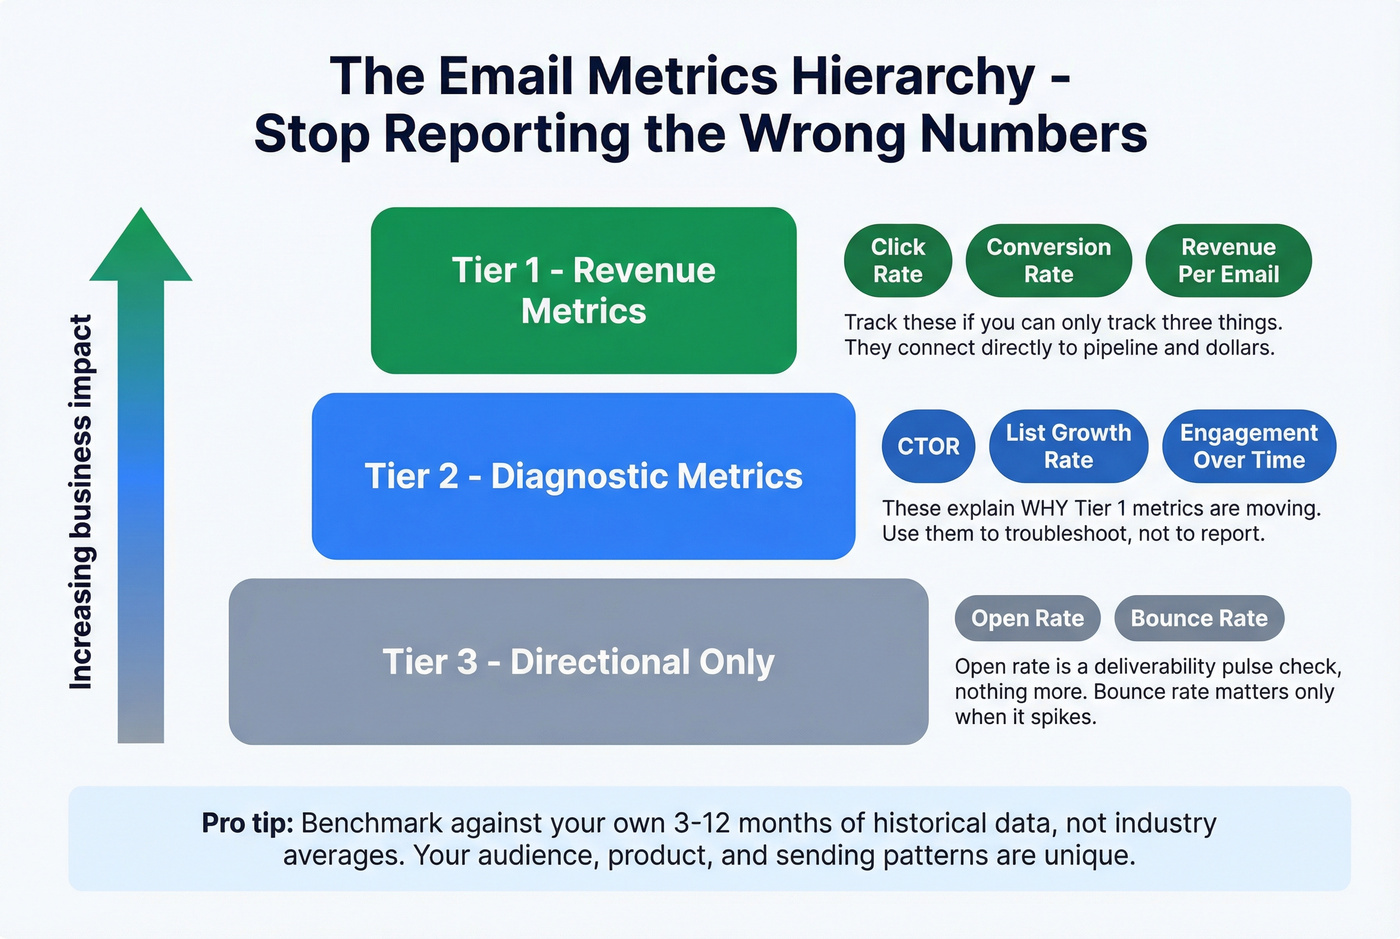
Tier 1 - Revenue metrics: Click rate, conversion rate, revenue per email. These connect directly to pipeline and dollars. If you can only track three things, track these.
Tier 2 - Diagnostic metrics: CTOR, list growth rate, engagement over time. These help you understand why Tier 1 metrics are moving. CTOR diagnoses content quality. List growth rate tells you if your audience is expanding or shrinking. Engagement over time catches decay before it becomes a crisis.
Tier 3 - Directional only: Open rate, bounce rate. Open rate is a deliverability signal, nothing more. Bounce rate matters when it spikes, but shouldn't be a regular reporting metric if your list hygiene is solid. If you're seeing spikes, start with hard bounce triage.
As Braze puts it: "The days of measuring email performance by open rate alone are over." That's not a hot take anymore - it's just reality.
For internal benchmarking, your own historical data beats any industry average because it accounts for your specific audience, product, and sending patterns. Here's the process we recommend:
- Pull 3-12 months of campaign data from your ESP
- Compute averages for click rate, CTOR, and conversion rate
- Identify your outlier campaigns - both high and low performers
- Look for patterns in topic, send time, segment, and CTA placement
- Set incremental goals based on your own top-10% sends, not Mailchimp's
The "list quality crisis" scenario poisons opens, clicks, and CTOR simultaneously. Prospeo verifies 143M+ emails on a 7-day refresh cycle - so your metrics reflect real engagement, not stale data bouncing into the void. Teams using verified data see bounce rates drop from 35%+ to under 4%.
Stop diagnosing subject lines when the real problem is bad data.
FAQ
What's a good open rate in 2026?
Klaviyo's 2026 data shows 31% average and 45.1% for top-10% performers across 183,000+ brands. With Apple MPP inflating a large share of recorded opens, treat open rate as directional only. Your own 3-12 month average is a more honest benchmark than any industry number.
What's click-to-open rate and when should I use it?
CTOR equals unique clicks divided by unique opens - it measures whether your email body delivers on the subject line's promise. A healthy CTOR sits in the 20-30% range. It's useful for content optimization, but MPP inflates the opens denominator, so your real CTOR is likely higher than reported.
How does bad contact data affect email metrics?
Invalid emails bounce, which shrinks your "delivered" count and distorts every rate calculated from it. A list with 10%+ invalid addresses makes click rate look worse than it is and damages sender reputation. Cleaning your list with a verification tool before sending catches invalids, spam traps, and honeypots before they reach your ESP.
Should I still track open rate at all?
Yes, but for different reasons than you used to. Open rate still serves as a deliverability health check - a sudden drop signals inbox placement problems, and a sudden spike might indicate bot activity. The mistake is treating opens and clicks as equally reliable engagement signals. Track both, but weight your decisions and reporting toward click rate and conversions.