How to Improve Your Email Conversion Rate: The Data-Backed Playbook
You're staring at your dashboard. Open rate: 83%. Conversion rate: 0.37%. That's not a hypothetical - it's a real scenario from a marketer running campaigns for an indoor entertainment hub, posted on Reddit, genuinely confused about why nobody's buying.
If you've been trying to figure out how to improve email conversion rate in a meaningful way, the gap between "people saw my email" and "people did the thing" is where most programs go to die.
Email still returns $36 for every $1 spent on average, with top performers hitting $68 per dollar. But that ROI doesn't distribute evenly. It concentrates in the hands of teams who've figured out what actually drives conversions - and it's not what most "email marketing tips" articles tell you.
The Three Moves That Matter Most
If you're short on time, here's the short version:

Build automated flows. They generate 41% of email revenue from just 5.3% of sends - that's 18x higher revenue per recipient than campaigns. Start with abandoned cart and welcome series.
Segment by engagement and behavior, not just demographics. One brand saw 323% more conversions by sending fewer, more targeted emails. Only 24% of marketers prioritize segmentation. Be in that 24%. (If you want a step-by-step, see segmentation.)
Fix your data quality and deliverability before optimizing anything else. A perfectly crafted email sitting in the spam folder converts at 0%. A bounce rate above 2% actively damages your sender reputation for every future send.
Everything else - subject lines, send times, CTAs - is optimization on top of these three foundations.
What Is Email Conversion Rate and How to Calculate It
Email conversion rate measures the percentage of recipients who complete a desired action: a purchase, a signup, a demo request, whatever you're optimizing for.
The formula looks simple:
Conversion Rate = (Number of Conversions / Number of Emails) x 100
But here's where teams get tripped up: the denominator. You've got three options:
- Sent - total emails dispatched (includes bounces, spam folder)
- Delivered - emails that actually reached an inbox
- Clicked - people who clicked through to your landing page
Each gives you a wildly different number. If you sent 10,000 emails, 9,200 were delivered, 460 clicked, and 92 converted, your conversion rate is either 0.92% (sent), 1.0% (delivered), or 20% (clicked). None of these is "wrong," but you need to pick one and stick with it. Most industry benchmarks use delivered as the denominator. If your rate looks suspiciously high or low compared to benchmarks, check your denominator first - your performance might be fine, but your math is off.
For this article, all benchmarks use delivered emails unless noted otherwise.
You just read it: a bounce rate above 2% destroys your sender reputation and kills every conversion downstream. Prospeo's 5-step email verification - with catch-all handling, spam-trap removal, and honeypot filtering - delivers 98% accuracy. That's how teams like Snyk dropped bounce rates from 35% to under 5% and grew pipeline 180%.
Stop optimizing subject lines on emails that land in spam.
Email Conversion Rate Benchmarks in 2026
Benchmarks are guardrails, not goals. Your list, your offer, and your audience are unique. But knowing where the industry sits helps you diagnose whether you've got a real problem or just unrealistic expectations.
Benchmarks by Industry
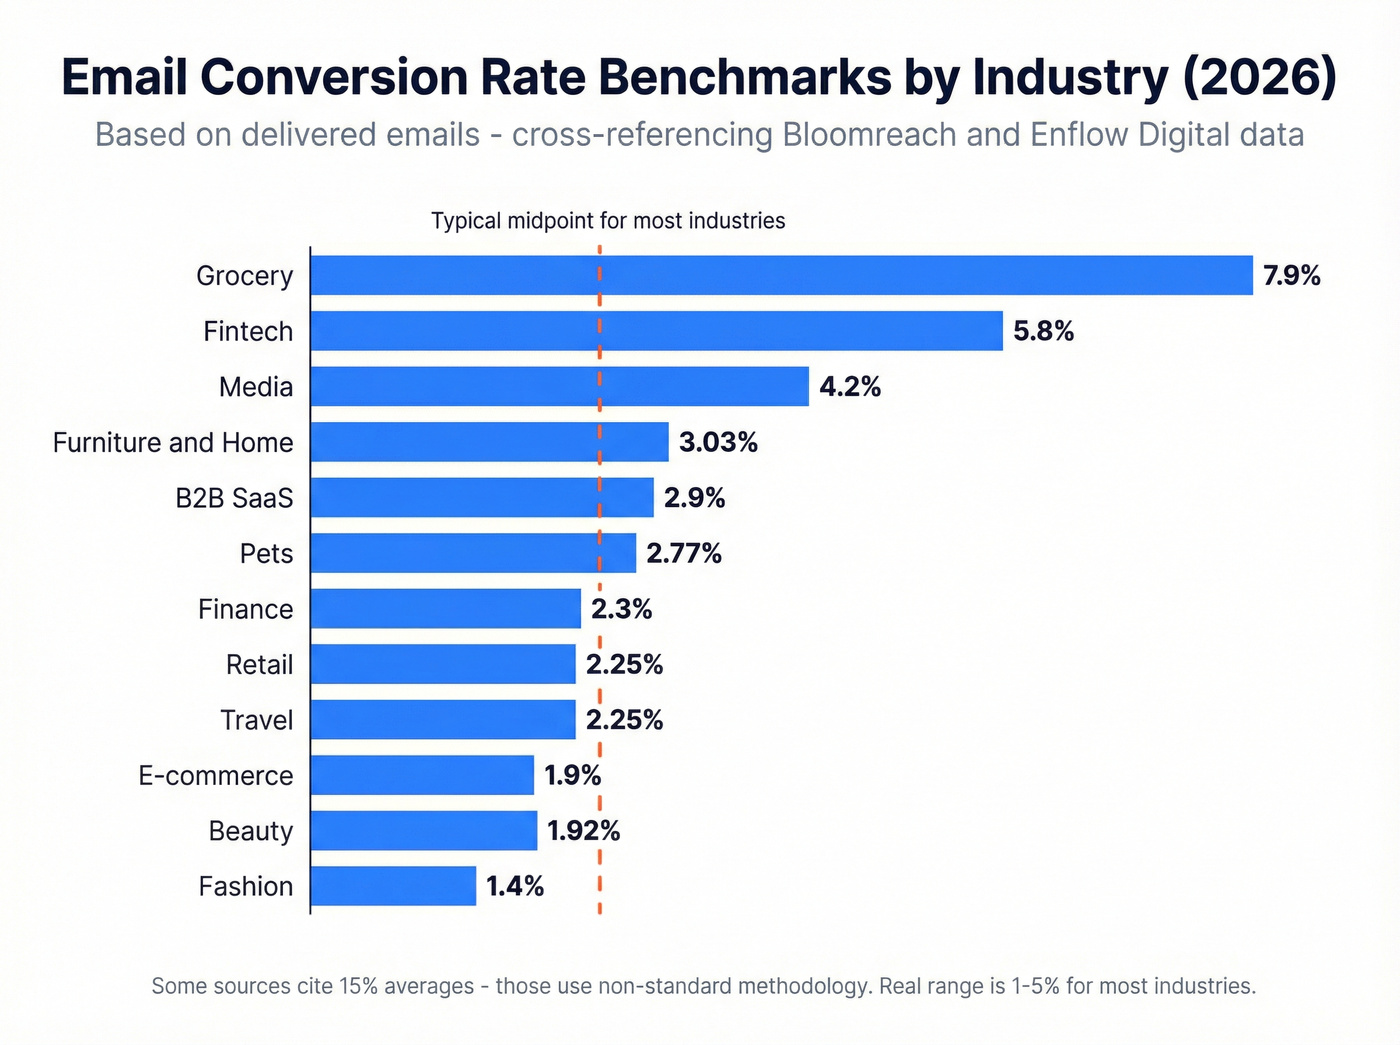
Cross-referencing data from Bloomreach and Enflow Digital gives us a clearer picture than any single source:
| Industry | Conversion Rate | Open Rate | Click Rate |
|---|---|---|---|
| Grocery | 7.9% | ~38% | ~3.5% |
| Fintech | 5.8% | ~35% | ~3.0% |
| Media | 3.0-4.2% | ~37% | ~2.8% |
| Furniture/Home | 3.03% | ~36% | ~2.5% |
| B2B SaaS | 2.9% | ~34% | ~2.8% |
| Pets | 2.77% | ~38% | ~3.2% |
| Finance | 2.3% | ~31% | ~2.8% |
| Retail | 2.25% | ~30% | ~1.7% |
| Travel | 2.1-2.25% | ~36% | ~2.4% |
| E-commerce | 1.9% | ~30% | ~1.7% |
| Beauty | 1.92% | ~36% | ~2.1% |
| Fashion | 1.4% | ~38% | ~1.5% |
You'll see some sources cite a 15.22% "average" conversion rate. Ignore that - it's skewed by non-standard methodology. The real range for most industries is 1-5%, with grocery and fintech as outliers.
Year-over-year, conversion rates are trending up (+0.5%), click rates are rising (+0.4%), while open rates have dipped 1.4% - likely due to Apple's Mail Privacy Protection inflating earlier figures. The takeaway: focus on clicks and conversions, not opens.
Benchmarks by Email Type
Not all emails are created equal. Triggered, behavior-based emails crush batch campaigns:
| Email Type | Avg CTR | Est. Conversion Rate | Revenue Impact |
|---|---|---|---|
| Abandoned Cart | 6.3% | 3-5% | Highest |
| Welcome Series | 4.9% | 2-5% | High |
| Post-Purchase | 3.5% | 1-3% | Medium |
| Educational Flow | 3.7% | 1.5-3% | Medium |
| Promotional Blast | 2.4% | 1-2% | Low per send |
| Re-engagement | ~2.0% | 0.5-1% | Low |

Abandoned cart emails have the highest CTR and conversion rate because the intent is already there. The recipient was this close to buying. Welcome emails work because attention is at its peak - someone just opted in. Promotional blasts? They're volume plays. Low conversion per send, but they move revenue at scale.
Campaigns vs. Automated Flows
This is the single most important distinction in email marketing. Data across 183,000+ customers makes the case:

| Metric | Campaigns | Flows | Difference |
|---|---|---|---|
| Share of sends | 94.7% | 5.3% | - |
| Share of revenue | ~59% | ~41% | - |
| Click rate | 1.69% | 5.58% | 3.3x higher |
| Placed order rate | ~1x | ~13x | 13x higher |
| RPR (revenue/recipient) | 1x | 18x | 18x higher |
Read that again: 5.3% of sends generating 41% of revenue.
Nearly 48% of flow-driven revenue comes from new buyers, compared to just 16% from campaigns. Flows don't just convert better - they convert new customers better.
Revenue per 1,000 sends varies by industry, but the pattern holds everywhere:
| Industry | Revenue per 1K Sends |
|---|---|
| B2B SaaS | $121 |
| Travel | $93 |
| Finance | $88 |
| Media | $64 |
| E-commerce | $57 |
If you're not running automated flows yet, that's your single biggest lever. Everything else is optimization.
The Conversion Rate Hierarchy - What to Fix First
Here's the thing: most email marketing advice jumps straight to "personalize your subject lines" or "add emojis." That's like choosing paint colors before pouring the foundation.

There's a hierarchy, and it matters:
Deliverability - Can your emails reach the inbox? If your bounce rate is above 2%, your sender reputation is degrading with every send. Fix this first or nothing else matters. (Deep dive: email deliverability.)
List quality - Are you emailing real people who want to hear from you? Bad addresses, spam traps, and disengaged contacts poison everything downstream. (Related: data quality.)
Segmentation and relevance - Are you sending the right message to the right person? A discount email to someone who just paid full price yesterday is actively harmful.
Offer - Is what you're offering compelling enough to act on? No amount of design polish saves a weak offer.
Personalization - First name tokens, dynamic content, behavioral triggers. Important, but it's the cherry on top, not the sundae.
I've seen teams spend months A/B testing subject line emojis while 15% of their list was bouncing. A perfectly personalized email in the spam folder converts at 0%. Work the hierarchy from the bottom up.
My hot take: Most teams are over-investing in personalization and under-investing in deliverability by a ratio of about 10:1. If your bounce rate is above 2%, stop everything else and fix that first.
Tactics That Actually Boost Email Conversions
Build Automated Flows (The Single Biggest Lever)
We covered the data: flows generate 18x higher revenue per recipient than campaigns. But where do you start?
Abandoned cart flows are the highest-converting email type, period. They catch buyers mid-decision. The key is triggering at add-to-cart, not just at checkout - most platforms default to checkout abandonment, which misses a huge chunk of intent.
Welcome flows capture attention at its peak. Open rates for welcome emails historically average around 68%, compared to ~20% for regular campaigns. That's 3x more eyeballs on your message when someone is most receptive.
Once those are running, layer in post-purchase flows and browse abandonment. Top-performing flows hit RPR up to $7.79 and click rates over 10%. AI-powered product recommendations in flows lift click rates to 3.75% on average, with top performers hitting 8.79%. If your ESP supports dynamic product blocks, turn them on.
Segment by Behavior, Not Just Demographics
Only 24% of email marketers prioritize segmentation. Which means 76% are blasting the same message to everyone and wondering why conversions are flat.

Two case studies show what's possible:
The water tech brand. A US water technology company on Shopify Plus implemented RFM segmentation (recency, frequency, monetary value). They excluded unengaged recipients and stopped sending discount emails to recent full-price buyers. The result: 323% increase in attributed conversions and 108% increase in owned revenue over 11 months. The kicker? They sent fewer emails. Less volume, more relevance, dramatically better results.
Joseph's Wigs. This retailer asked subscribers to self-select their content interests via an initial preference email. They then customized banners, blog content, vocabulary, and subject lines per segment. Their fashion segment hit a 53% open rate. Their alopecia segment hit 63%. Compare that to their general newsletter at 29%. Revenue increased 170% year-over-year from segmented emails alone.
The pattern is clear: sending fewer, more targeted emails beats blasting your entire list every time.
Fix Your From Name and Subject Lines
Before you optimize your subject line, check your From name. 68% of subscribers decide whether to open based on the sender name alone - a higher-impact factor than the 47% who decide based on the subject line. Use a recognizable person's name plus company ("Sarah from Acme") rather than a generic "noreply@" address.
That's a five-minute change that moves the needle more than hours of subject line wordsmithing. (If you're stuck, steal from these reminder email subject lines.)
For subject lines, the sweet spot is 20-40 characters, roughly 7 words. iPhones display 33-35 characters before truncation. Android shows 33-41. With 81% of emails opened on mobile, shorter wins. Target ~45 characters max for cross-device safety.
Personalized subject lines lift open rates by 26%. But "personalized" doesn't just mean {first_name} - it means relevant to the recipient's behavior or context. Subject line A/B testing improves conversion rates by 29%, yet most teams never test them systematically. They write one subject line, send it, and move on. (Framework: A/B testing.)
One finding that surprised us: reverse psychology subject lines ("Don't open this email") outperformed standard approaches by 20%. Novelty works - until everyone does it.
Optimize Your Send Timing
Tuesday and Thursday consistently show the highest engagement across industries. But the counterintuitive finding is about time of day: open rates actually peak at 8 PM (59%), not mid-morning. Monday at 9 PM hits a 9.01% CTR - the highest click-through rate of any day/time combination in the data.
| Industry | Best Days | Best Times |
|---|---|---|
| E-commerce | Tue/Thu | 10 AM |
| SaaS | Tue/Thu | 2-3 PM |
| B2B | Mon/Tue | 8-10 AM |
| Nonprofits | Tue/Thu | 3-4 PM |
Saturday and Sunday consistently underperform. Friday is surprisingly decent - people are in a relaxed, browsing-friendly headspace.
Real talk: static send times are a blunt instrument. AI-powered send-time optimization increases open rates by 23% over fixed scheduling. If your ESP offers it, use it. If it doesn't, at least test morning vs. evening for your specific audience before defaulting to "Tuesday at 10 AM" because a blog told you to. (More: send-time optimization.)
Align Your Email-to-Landing Page Experience
Here's where a lot of conversion rate "problems" actually live: the post-click experience.
Your email did its job - someone clicked. Then they land on a page that doesn't match what the email promised, and they bounce. New Path Digital achieved a 78% increase in conversion rates by aligning email campaigns with landing pages using a message match framework. The concept is simple: the headline on your landing page should mirror the promise in your email. If your email says "Get 30% off winter boots," your landing page better show winter boots at 30% off - not your homepage.
Email traffic converts 5-6x better than paid traffic for e-commerce landing pages. That's because email recipients already know you and opted in. But that advantage evaporates if the landing page creates friction.
Going, the travel deals company, ran a simple CTA text A/B test: "Sign up for free" vs. "Trial for free." The result was a 104% month-over-month increase in premium trial starts. One word changed. Conversions doubled.
A/B Test Everything (Most Teams Don't)
Companies that A/B test their emails see 83% higher ROI - $42 per $1 spent versus $23 for non-testers. Yet only 59% of companies bother testing at all.
That's a staggering competitive advantage sitting on the table for anyone willing to pick it up.
HubSpot documented a case where a 0.53% open rate increase from a subject line A/B test generated 131 additional leads. Small percentage gains compound across large lists. But testing has pitfalls. 35% of email tests fail due to preventable mistakes - insufficient sample size, testing too many variables at once, or ending tests too early. Teams with a structured testing approach see 47% higher success rates.
What to test, in priority order:
- Subject lines - biggest impact on opens
- CTA text and placement - biggest impact on clicks
- Send time - easy to test, meaningful lift
- Email length and format - long vs. short, image-heavy vs. text
- Offer framing - % off vs. $ off vs. free gift
Test one variable at a time. Run each test for at least one full send cycle. Document results. This isn't glamorous work, but it's the work that compounds.
Clean Your List and Verify Your Data
Bad data creates a death spiral that most teams don't see until it's too late.
Invalid email addresses cause bounces. Bounces above 2% trigger ISP scrutiny. Your sender reputation drops. More of your emails land in spam - even the ones sent to valid addresses. Your open rates crater. Your conversions follow. Almost 20% of cold emails get flagged as spam despite legitimate intent. Much of that is preventable with proper list hygiene. (SOP: email verification list.)
Tools like Prospeo verify emails in real time with 98% accuracy, including catch-all domain handling and spam-trap removal. A 5% bounce rate doesn't just waste sends - it actively damages your sender reputation for every future campaign. The 5-step verification process catches invalid addresses, honeypots, and spam traps before they tank your deliverability. (More options: email verifier websites.)
This isn't optional maintenance. It's the foundation of the entire conversion hierarchy.
Write CTAs That Actually Get Clicked
Web users read about 20% of a page's text on average. Visitors typically interact with only 60% of a page. If your only CTA sits at the bottom of a long email, most recipients never see it.
The fix: introduce your CTA early, reinforce it in the middle, and repeat it at the end. (More patterns: sales CTA.)
First-person CTA language outperforms generic phrasing. "Get My Free Audit" beats "Submit" every time. The psychological shift from passive ("Submit") to active ownership ("Get My") is small but measurable. Human faces looking toward the CTA increase click-through rates too - if you're using images of people in your emails, point their gaze at the button. It sounds gimmicky, but eye-tracking studies back it up.
Make It Work on Mobile (Or Lose 81% of Your Audience)
81% of emails are opened on mobile, and that number keeps climbing. Mobile emails have a 65% higher likelihood of driving a conversion - but only if the experience doesn't break.
Three non-negotiable mobile design rules:
- Single-column layout. Multi-column designs collapse unpredictably on small screens. One column, full width, every time.
- Minimum 44px tap targets. If your CTA button is smaller than a fingertip, people will miss it or hit the wrong link. Apple's Human Interface Guidelines set 44px as the minimum for a reason.
- Front-load the value. Mobile screens show roughly 300 pixels before the fold. Your headline, key visual, and primary CTA need to live in that space.
If your email looks broken on a phone, you've already lost the majority of your audience.
Send Fewer, Better Emails
A SaaS company cut their email frequency from 3x/week to 1x/week. Unsubscribe rates dropped. Click-through rates increased. Conversions went up. They didn't add anything - they subtracted.
One in five people receive 16+ promotional emails per day. Your email isn't competing with your competitors' emails. It's competing with every email.
The water tech brand case study reinforces this: they sent fewer emails after implementing segmentation and saw 323% more conversions. The math is counterintuitive but consistent - fewer sends to more engaged segments outperforms high-volume blasting almost every time.
Look, I'm not saying "only send one email a month." I'm saying that every email you send to someone who doesn't want it makes your next email to someone who does want it slightly less likely to reach the inbox. Volume has a cost, and most teams undercount it.
Cold Email Conversion Rates - Different Rules Apply
Cold email operates under completely different physics than marketing email. You're reaching people who didn't opt in, so the benchmarks, tactics, and priorities all shift.
Instantly's 2026 benchmark report, based on billions of emails across thousands of workspaces, puts the average reply rate at 3.43%. Top 25% of senders hit 5.5%+. Top 10% reach 10.7%+. For conversion to meetings or opportunities, a rate above 2% is solid; above 5% is exceptional.
A few data points that should reshape how you think about cold outreach:
58% of all replies come from the first email. Your initial message does most of the heavy lifting. Spend 80% of your optimization time on email #1. (Related: email sequence first email.)
Under 80 words outperforms longer copy. Cold email isn't the place for storytelling. State the problem, offer the solution, ask for the meeting. Done.
Follow-ups framed as replies beat formal reminders by ~30%. "Bumping this to the top of your inbox" works better when it looks like a natural reply thread, not a templated sequence step.
The hierarchy applies even more aggressively in cold email: deliverability first, list quality second, relevance third, offer fourth, personalization last. At scale (100K+ sends per month), a 1.6% reply rate means 1,600 conversations - enough to fill most sales pipelines. (If you're running outbound, use this: cold email conversions.)
81% of sales and marketing decision-makers engage with cold outreach when it's tailored to their company. That's not "Hi {first_name}" personalization - it's demonstrating you understand their business context.
Verify every address before you send. At roughly $0.01 per verification, it's the cheapest insurance in your outbound stack - and it protects the domain reputation that every future campaign depends on.
Common Mistakes That Kill Your Conversion Rate
These are the patterns we see repeatedly - and the ones practitioners on Reddit call out most often:
Dismissing email based on personal bias. "I never read marketing emails, so they don't work." Your inbox behavior isn't your customer's inbox behavior. 68% of consumers prefer email as their primary brand communication channel.
Burying lead capture in the footer. If your signup form is at the bottom of your website, you're collecting a fraction of the leads you could be. Move it above the fold. Add exit-intent triggers.
Weak offers - and not testing them. Test $20 off vs. 20% off when your AOV is $100. Same value, different psychological impact. Gift-with-purchase often outperforms both discounts. You won't know until you test.
Non-mobile-optimized emails. Skip this section if you've already audited your mobile experience, but if you haven't: 81% of opens happen on phones. Broken mobile rendering is a conversion killer hiding in plain sight.
Pop-ups that trigger instantly. On desktop, use exit intent. On mobile, trigger after 8 seconds or 60% scroll. Instant pop-ups train visitors to close without reading.
CTA at the bottom only. Most readers never scroll that far. Place CTAs early, middle, and end.
Sending to unengaged segments. Every email to someone who hasn't opened in 90 days hurts your sender reputation. Suppress or re-engage them - don't keep blasting.
Ignoring deliverability until it's a crisis. By the time you notice your open rates cratering, your sender reputation is already damaged. Monitor bounce rates weekly, not quarterly.
Segmentation drives 323% more conversions, but only if you're segmenting real contacts with real data. Prospeo refreshes 300M+ profiles every 7 days and returns 50+ data points per contact - job title, intent signals, technographics - so your segments actually mean something.
Better segments start with better data. Try 100 credits free.
FAQ
What is a good email conversion rate?
Most industries fall between 1-5%, with grocery (7.9%) and fintech (5.8%) as outliers on the high end. Abandoned cart emails convert at 3-5%, while promotional blasts typically land at 1-2%. Compare your rate to your own industry and email type rather than chasing a generic "average."
Why are my open rates high but conversions low?
High opens with low conversions point to a post-click problem - a landing page that doesn't match the email promise, a weak offer, the wrong audience, or a CTA buried where most readers never scroll. Audit your email-to-landing-page experience using a message match framework before tweaking the email itself.
Do automated email flows really convert better than campaigns?
Yes - dramatically. Data across 183,000+ customers shows flows deliver 18x higher revenue per recipient, 3.3x higher click rates (5.58% vs. 1.69%), and 13x higher placed order rates than campaigns. Flows generate 41% of total email revenue from just 5.3% of sends. Start with abandoned cart and welcome series for the fastest lift.
How does email list quality affect conversion rates?
Bad data causes bounces, which damage sender reputation, which lands future emails in spam - even emails sent to valid addresses. Keeping bounce rates under 2% is critical. A 5-step verification process that catches invalid addresses, spam traps, and honeypots protects your conversion rate at the source.
How often should I send marketing emails?
One targeted, well-segmented email per week often outperforms three generic blasts. Track your unsubscribe rate alongside conversions as you adjust - if unsubscribes spike above 0.5% per send, you're over-mailing. The water tech brand sent fewer emails after implementing RFM segmentation and saw 323% more conversions.