Revenue Churn Rate: Formulas, Benchmarks, and Reduction Playbook
Your board deck says 4% net revenue churn. Your CS team says 12% gross churn. Your finance team says 8% ARR attrition. They're all right - and that's the problem.
Revenue churn rate is one of the most important metrics in SaaS, and it's also one of the most inconsistently calculated. Three teams, three definitions, three numbers that tell completely different stories about the health of your business. We've seen this exact scenario play out at companies from $500K ARR to $50M, and the confusion costs real money - misallocated CS resources, wrong expansion targets, misleading investor updates.
What Is Revenue Churn Rate?
Revenue churn rate is the percentage of recurring revenue you lose from your existing customer base during a specific period, typically measured monthly as an MRR churn rate. It's distinct from customer (logo) churn, which simply counts how many accounts you lost regardless of their value.
The divergence between the two is where things get interesting. Lose ten $50/mo accounts and your logo churn looks terrible, but you've only lost $500 in MRR. Lose one $25,000/mo enterprise contract and your logo churn barely moves - but your revenue just cratered. This is why revenue churn is the metric investors, boards, and operators actually care about. Logos tell you how many. Dollars tell you how much.
How to Calculate Revenue Churn
Gross MRR Churn
Gross revenue churn captures total recurring revenue lost from downgrades and cancellations, with no offset from expansion:
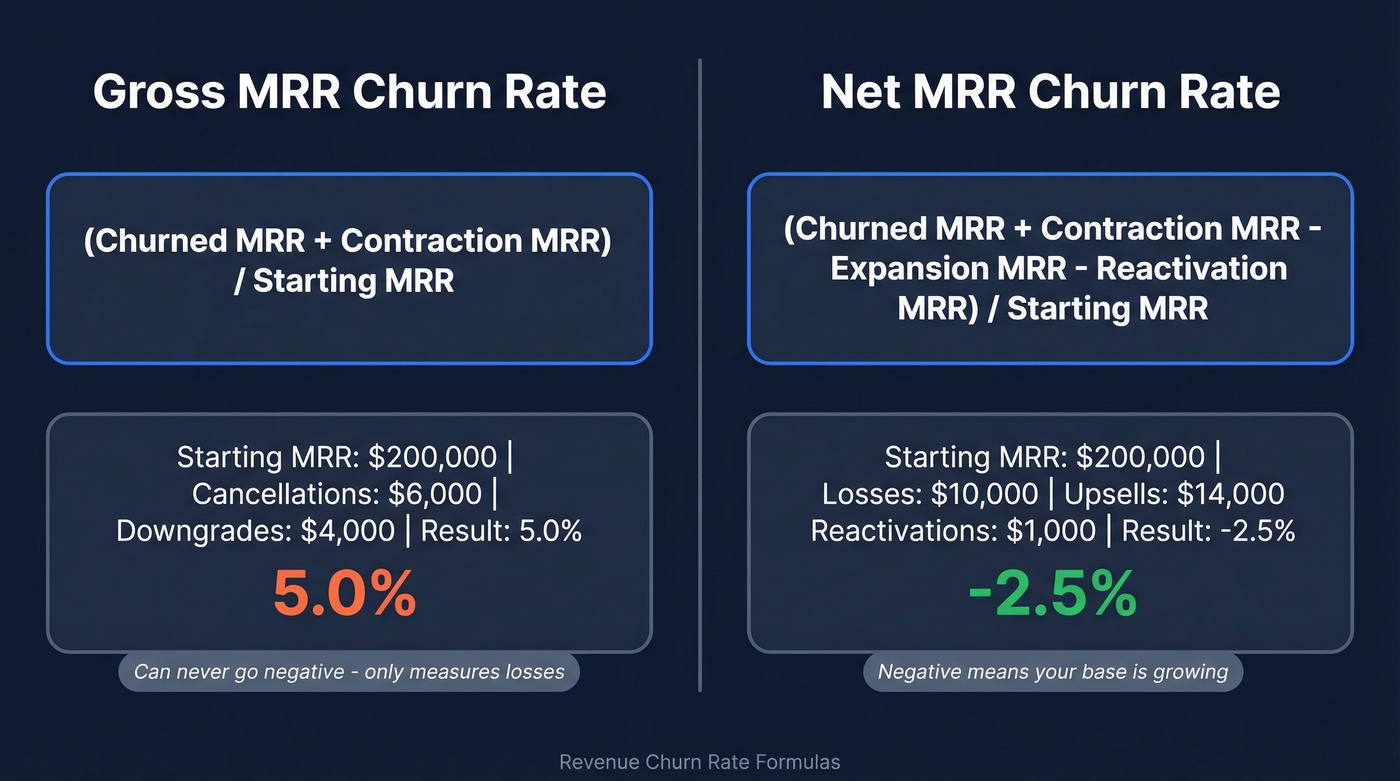
Gross MRR Churn Rate = (Churned MRR + Contraction MRR) / Starting MRR
Worked example: you start the month with $200,000 MRR. You lose $6,000 to cancellations and $4,000 to downgrades. Gross MRR churn = ($6,000 + $4,000) / $200,000 = 5.0%. This number can never go negative - it only measures what's leaving.
Net Revenue Churn
Net revenue churn offsets losses with expansion and reactivation revenue, giving you the true trajectory of your existing customer base. The complete formula:
Net MRR Churn Rate = [(Churned MRR + Contraction MRR) - (Expansion MRR + Reactivation MRR)] / Starting MRR
Same example: $200,000 starting MRR, $10,000 in losses, but $14,000 in upsells and $1,000 in reactivations. Net MRR churn = ($10,000 - $15,000) / $200,000 = -2.5%. That negative number means your existing base is growing - more on that later.
One practical note: if you're running a mix of monthly and annual contracts, use only the contracts up for renewal in your denominator. Measuring churn against revenue that couldn't possibly churn this period inflates your retention artificially.
Annualizing Monthly Churn
We've watched teams build entire financial models on the wrong formula here. You can't just multiply monthly churn by 12. The correct approach compounds the rate:
Annual Churn = 1 - (1 - Monthly Churn)^12
A 2% monthly rate doesn't equal 24% annual - it compounds to ~21.5%. At 5% monthly, the gap widens further: simple multiplication gives you 60%, but the compound formula yields ~46%. Get this wrong and your board presentation is fiction.
What Counts as Churned Revenue?
Not every dollar that leaves your books is churn. Getting this taxonomy right is the difference between a metric you can act on and one that misleads you. Here's the breakdown:
| Include | Exclude |
|---|---|
| Non-renewals | Setup/implementation fees |
| Tier downgrades | Professional services revenue |
| Discount reductions | Same-month upsells |
| Add-on cancellations | Trial/freemium users |
| Usage decreases | Internal test accounts |
Revenue movements fall into four categories: churned (non-renewals), contracting (downgrades and discounts), renewed (straight renewals), and expanding (upsells, price increases, win-backs).
For reactivations, set a clear window - typically 30-90 days. Customers who return after that window should count as new acquisition, not retention. Otherwise you're flattering your NRR with what's really a re-sale. For usage-based pricing, use a trailing twelve-month average to smooth out seasonal dips. A quiet month shouldn't look like churn if the customer is still engaged.
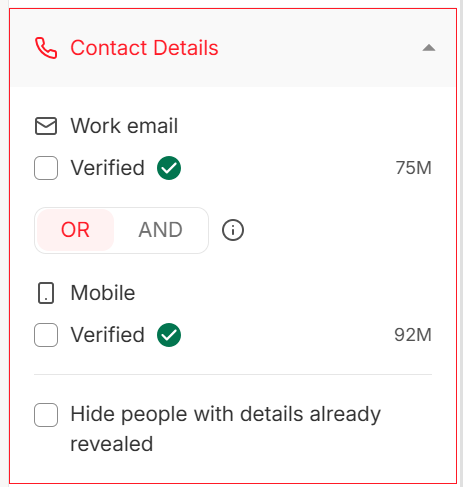
Revenue churn starts when you reach the wrong people. Prospeo's 300M+ verified profiles with 98% email accuracy mean your pipeline is built on contacts who actually exist - so your expansion revenue grows and your churn stays low.
Stop losing MRR to bad data. Start with 75 free verified emails.
SaaS Benchmarks by ARR Band
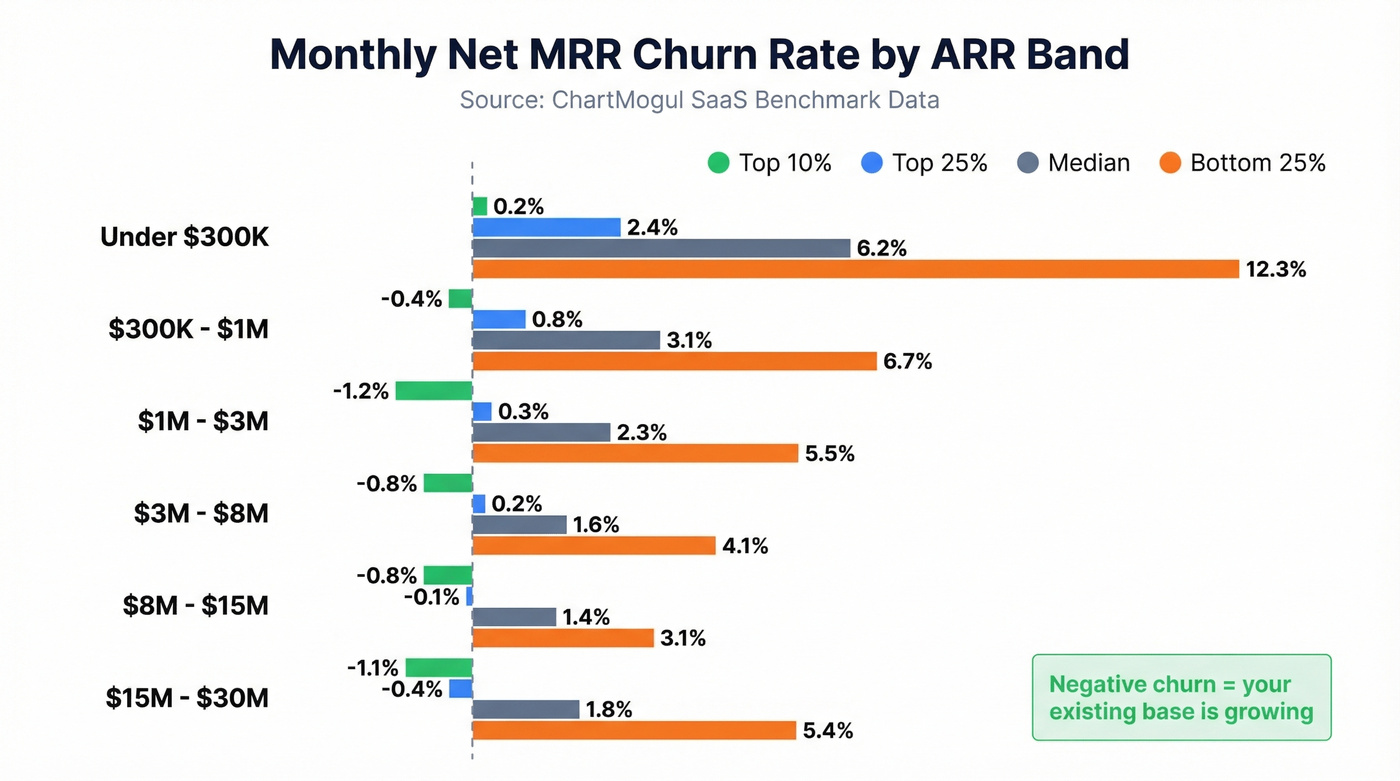
ChartMogul's benchmark data breaks down monthly net MRR churn by ARR range across percentiles:
| ARR Range | Top 10% | Top 25% | Median | Bottom 25% |
|---|---|---|---|---|
| <$300K | 0.2% | 2.4% | 6.2% | 12.3% |
| $300K-$1M | -0.4% | 0.8% | 3.1% | 6.7% |
| $1-3M | -1.2% | 0.3% | 2.3% | 5.5% |
| $3-8M | -0.8% | 0.2% | 1.6% | 4.1% |
| $8-15M | -0.8% | -0.1% | 1.4% | 3.1% |
| $15-30M | -1.1% | -0.4% | 1.8% | 5.4% |
Monthly gross MRR churn by ARR range:
| ARR Range | Top 10% | Top 25% | Median | Bottom 25% |
|---|---|---|---|---|
| <$300K | 2.5% | 4.8% | 9.1% | 16.5% |
| $300K-$1M | 2.0% | 3.6% | 5.7% | 10.5% |
| $1-3M | 1.6% | 3.0% | 5.3% | 9.0% |
| $3-8M | 2.0% | 3.3% | 5.3% | 9.5% |
| $8-15M | 1.6% | 2.8% | 4.0% | 8.0% |
| $15-30M | 1.5% | 2.2% | 5.8% | 11.1% |
The pattern is clear: median early-stage companies run 6.2% net / 9.1% gross monthly, while companies above $1M ARR drop to 2.3% net / 5.3% gross. In our experience, the ARR band matters more than industry vertical. Scale improves retention because bigger companies tend to sell stickier products to stickier customers.
Benchmarks by ACV Segment
Contract size is one of the biggest drivers of MRR attrition:
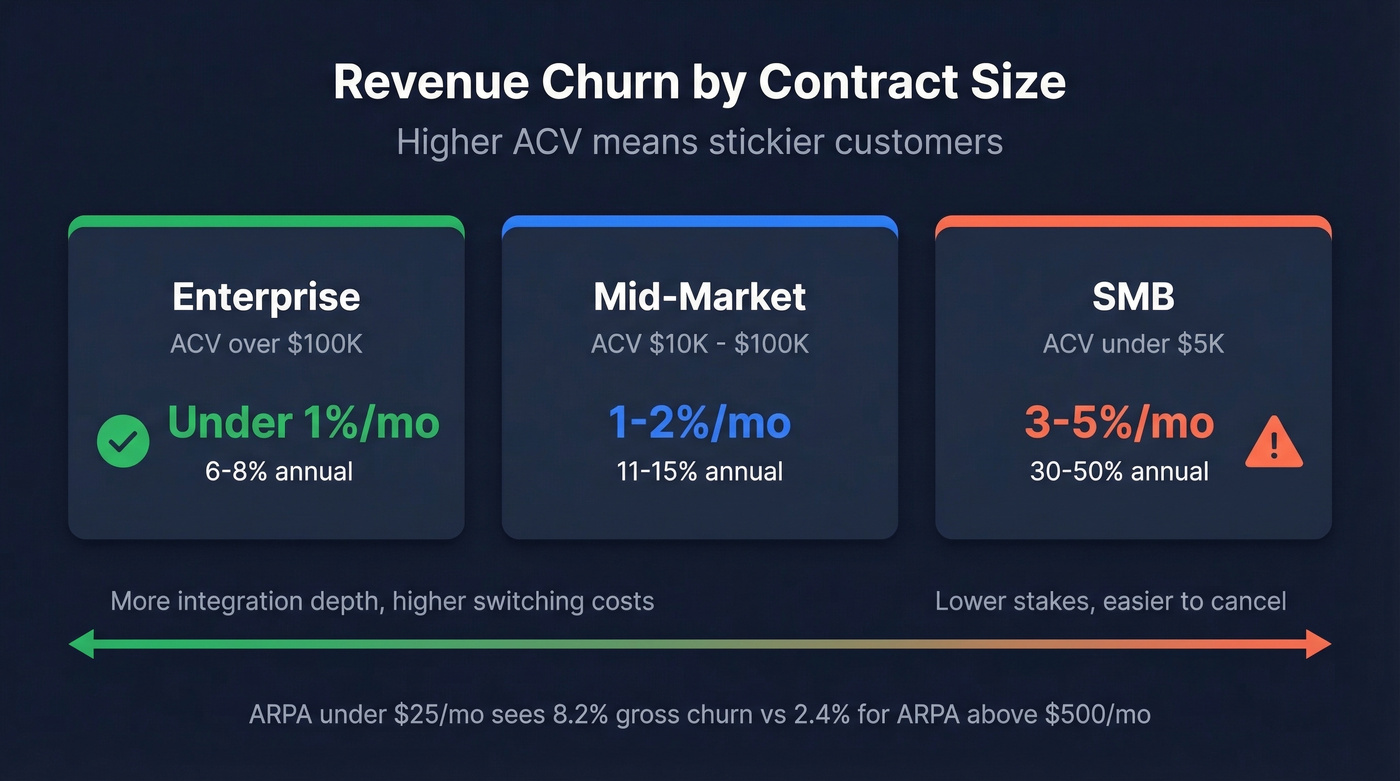
- Enterprise (ACV >$100K): <1% monthly, 6-8% annual
- Mid-market ($10K-$100K): 1-2% monthly, ~11-15% annual
- SMB (ACV <$5K): 3-5% monthly, 30-50% annual
Companies with ARPA under $25/mo see a median 8.2% gross churn. Push ARPA above $500/mo and that drops to ~2.4% gross. Higher-value customers have more at stake, more integration depth, and more switching costs.
Why Benchmarks Mislead
Let's be honest: cross-company churn comparisons are fundamentally broken because nobody defines churn the same way. ServiceNow's SEC 10-K filing uses an ACV-based attrition rate and applies management judgment on what counts as a "lost customer" - including treating large decreases as full losses. That's a completely different methodology than a startup tracking MRR cancellations.
A Reddit founder put it bluntly: 15% monthly churn, profitable, growing 25% MoM, with $50 CAC and $400 LTV. The blanket "churn must be under 5%" advice doesn't apply when unit economics work.
If your ACV is below $5K and your LTV/CAC ratio exceeds 4x, a "high" churn number is a pricing model problem, not a product problem. Optimize for revenue per cohort, not for a benchmark number that was set by enterprise SaaS companies selling to Fortune 500 accounts.
Common Calculation Mistakes
We've seen these errors inflate churn numbers - or hide real problems - across dozens of SaaS companies. One Reddit thread on churn calculators captured the frustration well: founders kept getting wildly different numbers from different tools because the inputs weren't standardized.
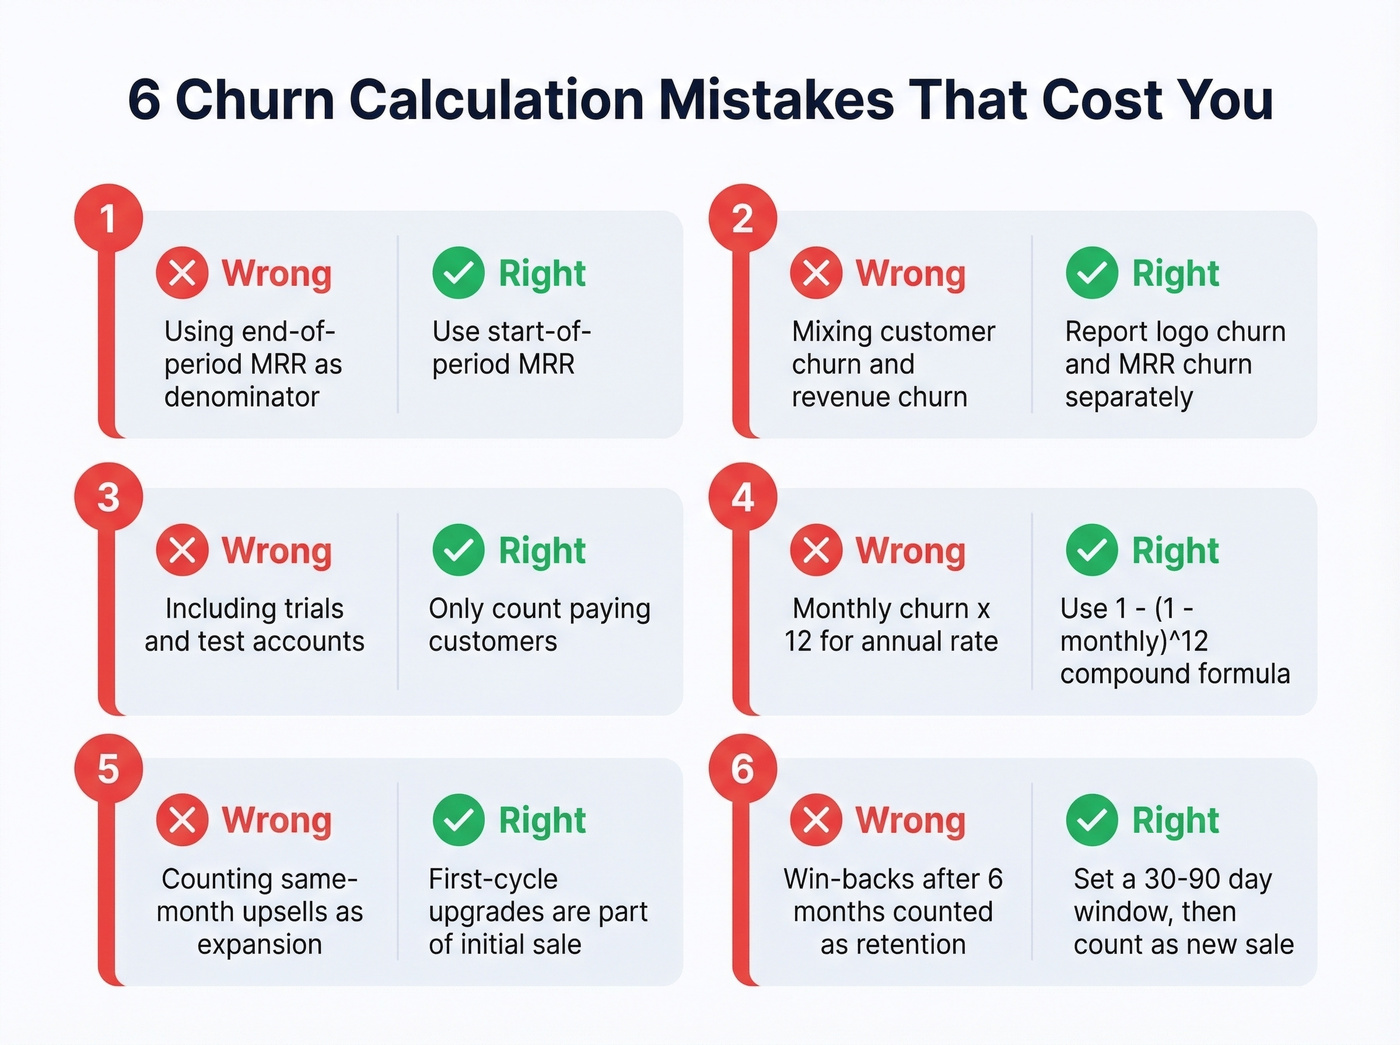
- Using end-of-period MRR as the denominator instead of start-of-period. This understates your churn rate because the denominator includes new revenue that wasn't at risk.
- Mixing customer churn and revenue churn into one number. They tell different stories. Report them separately.
- Including trial users and internal test accounts. These aren't real customers. Exclude them or your rate is meaningless noise.
- Annualizing by multiplying monthly x 12 instead of using the compound formula. At 3% monthly, this overstates annual churn by about 5.4 percentage points.
- Counting same-month upsells as expansion. If a customer upgrades during their first billing cycle, that's part of the initial sale - not retention-driven expansion.
- Inflating retention with stale win-backs. A customer who left for six months and came back isn't a retained customer. They're a new sale.
Negative Churn Explained
Negative net revenue churn means your expansion and reactivation revenue exceeds your losses from cancellations and downgrades. Your existing customer base is getting more valuable over time without adding a single new logo.
This isn't rare at scale - about 40% of SaaS businesses in the $15-30M ARR range achieve negative churn. The investor framing matters: GRR shows retention health, NRR shows growth trajectory. A company with 85% GRR but 115% NRR is losing customers but more than compensating through upsells. That's a viable business - but the 85% GRR signals an underlying retention problem that expansion is masking. Don't let a strong NRR number lull you into ignoring a weak GRR.
How to Reduce Revenue Churn
Fix Involuntary Churn First
Between 20-40% of churn in lower-ACV models comes from failed payments - expired cards, insufficient funds, billing errors. This is the highest-ROI lever you can pull.
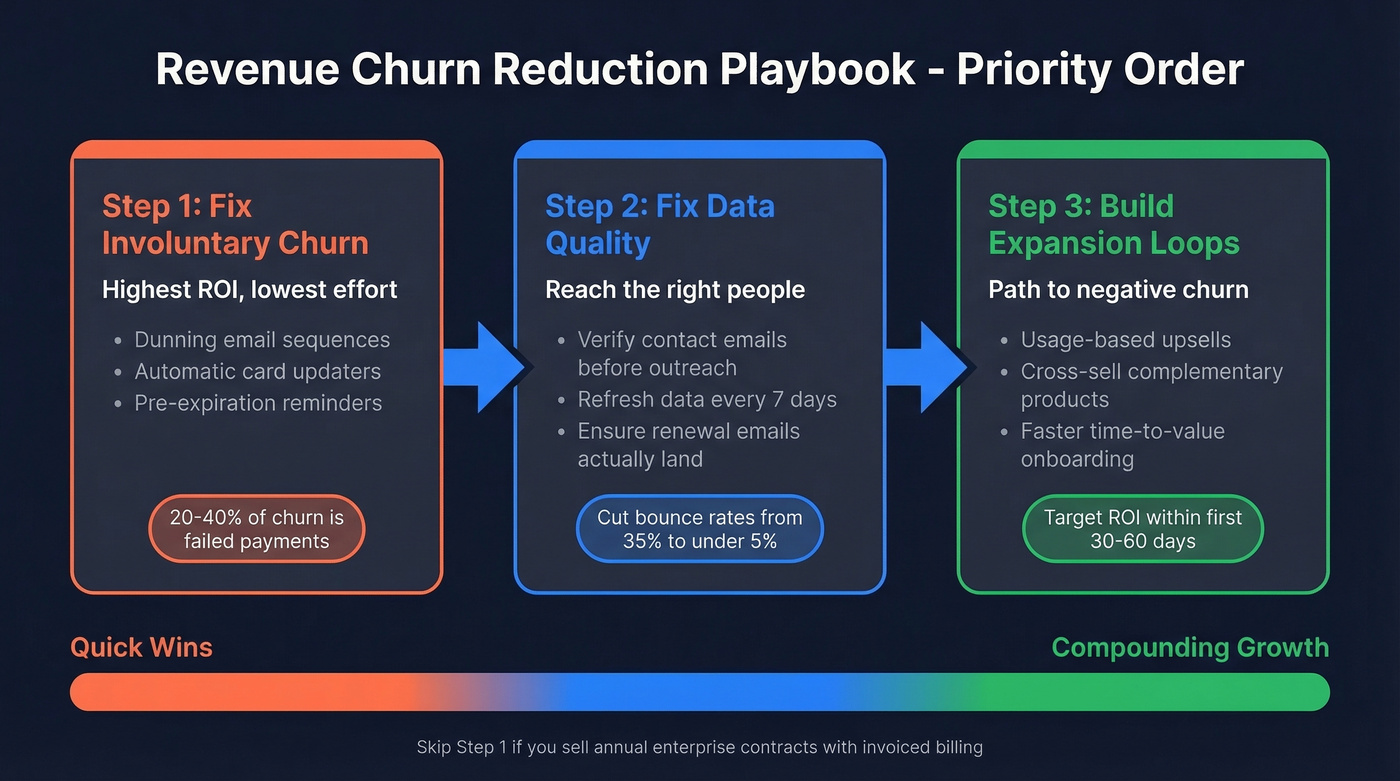
Implement dunning sequences, automatic card updaters, and pre-expiration reminders before you optimize anything else. Plug the hole in the bucket before pouring in more water. Skip this if you're selling exclusively annual enterprise contracts with invoiced billing - your involuntary churn is already near zero, and your time is better spent on onboarding and expansion.
Fix Data Quality Upstream
There's a churn driver hiding upstream that most CS teams never see: bad contact data. Stale emails lead to bounced outreach, burned sender domains, and failed renewal conversations - and eventually, lost revenue. We've seen teams at companies like Snyk cut bounce rates from 35-40% to under 5% by switching to Prospeo's 7-day data refresh cycle and 98% email accuracy, which meant renewal conversations actually reached the right stakeholders instead of bouncing into the void.
If you're cleaning lists at scale, it helps to standardize your CRM data enrichment rules and your email validation logic so CS and RevOps report the same numbers.
Build Expansion and Onboarding Loops
Expansion revenue is the path to negative churn. Upsells, cross-sells, and usage-based growth all offset gross losses in the net formula. The companies hitting negative churn have built product and pricing structures that naturally grow revenue within existing accounts.
Pair that with faster time-to-value during onboarding. If customers don't see ROI within the first 30-60 days, they're already mentally churned - the cancellation is just a formality that hasn't happened yet. Align sales compensation to retention too: clawbacks for accounts that churn within six months force reps to sell to the right customers, not just any customers willing to sign.
This is also where a land and expand motion and a clear product-led growth loop can reduce churn without adding headcount.
High gross churn often hides a targeting problem, not a product problem. Prospeo's 30+ filters - including buyer intent, technographics, and headcount growth - help you land accounts that stick, not accounts that churn in 90 days.
Better targeting means better retention. Find accounts worth keeping.
FAQ
What's the difference between revenue churn and customer churn?
Revenue churn measures lost dollars; customer churn measures lost logos. A single enterprise cancellation can represent more lost MRR than dozens of small accounts. Always track both, but revenue churn drives financial planning and valuation.
What's a good revenue churn rate for SaaS?
Enterprise SaaS targets under 1% monthly (~8% annual), while SMB products commonly see 3-5% monthly. Median net MRR churn above $1M ARR is 2.3% monthly. Always confirm how a benchmark defines "churned" before comparing - methodology differences make direct comparisons unreliable.
How do you annualize monthly churn?
Use the compound formula: Annual churn = 1 - (1 - monthly churn)^12. A 2% monthly rate compounds to ~21.5% annually, not 24%. Multiplying by 12 overstates the figure by several percentage points.
What is negative churn?
It means expansion revenue from existing customers exceeds lost revenue from cancellations and downgrades. About 40% of SaaS companies in the $15-30M ARR range achieve this, typically through usage-based pricing or structured upsell motions.
How does data quality affect revenue churn?
Stale contacts cause bounced outreach and missed renewal conversations - directly increasing involuntary attrition. Keeping your CRM data fresh with verified emails and current job titles ensures CS teams reach the right stakeholders before contracts lapse.