CAC LTV Ratio (LTV:CAC): How to Calculate It Correctly in 2026
Most "3:1" advice about the cac ltv ratio skips the part that actually matters: timing.
If your sales cycle runs for months and you divide this month's spend by this month's customers, you aren't measuring efficiency. You're measuring noise.
We've seen teams celebrate a "record-low CAC month" right before the pipeline dries up, simply because the spend happened earlier and the closes happened later. Same engine, different calendar.
What you need (quick version)
- Definition: cac ltv ratio = lifetime gross profit per customer ÷ fully-loaded CAC
- Use 3 formulas: simple, gross-margin-adjusted, and cohort + lag-aligned
- Two ratio killers: timing lag and undercounted CAC (salaries + tools + programs)
- If you're under $5M ARR: prioritize CAC payback over long-horizon LTV
- If NRR is high: separate new-logo vs blended efficiency
What the cac ltv ratio is (and why investors care)
The cac ltv ratio (often written LTV:CAC) is a unit economics shortcut: how many dollars of lifetime gross profit you get back for every dollar you spend to acquire a customer. It's popular because it compresses a messy go-to-market system (channels, sales cycles, churn, pricing, margin) into one number.
Investors care because it's a proxy for whether growth is efficient or just burn with a growth chart. The common shorthand is 3x LTV:CAC within ~5 years. That timeframe matters: a ratio that looks "great" on paper but takes forever to pay back is a cashflow trap.
One more nuance: a16z looked at 60+ US public consumer internet companies and found that improving LTV:CAC from ~2x to ~3x can nearly triple valuation. That's not a law of physics for every SaaS category, but it is a loud signal that markets reward efficient growth.
Callout: the ratio is a valuation story, not a dashboard widget LTV:CAC only means something when (1) LTV is gross profit, (2) CAC is fully-loaded, and (3) spend is aligned to the cohort it created. Miss one and you'll "improve" the ratio by changing accounting, not performance.
The three formulas you should actually use (simple -> GM-adjusted -> cohort/lag)
Most teams pick one formula and then argue about the number. The better move is to run three versions in parallel: a sanity check, a board-comparable version, and a reality-aligned cohort version.
Critical rule before you touch any formula: use matching time periods. Monthly ARPA requires monthly churn. Annual ARPA requires annual churn. Mixing them is how people "discover" fake 10:1 ratios.
Churn conversion (use this when you only have annual churn):
- Monthly churn ≈ 1 - (1 - annual churn)^(1/12)
- Example: annual churn 24% -> monthly churn ≈ 1 - 0.76^(1/12) ≈ 2.3%
Cheat sheet table (with real formulas)
| Version | LTV formula | CAC formula | Best for |
|---|---|---|---|
| Simple | ARPA ÷ churn | S&M ÷ new customers | Early sanity checks and weekly trend lines |
| GM-adjusted | (ARPA × GM%) ÷ churn | S&M ÷ new customers | Board decks, investor comps, cross-segment comparisons |
| Cohort + lag-aligned | Cohort gross profit over time | Lagged S&M(t-lag) ÷ new customers(t) | Any real ops view when sales cycles aren't instant |

Hard rules (no debate):
- If your sales cycle spans multiple months, don't use monthly CAC without lag alignment.
- For most sales-led motions, a strong default is lagging S&M by one quarter (and using 3-6 months for longer cycles).
- If you sell enterprise (multi-month cycles + expansions), GM-adjusted + cohort views beat the simple ratio every time. (See Enterprise Sales for cycle benchmarks and common pitfalls.)
Simple LTV:CAC (for quick sanity checks)
Use this when you need a fast "are we wildly off?" read.
- LTV (simple) = ARPA ÷ churn
- LTV:CAC = LTV ÷ CAC
It's directionally useful, but it hides two landmines: gross margin (a 90% GM SaaS and a 45% GM SaaS shouldn't look equally healthy) and lag (spend today creates customers later). If you need to sanity-check your cycle length, start with SaaS sales cycle benchmarks.
Gross-margin-adjusted LTV:CAC (for board/investor comparability)
This is the version we want in board decks because it's harder to game and easier to compare.
- LTV (GM-adjusted) = (ARPA × Gross margin %) ÷ churn
- LTV:CAC (GM-adjusted) = LTV (GM) ÷ CAC
If you only change one thing in your model, change this: treat LTV as gross profit, not revenue. I've watched "great" 4:1 ratios collapse to 2.5:1 the moment teams stop pretending COGS doesn't exist.
Your LTV:CAC ratio doesn't improve by tweaking formulas - it improves when reps actually reach buyers. Prospeo's 98% email accuracy and 30% mobile pickup rate mean more conversations per dollar of S&M spend, directly compressing your fully-loaded CAC.
Stop inflating CAC with bounced emails. Start connecting at $0.01 per verified lead.
Cohort + lag-aligned LTV:CAC (for reality)
This is the version that matches how cash actually behaves.
How it works:
- Build cohorts by acquisition month/quarter (the month/quarter the customer was acquired).
- Align CAC spend to the cohort it created by applying a lag (often one quarter, and 3-6 months for longer sales cycles).
- Track cohort gross profit over time and estimate the tail.
Numeric lag-alignment example (why the ratio "swings")
Assume:
- You spend $300k on S&M in Q1.
- Your average sales cycle is ~90 days.
- That Q1 spend mostly closes in Q2, not Q1.

If you calculate CAC the naive way in Q1:
- Q1 new customers: 30
- CAC (naive) = $300k ÷ 30 = $10k
But if Q1 spend actually produced Q2 customers:
- Q2 new customers: 60
- CAC (lag-aligned) = $300k ÷ 60 = $5k
Same business. Same spend. Two completely different stories. Timing isn't a footnote. It's the metric.
Worked example: end-to-end LTV:CAC (simple vs GM vs cohort/lag)
Here's a full numeric walkthrough you can copy into a spreadsheet.
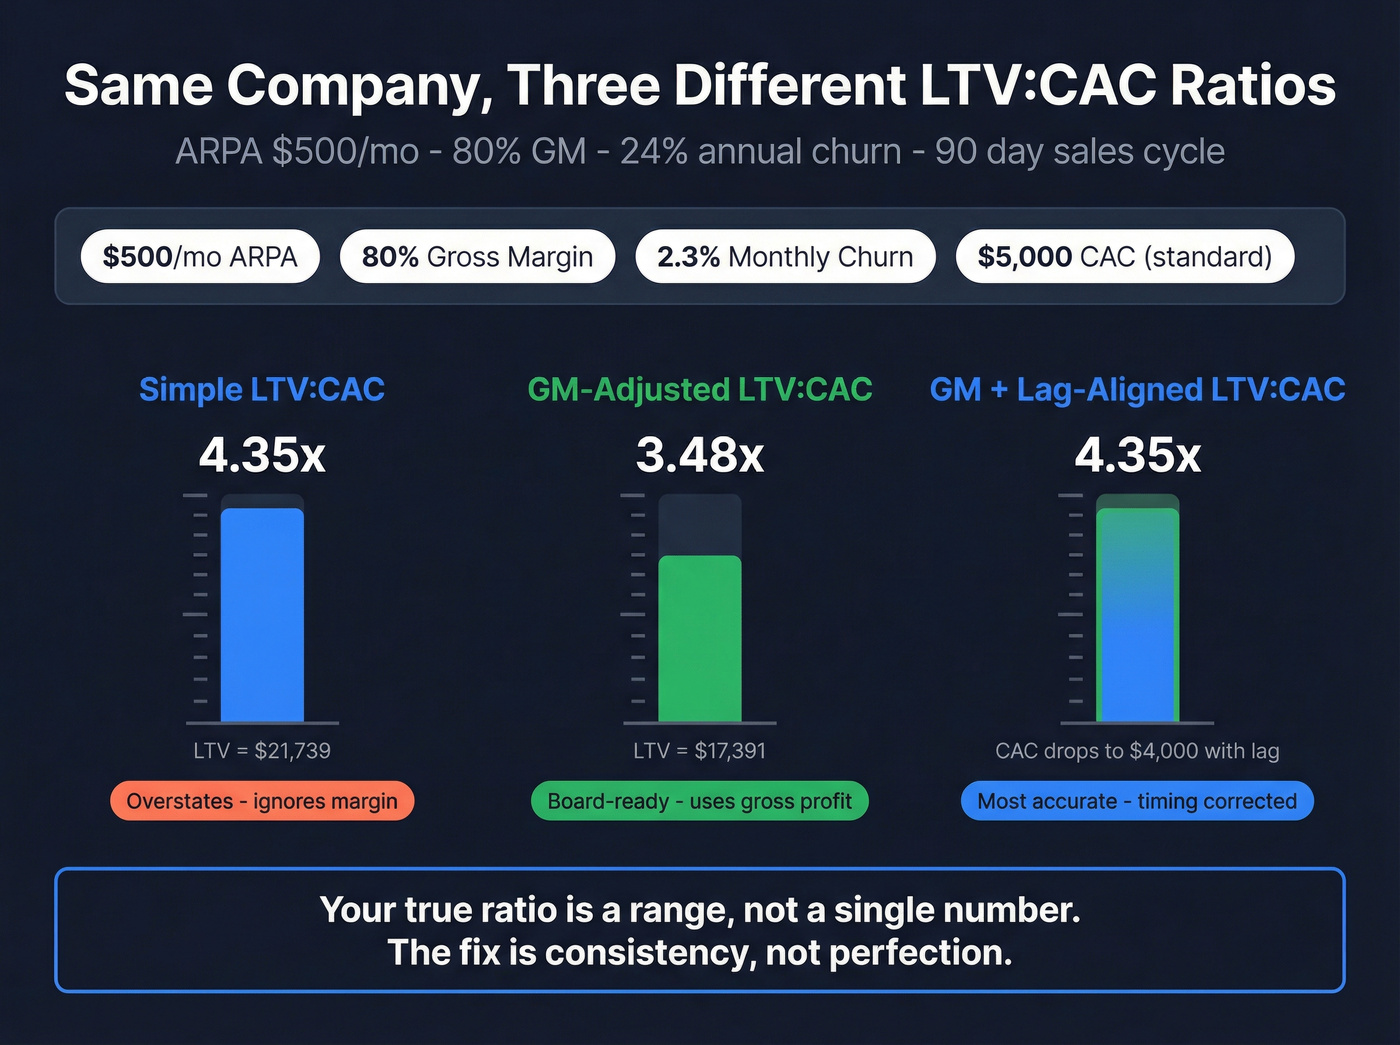
Inputs (monthly):
- Average revenue per account (ARPA): $500/month
- Gross margin: 80%
- Annual logo churn: 24%
- Monthly churn (converted): ~2.3%
- Fully-loaded S&M spend in Q2: $450,000
- New customers acquired in Q2: 90
- Sales cycle: ~90 days (use 1-quarter lag for cohort CAC)
Step 1) Compute CAC
- CAC (standard, Q2) = $450,000 ÷ 90 = $5,000
Step 2) Compute LTV (simple)
- LTV (simple) = ARPA ÷ churn = $500 ÷ 0.023 ≈ $21,739
- LTV:CAC (simple) = $21,739 ÷ $5,000 ≈ 4.35x
Step 3) Compute LTV (gross-margin-adjusted)
- LTV (GM-adjusted) = (ARPA × GM%) ÷ churn = ($500 × 0.80) ÷ 0.023 = $400 ÷ 0.023 ≈ $17,391
- LTV:CAC (GM-adjusted) = $17,391 ÷ $5,000 ≈ 3.48x
Step 4) Compute cohort + lag-aligned CAC (same LTV, different CAC)
If Q2 customers were mostly created by Q1 spend (1-quarter lag):
- Q1 S&M spend: $360,000
- Q2 new customers: 90
- CAC (lag-aligned) = $360,000 ÷ 90 = $4,000
Now the ratio changes again:
- LTV:CAC (GM-adjusted, lag-aligned) = $17,391 ÷ $4,000 ≈ 4.35x
Takeaway: your "true" ratio is a range unless you align spend to the cohort it created. That's normal. The fix is consistency, not perfection.
How to calculate CAC (fully-loaded) without lying to yourself
CAC gets "optimized" by omission. The easiest way to improve CAC is to pretend half your acquisition engine is "brand" or "product." That's also how you end up with a finance team that doesn't trust GTM reporting.
Use this baseline: CAC = total Sales & Marketing costs ÷ number of new customers acquired
What to include (fully-loaded S&M)
Use this as your "no excuses" inclusion list:

- Paid spend: search/social, sponsorships, affiliates
- Content + creative production (internal or contractors)
- Events/webinars, booths, travel tied to acquisition
- SDR/AE/marketing salaries + benefits + payroll taxes
- Commissions and spiffs (new logo)
- Agencies and contractors
- Tools: CRM, sequencing, enrichment, analytics, attribution, intent (see a baseline B2B sales stack)
- Sales enablement that directly supports acquisition
Mini example (quarterly):
- S&M spend: $450,000
- New customers closed (logo): 90
- CAC = $450,000 / 90 = $5,000
That number will feel worse than your paid-only CAC.
Good.
What to exclude (support, infra, R&D)
Keep these out of CAC:
- Customer support (post-sale)
- Infrastructure/hosting
- R&D / product engineering
Those belong in COGS or OpEx, not CAC. Don't mix "cost to acquire" with "cost to deliver."
Allocation rules (brand/retention overlap)
This is where teams get sloppy, and where dashboards quietly become fiction.
- If a program is 50% acquisition / 50% retention, split it.
- If you can't split it, pick a rule (say, 70/30) and stick to it for four quarters.
- If your sales cycle is long, allocate based on pipeline creation timing, not close timing. A clean way to operationalize this is with consistent B2B sales pipeline management timestamps and stage definitions.
Consistency beats perfection. Investors don't need your CAC to be metaphysically "true." They need it to be comparable over time.
How to calculate LTV (and when "ARPU × lifespan" breaks)
"ARPU × lifespan" works until it doesn't, especially in SaaS where margin varies by segment, expansion is real, and churn isn't constant.
My rule: if you're presenting LTV to anyone outside GTM (board, investors, finance), use gross-margin-adjusted LTV.
Gross margin vs COGS: what belongs where
GAAP doesn't perfectly standardize SaaS COGS, so companies vary. You still need a consistent definition, because if your COGS line drifts quarter to quarter (or gets "reclassified" during fundraising), your LTV:CAC trend becomes meaningless even if the business didn't change at all.
COGS typically includes:
- Hosting (AWS/GCP), third-party infrastructure
- DevOps/infrastructure staff to keep production running
- Support/CS focused on retention and satisfaction
- Third-party software/data that's part of delivering the product
- Fully burdened employee costs for the above
COGS typically excludes:
- Sales commissions
- Product management
- CS/account management focused on upsell/cross-sell
- Random overhead allocations
If you bury upsell-focused CS in COGS, you inflate CAC efficiency and deflate margin. It's double-counting with nicer charts.
Churn definitions (logo vs revenue churn; GRR vs NRR)
Your churn choice changes LTV dramatically:

- Logo churn: customers lost / customers at start
- Revenue churn: revenue lost / revenue at start
- GRR (gross revenue retention): ignores expansion
- NRR (net revenue retention): includes expansion
For LTV, logo churn is common for SMB. For mid-market/enterprise, revenue churn (or GRR/NRR) reflects reality better because one "logo" can be 10x another.
If your NRR is above 100%, expansion is doing real work in the model, so don't treat "LTV" like a single static number. Model it over time.
Present-value LTV (when discounting matters)
You don't need discounting for weekly ops, but it matters when:
- Sales cycles are long (enterprise)
- Payback is 18-30 months
- Expansion happens over years
- Cost of capital is meaningful
Discounting forces honesty: a dollar of gross profit in year 5 isn't worth a dollar today.
CAC LTV ratio benchmarks (ratio + payback + stage)
The internet repeats "3:1" like it's a commandment. It isn't. The useful version is time-bound: aim for ~3x within ~5 years, and make sure payback doesn't strangle cash.
Here are the interpretation bands that actually help operators:
LTV:CAC interpretation bands (and why 7:1 is a red flag)
| LTV:CAC | Meaning | Typical action |
|---|---|---|
| <1.0 | broken | fix churn or CAC immediately |
| 1-2 | fragile | tighten payback; stop waste |
| 2-3 | workable | improve + scale carefully |
| 3-5 | strong | invest to grow |
| >5 | under-investing or undercounted CAC | test more spend; audit CAC scope |
Look, a sky-high ratio isn't always a flex. Sometimes it's just fear: teams stop spending because they got burned once, then they brag about efficiency while competitors buy the market.
Industry context (rough targets, not laws)
Cross-industry benchmarks vary because margins, churn, and payback expectations vary. Use these as directional targets:
| Industry | Typical LTV:CAC target | Why it differs |
|---|---|---|
| B2B SaaS (subscription) | 3-5x | high gross margin, retention-driven |
| Ecommerce / DTC | 1.5-3x | lower margins, higher churn/return risk |
| Subscription media | 2-4x | churnier, but low CAC channels can work |
| Marketplaces | 2-5x | depends on take rate + repeat behavior |
| Consumer apps (paid) | 1-3x | volatile CAC, fast payback focus |
If you're far outside your category range, assume your definitions are wrong before you assume your business is special.
Stage-based guidance (payback-first under $5M ARR)
Under ~$5M ARR, LTV is mostly assumptions (retention curves, expansion, pricing changes). Payback is closer to cash truth. Once you have stable cohorts and retention curves, LTV:CAC becomes a sharper tool.
- Pre-PMF: track payback and learning velocity; expect noisy CAC and churn
- Post-PMF: push toward GM-adjusted 3-4x with lag alignment
- Scaling: protect payback while investing into repeatable channels (see SaaS go-to-market strategy)
Operator reality (what founders actually say)
A common operator complaint is that "3:1" gets used as a vibe, not a metric. One blunt line I've heard in founder circles: "If payback is ugly, LTV is just a story you tell yourself." That's the right instinct. Payback keeps you alive long enough for LTV to become real.
Decision tree: which metric to use (so you stop debating and start fixing)
Use this flow to pick the right "north star" for your stage and motion:
- Under $5M ARR? -> Track payback + new-logo CAC weekly; treat LTV as directional.
- Sales cycle spans months? -> Use cohort + lag-aligned CAC; ignore monthly CAC without lag.
- NRR >110%? -> Split reporting: new-logo vs expansion efficiency (don't blend).
- Gross margin <70%? -> Use GM-adjusted LTV only; revenue LTV will mislead you.
- Usage-based / variable margin? -> Add CAC Yield (below) and watch contribution margin.
- Raising capital / board reporting? -> Standardize definitions and lock them for 12 months.
CAC payback period (the metric that keeps you alive)
If LTV:CAC is the story, payback is the constraint.
Payback answers: "How many months until I earn back what I spent to acquire this customer?" If you're managing burn, this is the metric that determines whether you can keep buying growth.
A practical SaaS version:
- GM-adjusted payback (months) = CAC ÷ (net new MRR - average cost to serve)
Worked example (GM-adjusted):
- CAC: $6,000
- New MRR: $600
- Cost to serve: $120
- Contribution MRR: $480
- Payback = $6,000 / $480 = 12.5 months
Real talk: a "good" ratio with a 20-month payback is a cashflow problem wearing a KPI costume.
Modern SaaS reality: expansion makes blended CAC look better (even when new-logo worsens)
Expansion is why blended metrics lull teams into complacency.
Benchmarkit benchmarks (published in 2025, using 2024 underlying data) show:
- Median NRR is 101%
- Median expansion ARR is 40% of total new ARR
- Expansion is 50%+ for companies above $50M ARR
That changes CAC optics:
- Median new CAC ratio: $2.00 of S&M per $1 of new customer ARR
- Blended CAC ratio looks ~12% better because expansion inflates the denominator
So you can look "more efficient" while new-logo acquisition quietly gets worse.
New vs blended CAC (why they diverge)
| Metric | Numerator | Denominator | What it hides |
|---|---|---|---|
| New CAC ratio | Total S&M | New customer ARR | ignores expansion impact |
| Blended CAC ratio | Total S&M | New + expansion ARR | hides new-logo decay |
If your board only sees blended CAC, you'll underfund new-logo acquisition until it becomes a pipeline emergency. This is also where revenue dashboards help - one view for board comparability, another for operator reality.
Common LTV:CAC mistakes (and how to fix them like an operator)
Most "bad ratios" aren't bad businesses. They're bad definitions, bad timing, or bad segmentation. Fix those and the number stops whiplashing.
1) Mistake: No lag alignment (monthly CAC in a multi-month sales cycle)
Diagnosis: Your CAC "improves" in months where you close a few whales and "worsens" when you invest in pipeline. That's not performance. It's timing.
Fix (implementation):
- Pick a default lag (a strong starting point is one quarter, and 3-6 months for longer cycles).
- Create a simple mapping: CAC for cohort(t) uses S&M(t-lag).
- Validate lag using CRM timestamps: median days from first touch -> closed-won.
2) Mistake: Paid-only CAC (you're excluding the expensive parts)
Diagnosis: CAC looks amazing until you hire SDRs, then it "mysteriously" spikes. That's because you were never counting salaries, commissions, tools, and programs.
Fix (implementation):
- Create a "CAC scope" cost center in your GL that includes all acquisition S&M.
- Lock what's in-scope for 12 months.
- Report two numbers internally if you must (paid CAC and fully-loaded CAC), but treat fully-loaded as the real one.
3) Mistake: Mixing churn periods (monthly ARPA with annual churn)
Diagnosis: Your LTV is absurdly high (or low) and nobody can reconcile it to retention reality.
Fix (implementation):
- Standardize inputs: monthly ARPA + monthly churn (or annual + annual).
- Add a conversion cell in your model: monthly churn = 1 - (1 - annual churn)^(1/12).
- Put a big label in the sheet: "Periods must match."
4) Mistake: Blending everything (channels, segments, motions) into one ratio
Diagnosis: Your blended number looks stable, but growth stalls, or the opposite happens: growth looks great while churn quietly rises in one segment.
Fix (implementation):
- Segment by ICP, channel, region, and motion (PLG vs sales-led). Start with a crisp Ideal Customer definition.
- Kill the bottom quartile by payback, not by vibes.
- Keep one "company-wide" number for the board, but run the business on segmented cohorts.
5) Mistake: Counting retention work as acquisition (or vice versa)
Diagnosis: Marketing "CAC" improves when you launch customer webinars. Sales "CAC" improves when CS does renewals. Everyone wins; the business doesn't.
Fix (implementation):
- Split shared programs with a consistent rule (for example, 70/30).
- If you can't split cleanly, allocate by objective: pipeline creation = acquisition; renewal/expansion = retention.
- Don't change the rule mid-year.
6) Mistake: Changing definitions every quarter
Diagnosis: The ratio trends up and down, but nobody trusts it because the goalposts move.
Fix (implementation):
- Treat metric definitions like accounting policy.
- Version-control your dashboard definitions.
- When you change a definition, restate prior periods or annotate the break clearly.
Board-grade alternative: MetricHQ "CAC Ratio" (quick sanity benchmark)
If you want a clean, board-friendly efficiency metric that avoids lifetime assumptions, use MetricHQ's CAC Ratio framing:
- CAC Ratio = (New logo + upsell bookings × gross margin) ÷ S&M costs
Benchmark guidance commonly used:
- ~1.0x: healthy
- 0.5x-0.75x: acceptable for high-growth
- >1.5x: can indicate under-investment
MetricHQ also recommends lagging S&M by one quarter (or 3-6 months depending on sales cycle) so spend lines up with bookings.
This pairs well with LTV:CAC: CAC Ratio tells you current efficiency, LTV:CAC tells you lifetime efficiency.
If you're usage-based or AI-first, add CAC Yield (and consider LTV+)
Usage-based and AI-first models break classic LTV math because revenue and margin aren't stable. Churn isn't just "cancel." It's "usage decays," which behaves like churn without logos leaving.
A practical metric here is CAC Yield:
- CAC Yield = cohort monthly revenue ÷ cohort CAC Example: $120k cohort CAC generating $10k/month -> 8.3% CAC Yield
Benchmarks:
- 8%+ healthy
- 5-8% improve
- <5% inefficient
It maps cleanly to payback intuition: 8% monthly yield is roughly a 12-month payback.
If variable revenue is meaningful (rule of thumb: >10% of total revenue), report LTV+: LTV that includes margin-adjusted variable revenue, so you don't underinvest in high-usage cohorts.
How to improve LTV:CAC in practice (90-day action plan)
You don't improve the ratio directly. You improve the inputs: CAC, gross margin, churn/retention, and expansion.
Days 1-15: Fix definitions and build the minimum viable model
Do first (non-negotiable):
- Lock CAC scope (fully-loaded S&M) and LTV scope (gross profit).
- Choose churn per segment (SMB: logo churn; enterprise: revenue churn/GRR).
- Add lag alignment: start with one-quarter lag if your cycle spans months.
Do next (so it's usable):
- Run three ratios side-by-side: simple, GM-adjusted, cohort/lag.
- Add payback period to every view.
Days 16-45: Build cohort LTV that's defensible (not perfect)
- You need 6-12 months of data before cohort analysis is meaningful.
- Investors expect projections 36-60 months out.
- Retention curves flatten; start with a conservative long-run assumption (then replace it with your data).
Your goal is consistency and directional truth, not a model that pretends you can see five years into the future with precision.
Days 46-90: Pull the levers that actually move the ratio
Lower CAC (fast wins):
- Stop paying for wasted outbound. Bad contacts inflate CAC because reps burn time, sequences burn domains, and tools burn budget. In our experience, the quickest "week-one" improvement is simply cleaning up contact data so reps spend their hours talking to real buyers, not bouncing off dead inboxes and wrong numbers. Tools like Prospeo ("The B2B data platform built for accuracy") help here because the data is verified and refreshed every 7 days, which keeps deliverability and connect rates from quietly rotting over a quarter. (If you’re auditing list quality, start with B2B contact data decay.)
- Segment CAC by ICP and channel and cut the bottom quartile. Don't "optimize" it. Turn it off.
Increase LTV (real wins):
- Fix onboarding and time-to-value for the highest-churn cohort.
- Raise gross margin where it leaks (support load, infra inefficiency, services creep).
- Treat expansion as a product motion, not a sales hero story.
Skip this if you're still pre-PMF: don't waste weeks building a fancy 60-month LTV model. Put that time into retention interviews, onboarding fixes, and a payback view by channel. You'll get more truth, faster.
What I'd track weekly (opinionated): new-logo payback, GM-adjusted LTV, and blended CAC ratio together. One number lies; three numbers triangulate.
If your CAC payback period is stretching because reps waste hours on bad data, that's not a formula problem - it's a data problem. Teams using Prospeo book 35% more meetings than Apollo users, turning the same S&M budget into more closed customers.
Shrink your real CAC by reaching real buyers on the first attempt.
FAQ: CAC LTV ratio
What is a good CAC LTV ratio for SaaS in 2026?
For SaaS, a good CAC LTV ratio is usually 3-5x, with the common investor shorthand being ~3x within ~5 years. Under 2x is fragile unless payback is very fast. Above 5x is often under-investment or undercounted CAC.
Why can a high CAC LTV ratio (like 7:1) be bad?
A 7:1 ratio is often a definition problem, not a superpower: teams typically undercount CAC (skipping salaries/tools), overstate LTV (using revenue instead of gross profit), or under-invest in growth. In many SaaS motions, choosing 3-4x with faster payback is healthier than "perfect" efficiency.
Should CAC include salaries and tools (fully-loaded CAC)?
Yes, include fully-loaded Sales & Marketing (salaries, commissions, tools, agencies, events, content) so the metric is comparable over time. If you exclude them, CAC can look 30-60% lower on paper and you'll make scaling decisions off a fantasy number. Keep support, infrastructure, and R&D out of CAC.
How do I handle expansion revenue in CAC LTV ratio (new vs blended)?
Track both: new-logo efficiency to manage acquisition, and blended efficiency to understand the full engine. As a rule, if NRR is ~110%+, blended numbers can look 10-15% better simply because expansion inflates the denominator, so don't let blended metrics hide new-logo decay.
What's a fast way to reduce CAC from outbound waste?
The fastest CAC win is cutting wasted outreach by improving contact quality: fewer bounces, fewer dead numbers, and less rep time burned. Prospeo is a strong self-serve option because it delivers 98% verified email accuracy, 125M+ verified mobile numbers, and a 7-day data refresh, which typically improves deliverability and meetings per S&M dollar within a couple of weeks.
Summary: how to use the cac ltv ratio without fooling yourself
The cac ltv ratio is only useful when you (1) treat LTV as lifetime gross profit, (2) use fully-loaded CAC, and (3) align spend to the cohort it created with a realistic lag. Run simple, GM-adjusted, and cohort/lag views together, then manage the business on payback + segmentation, not a single "3:1" vibe.