Sales by Channel: How to Track & Optimize in 2026
You're in the board meeting. The CEO asks, "Which channel is actually driving revenue?" The VP of Sales points to outbound. The VP of Marketing points to paid. The partner lead points to resellers. Everyone's right - and everyone's wrong - because nobody's measuring sales by channel the same way.
Buyers now use an average of 10 interaction channels during a purchase journey, up from 5 in 2016. If you're not tracking channel performance with real rigor, you're flying blind in a cockpit with 10 dashboards showing different altitudes.
Start Here: Three Numbers Per Channel
Before you build dashboards or argue about attribution models, get three numbers right for every channel:
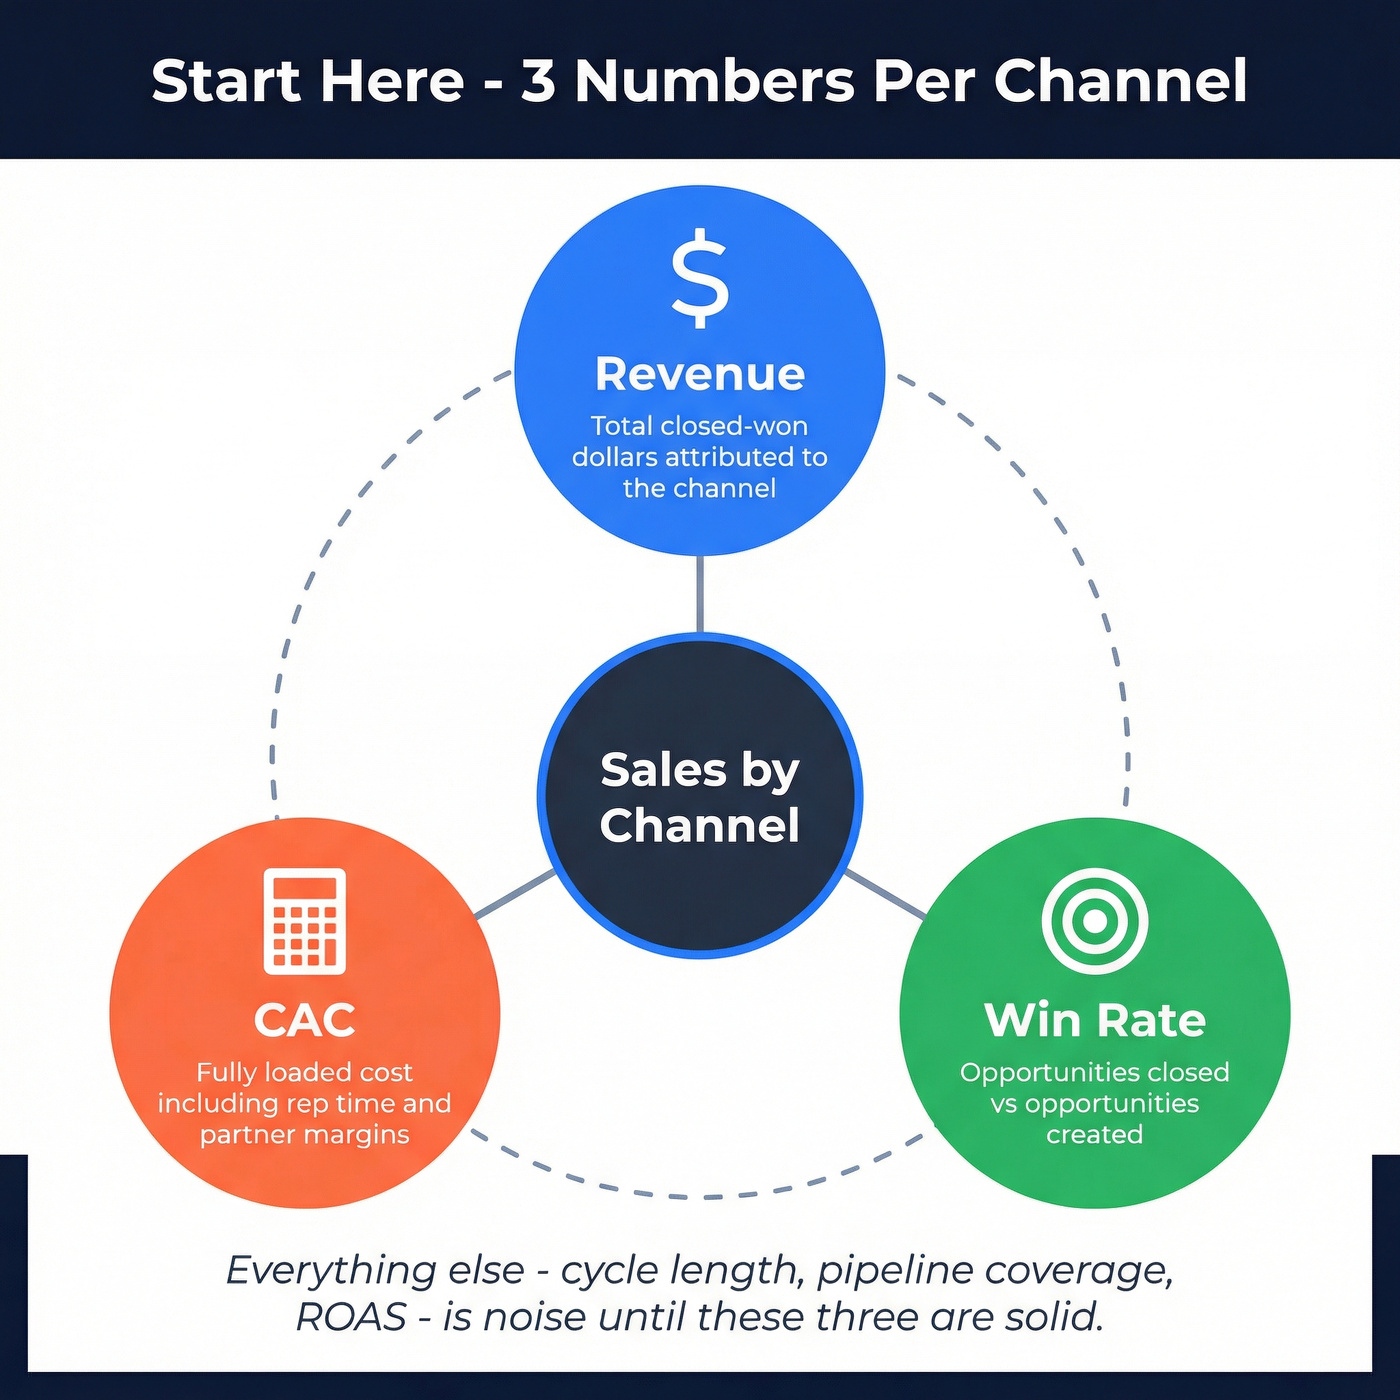
- Revenue - total closed-won dollars attributed to the channel
- CAC - fully loaded customer acquisition cost, including rep time and partner margins
- Win rate - opportunities closed vs. opportunities created
Everything else - cycle length, pipeline coverage, ROAS - is noise until those three are solid.
What "Sales by Channel" Actually Means
The phrase carries two distinct meanings, and most guides mash them together. The first is a taxonomy question: what are the different sales channels a business can use? The second is a reporting question: how do I measure and compare performance across those channels?
A channel taxonomy helps you decide where to sell. A channel report tells you whether that decision is working. Both matter, but they're different problems requiring different frameworks.
McKinsey's "rule of thirds" captures the modern reality well: at any stage of the buying process, roughly one-third of B2B buyers prefer in-person interaction, one-third prefer remote via phone or video, and one-third prefer digital self-serve. That split means most companies need multiple channels - and a framework for comparing them.
The Major Sales Channels
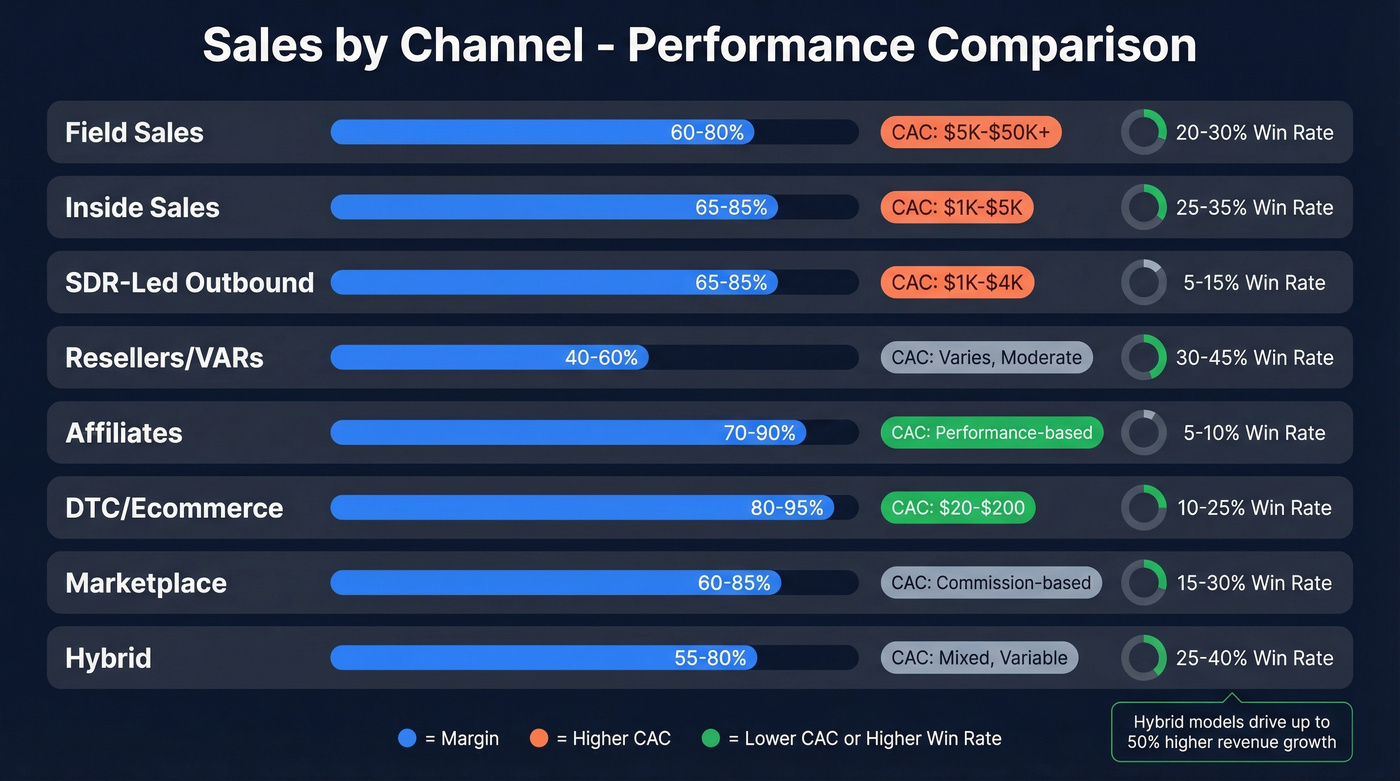
Every sales channel trades off reach, control, and margin differently.
| Channel Type | Typical Margin | CAC Range | Win Rate | Best For |
|---|---|---|---|---|
| Field sales | 60-80% | $5K-$50K+ | 15-25% | Enterprise, complex |
| Inside sales | 65-85% | $500-$5K | 20-30% | Mid-market, SaaS |
| SDR-led outbound | 65-85% | $300-$3K | 10-20% | Pipeline generation |
| Resellers/VARs | 40-60% | Lower (shared) | 35% above direct | Scale, new geos |
| Affiliates | 70-90% | Performance-based | 5-15% (CVR) | DTC, ecommerce |
| DTC / ecommerce | 80-95% | $20-$200 | 2-3% (CVR) | Consumer, SMB SaaS |
| Marketplace | 60-85% | Platform-dependent | 1-2% (CVR) | Discovery, volume |
| Hybrid | 55-80% | $500-$10K | Highest overall | Growth-stage B2B |
Direct Sales
Direct sales gives you full control over the buyer experience. Field reps handle complex, high-ACV deals where a handshake still matters. Inside sales teams work mid-market accounts over phone and video at higher velocity and lower cost. SDR-led motions sit upstream, generating pipeline that feeds both.
The tradeoff is cost. A fully loaded enterprise field rep often runs $200K-$350K/year before they close a single deal. Direct channels give you margin and control; they cost you scale.
Indirect & Partner Sales
Partner-sourced deals carry a 35% higher win rate and 25% lower CAC than direct motions. That's a significant edge. Resellers take 20-40% margin, but they bring existing relationships and local market knowledge you'd spend years building yourself.
The catch is attribution. When a reseller closes a deal that your marketing team sourced the lead for, who gets credit? Partner channel reporting is where most companies' measurement breaks down - and where channel conflict festers. We've seen direct reps and partner managers fight over the same account for months because nobody defined rules of engagement upfront. If you're standing up a partner channel, write the attribution rules before you sign the first partner agreement.
Online & Digital
Digital channels - your own ecommerce store, marketplace listings, social commerce - often offer lower CAC and higher margin potential at scale. Global ecommerce conversion rates hover around 1.9-2%, which sounds low until you consider the volume. Top 20% of stores hit 3.2%+, and the top 10% reach 4.7%+. Desktop converts at 3.9% vs. mobile at 1.8%, a gap that's been stubbornly persistent for years.
Hybrid Models
The highest-performing companies don't pick one channel. Hybrid selling companies see up to 50% higher revenue growth than single-channel companies, and 90% of B2B organizations plan to stick with hybrid approaches. The reporting challenge is stitching marketing, SDR, inside sales, field, and partner touchpoints into a coherent picture - which is exactly what the rest of this article covers.
Why Multi-Channel Wins
The data isn't subtle.
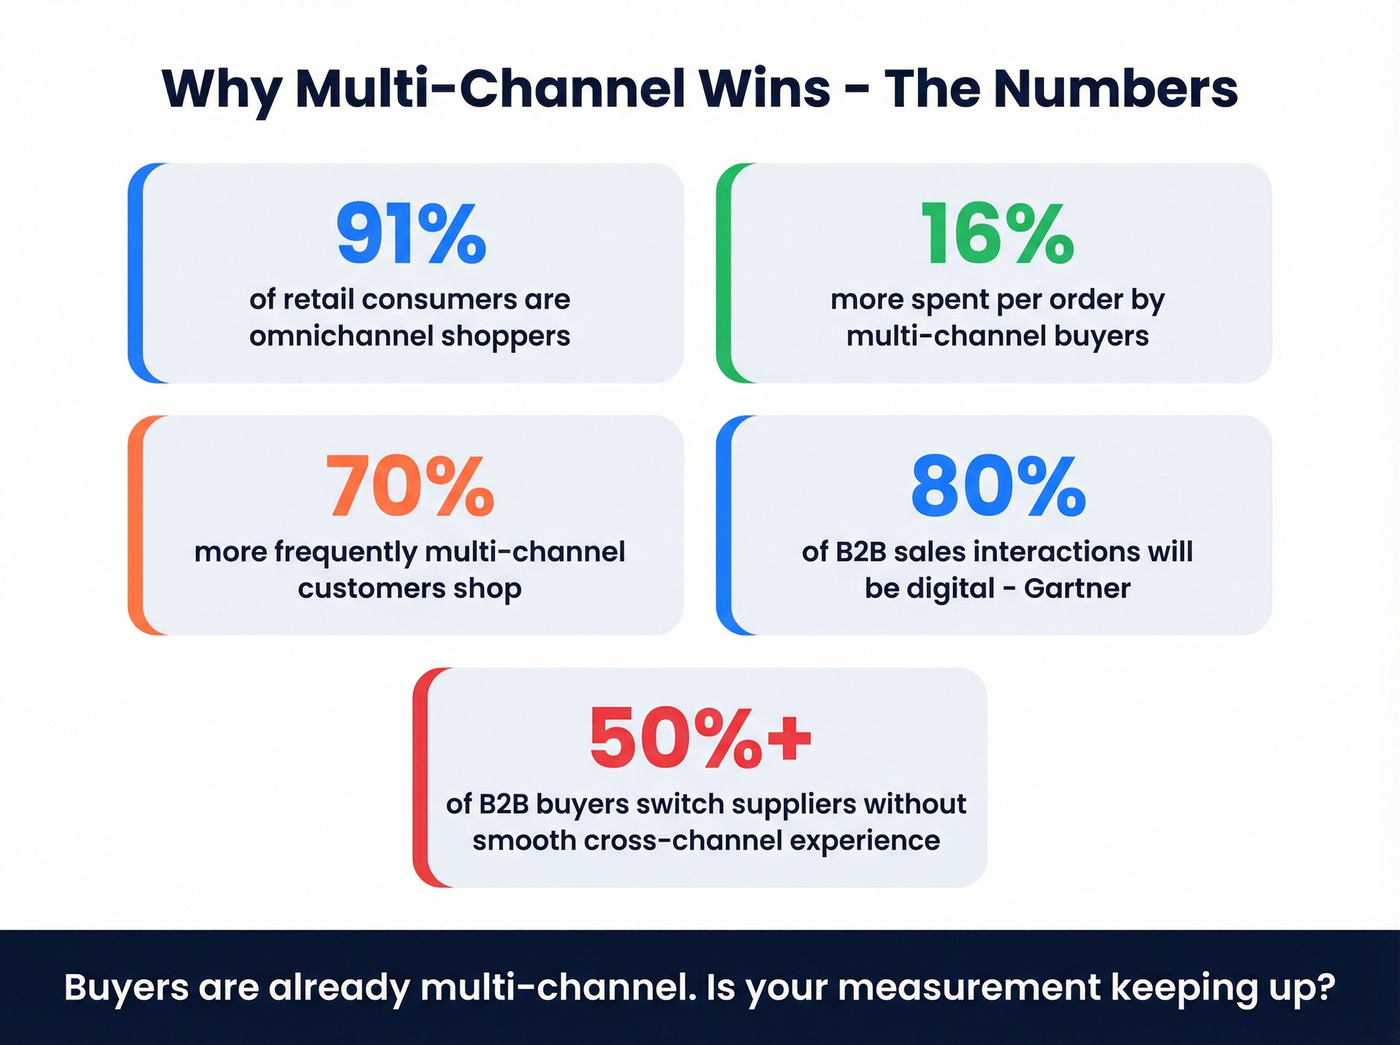
91% of retail consumers are omnichannel shoppers. Those customers spend 16% more per order and shop 70% more frequently than single-channel buyers. Multichannel ecommerce revenue is projected to reach $775.7B, growing 15.7% year-over-year. Gartner projects 80% of B2B sales interactions will happen through digital channels - the shift is already underway.
Over 50% of B2B buyers will switch suppliers if they don't get a smooth cross-channel experience. The buyers have already gone multi-channel. The question is whether your measurement has kept up.
Companies that track channel performance rigorously don't just report better - they allocate better. They shift budget from underperforming channels to high-ROI ones in weeks instead of quarters. Companies that don't track keep pouring money into the CEO's favorite channel because nobody has the data to argue otherwise. We've all been in that meeting.
How to Choose the Right Channels
You don't need 10 channels. You need 2-3 that you measure obsessively.
The right channels depend on four variables: product complexity, average deal size, customer geography, and margin requirements. A $500/month SaaS product with self-serve onboarding doesn't need field sales. A $200K enterprise platform with a 6-month implementation doesn't belong on a marketplace.
Early-stage companies should start with direct sales - founder-led or a small inside team. You need the feedback loops that come from talking to buyers directly. Growth-stage companies should layer in one additional channel, measure it independently for a full quarter, then consider a second. At scale, multi-channel is inevitable, but the winners can tell you exactly what each channel costs and produces.
Here's the thing: most companies add channels too fast and measure them too late. By the time they realize a channel isn't working, they've burned two quarters and a headcount on it. Build measurement infrastructure first, then add channels.
Your SDR-led outbound channel can't win if reps waste hours on bad contact data. Prospeo delivers 98% email accuracy and 125M+ verified mobiles with a 30% pickup rate - so your outbound CAC drops and win rates climb.
Stop measuring a broken channel. Fix the data feeding it.
Building a Channel Report
The Spreadsheet Structure
Every channel report starts with a flat fact table. Whether you're in Excel, Google Sheets, or a BI tool, the columns are the same: Date (close or booking date), Deal/Order ID, Channel (direct-inside, direct-field, partner-reseller, DTC-web, marketplace), Campaign or Source for sub-channel attribution, Revenue (closed-won amount), COGS, Channel Costs (partner margin, ad spend, commission), Rep or Partner Name, and Region.
From this flat table, you build pivot tables that slice revenue, CAC, and win rate by channel. The pivot is where the insight lives - the fact table is plumbing.
Essential KPIs by Dashboard
Not every stakeholder needs the same view. GoodData's dashboard taxonomy breaks this into useful categories:
Pipeline dashboard: total pipeline value, open opportunities by channel, average deal size, cycle length, win rate per channel. For sales managers running weekly reviews.
Revenue dashboard: total revenue by channel, MRR/ARR, upsell/cross-sell impact, LTV by channel. The board-level view.
Forecasting dashboard: pipeline coverage ratio, probability-weighted forecast, pipeline-to-target by channel. For the CFO who wants to know if you'll hit the number.
Organizations using CRM-based dashboards see a 29% increase in sales, and teams with mobile CRM access hit quota at 65% vs. 22% without. The tool matters less than the discipline of building and reviewing dashboards weekly - a dashboard nobody opens is just a screenshot.
Formulas You'll Actually Use
Revenue share % = Channel Revenue / Total Revenue x 100 Tells you which channels are pulling weight.
Quarterly growth rate = [(Q2 Revenue - Q1 Revenue) / Q1 Revenue] x 100 Tells you which channels are accelerating or decelerating.
Marginal revenue = (Total Revenue - Previous Revenue) / (Total Units - Previous Units) Tells you whether adding volume to a channel is still profitable or hitting diminishing returns.
We've watched teams spend months building attribution models when they didn't even have revenue share by channel calculated correctly. Get the basics right first.
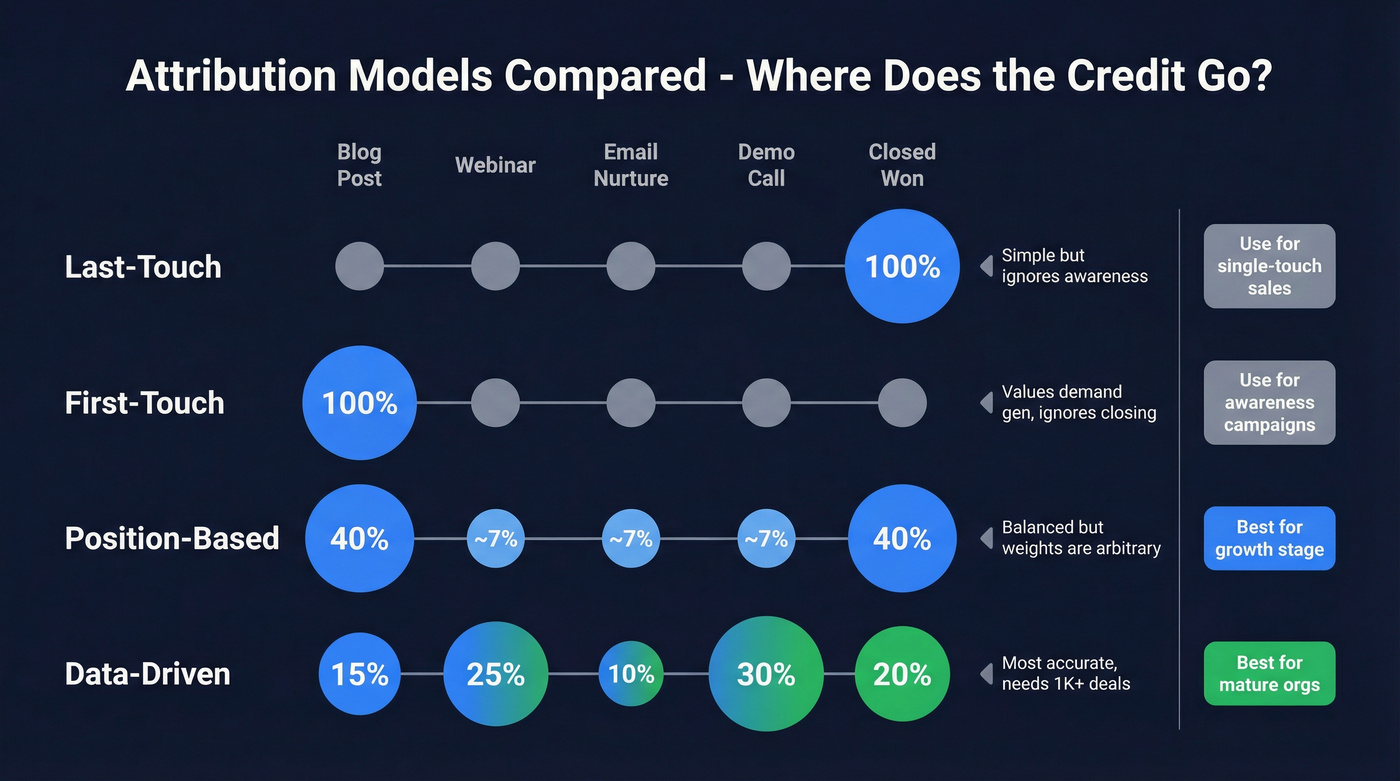
Attribution: Crediting the Right Channel
Four Models Compared
| Model | How It Works | Pros | Cons | Best For |
|---|---|---|---|---|
| Last-touch | 100% credit to final touchpoint | Simple, actionable | Ignores awareness | Early-stage, low volume |
| First-touch | 100% credit to first touchpoint | Values demand gen | Ignores closing | Brand/awareness teams |
| Position-based | 40% first, 40% last, 20% middle | Balanced | Arbitrary weights | Growth-stage B2B |
| Data-driven | ML-weighted by impact | Most accurate | Needs volume + data | Mature orgs, 1K+ deals |
B2B Attribution at Account Level
Most attribution tools were built for B2C - one person, one cookie, one conversion. B2B doesn't work that way. You've got 5-10 stakeholders per deal, each touching different channels over a 1-3 month cycle.
The fix is account-level attribution. Instead of asking "which channel converted this lead," ask "which channels engaged this account before it closed." That requires stitching CRM, marketing automation, ad platforms, and website analytics into a unified account view.
One operational rule most teams skip: total attribution credit must reconcile to actual closed-won revenue. If your model says channels generated $5M but your books show $4M, something's broken. Run this reconciliation monthly.
2026 Attribution Constraints
Attribution in 2026 is harder than it was in 2020. Signal loss from privacy changes, walled gardens where Meta, Google, and LinkedIn all report their own inflated numbers, and cross-device identity fragmentation mean your data is inherently incomplete.
Attribution windows create their own bias - a 7-day window and a 30-day window tell completely different stories about the same channel. And "dark social" - Slack messages, podcast mentions, word-of-mouth - drives real pipeline that no model captures.
The practical response: don't chase perfect attribution. Use position-based as your default, run incrementality tests on your biggest channels quarterly, and accept that 15-20% of your pipeline will always be unattributable. That's better than pretending last-touch is telling you the truth.
Channel Performance Benchmarks
Ecommerce Benchmarks
| Metric | Benchmark | Notes |
|---|---|---|
| Global CVR | 1.9-2% | Shopify stores: 2.5-3% |
| Desktop CVR | 3.9% | 2x mobile |
| Mobile CVR | 1.8% | 73% of sessions |
| Top 20% CVR | 3.2%+ | Top 10%: 4.7%+ |
| Cart abandonment | 70.22% | Mobile: 73-75% |
| Add-to-cart rate | 6.5-7.5% | "Strong" is 8%+ |
Paid ads convert lower than email or organic - keep that in mind when comparing channel CVRs. A 1.5% CVR from paid isn't bad if the volume is 10x your email list.
B2B Benchmarks
Average B2B close rate sits at 29%, with win rates around 21%. Sales cycles run 1-3 months for most deals, though 8% of high-value deals stretch past 5 months.
On the partner side, 89% of sales teams now use partner channels, and 84% say the revenue impact increased year-over-year. Upsell and cross-sell contribute roughly 21% of company revenue on average. If you're not tracking partner-sourced revenue as a distinct channel, you're missing a fifth of the picture.

Common Channel Reporting Mistakes
Last-touch attribution as your only model. Last-touch is lying to you. It gives 100% credit to whatever happened right before the deal closed, ignoring every touchpoint that built awareness and trust. Layer in position-based attribution and compare the two views side by side - the delta shows you which channels are undervalued.
Ignoring data quality in your outbound channel. This one's frustrating because it's so fixable. If a huge chunk of your outbound emails bounce, your "email channel" doesn't have a performance problem - you have a data problem. Meritt switched to Prospeo's real-time email verification and saw bounce rates drop from 35% to under 4%, which completely changed how their outbound channel looked in reporting. Keep bounce rates under 2% and spam complaints under 0.01% - those are the guardrails that keep your channel metrics honest. (If you need a deeper deliverability checklist, start with hard bounces and email verification for outreach.)
Not connecting measurement to action. 84% of sales reps missed quota last year. That's not just a performance problem - it's a measurement problem. If reps can't see which channels produce the best leads, they waste time on low-conversion sources. Channel reporting should change behavior weekly, not sit in a quarterly deck gathering dust.
Treating all channels as independent. A prospect sees your ad, attends a webinar, gets an SDR email, and closes through a partner. Treating each channel as independent overstates closing channels and understates awareness channels. Multi-touch attribution exists to solve this - use it.
Let's be honest about a pattern we see constantly in RevOps communities and on r/salesoperations: teams build beautiful dashboards but never define what action each metric triggers. If outbound CAC rises above $X, do you cut spend or fix the data? If partner win rates drop below Y%, do you retrain or restructure? Every metric needs a threshold and a playbook, or it's decoration.
Tools for Tracking Sales by Channel
CRM: Salesforce ($25-$300/user/month) or HubSpot (free to ~$20/user/month) as your system of record. Every deal needs a channel field. Non-negotiable. (If you're standardizing fields, use a CRM lead source framework.)
Dashboards: Geckoboard (from ~$49/month) for wall-mounted sales dashboards. monday.com (free to ~$12/seat/month) for teams that want CRM and project management in one place. For a KPI list, see a sales reporting dashboard.
Attribution: HockeyStack ($1K-$5K/month) for B2B account-level attribution. Improvado ($2K-$10K/month depending on data volume) for enterprise-scale data aggregation across channels.
Partner management: PartnerStack ($500-$2K/month for most SaaS programs) for managing affiliate and reseller channels at scale. If you're building comp plans, start with channel sales incentive programs.
Data quality: For outbound channel accuracy, tools like Prospeo give you 98% email accuracy on 300M+ profiles with a 7-day refresh cycle. The free tier covers 75 verified emails per month, and paid plans run about $0.01 per email. No contracts. For governance, use a CRM hygiene checklist and track prospect data accuracy.
Skip dedicated attribution tools if you're under 500 closed deals per year - the complexity isn't worth it yet. A well-structured CRM report will get you 80% of the way there.
Hybrid selling drives 50% higher revenue growth - but only when every channel has clean data. Prospeo refreshes 300M+ profiles every 7 days, so your inside sales, field, and outbound teams all reach real buyers, not dead inboxes.
Power every sales channel with data that actually connects.
FAQ
What's the difference between channel sales and direct sales?
Direct sales means your own team sells to the buyer. Channel sales uses third parties - resellers, affiliates, distributors - who sell on your behalf for a margin of 20-40%. Direct gives you control and higher margins; channel gives you scale and lower CAC. Most growing companies use both.
How many sales channels should a company use?
Most companies perform best with 2-3 well-instrumented channels rather than spreading thin across 10. Add channels one at a time, prove ROI with at least one full quarter of data, then expand. Premature diversification kills measurement discipline.
What's the best attribution model for multi-channel sales?
Position-based attribution (40/20/40 weighting) is the best starting point for most B2B teams. Move to data-driven attribution once you have 1,000+ closed deals to train the model reliably. Don't rely solely on last-touch - it systematically undervalues awareness channels.
How do I improve outbound channel metrics fast?
Verify your contact data before blaming the channel. Teams using 98%-accuracy email verification typically see bounce rates drop below 4%, which immediately lifts deliverability, reply rates, and every downstream metric. Clean data is the fastest lever for outbound performance.