ABM Reporting: Metrics, Dashboards & Formulas That Prove ROI
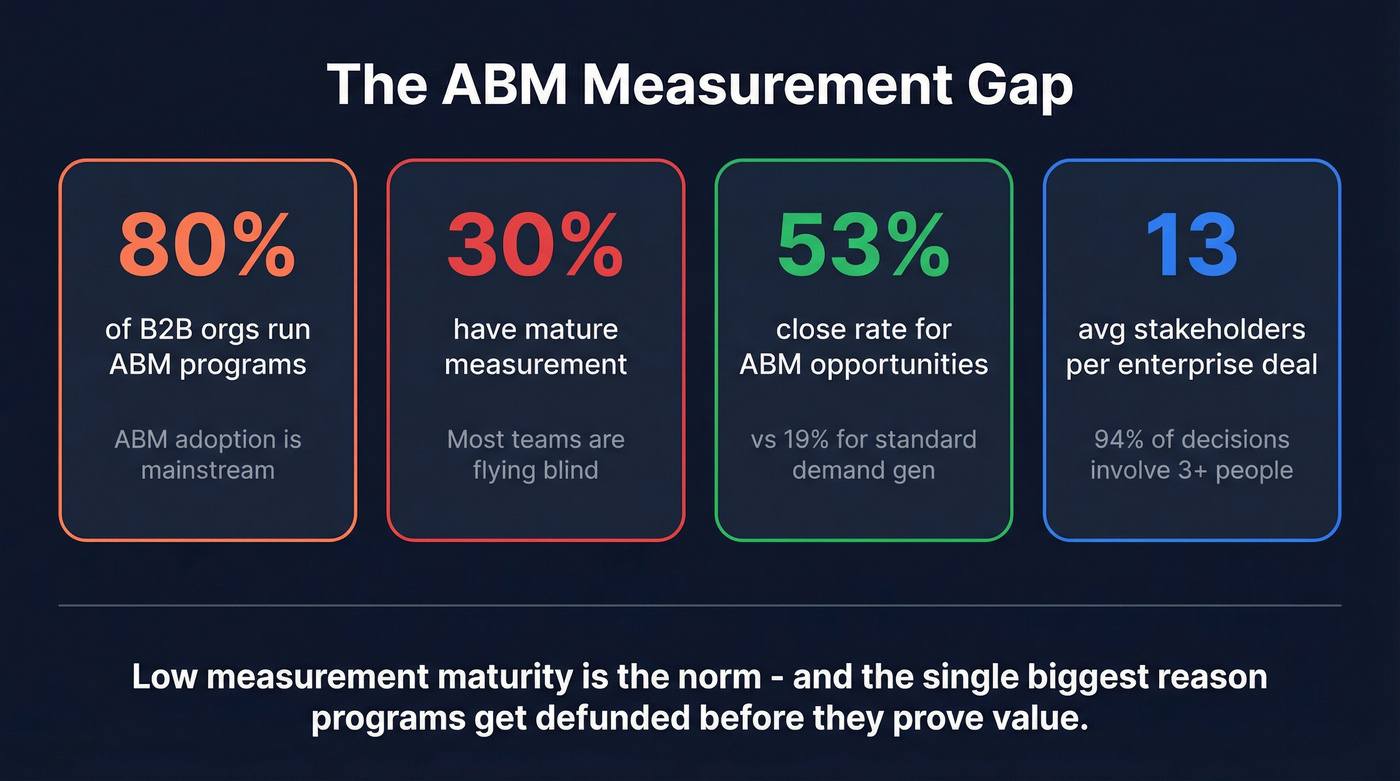
About 80% of B2B organizations run ABM programs. Only 30% have mature measurement in place. The rest are flying blind - lead-level metrics bolted onto an account-level strategy, engagement dashboards that impress nobody at the budget table. The gap between programs that get funded and programs that get cut? It's almost always reporting.
| ABM Maturity Level | % of Organizations | Avg Budget Allocation |
|---|---|---|
| Just getting started | 27% | ~26% |
| Somewhat developed | 51% | ~26% |
| Well-established | 15% | ~34% |
| Fully scaled | 4% | ~66% |
Roughly 70% of ABM teams operate with immature reporting while pouring a quarter or more of their budget into the strategy. Low measurement maturity is the norm, not the exception - and it's the single biggest reason programs get defunded before they prove value.
Here's the thing: most ABM teams don't have a strategy problem. They have a measurement problem. Fix the measurement and the strategy fixes itself, because you can finally see what's working.
Start here:
- Define account stages from target to closed-won with clear transition criteria. No stages means no velocity metrics.
- Pick 5-7 core KPIs. Pipeline velocity, engagement score, buying committee coverage, stage conversion rates, ABM ROI.
- Build two dashboards. One tactical for weekly ops, one strategic for monthly leadership. Two dashboards beat twenty.
- Verify your target account list. If 30% of your contact emails bounce, every downstream metric is fiction. (If you need a process, start with CRM hygiene.)
- Align on what counts. Sales and marketing must agree on what a "meaningful interaction" looks like before you measure anything.
What Account-Level Reporting Actually Means
ABM reporting tracks performance at the account level, not the lead level. That distinction changes everything about how you measure, attribute, and optimize.
Traditional demand gen follows individual leads through a funnel: MQL to SQL to opportunity to closed-won. Account-based reporting follows accounts. A single account might have 15 people engaging across different channels, at different times, through different campaigns - and your job is to roll all of that activity up to the account and measure whether it's progressing toward revenue.
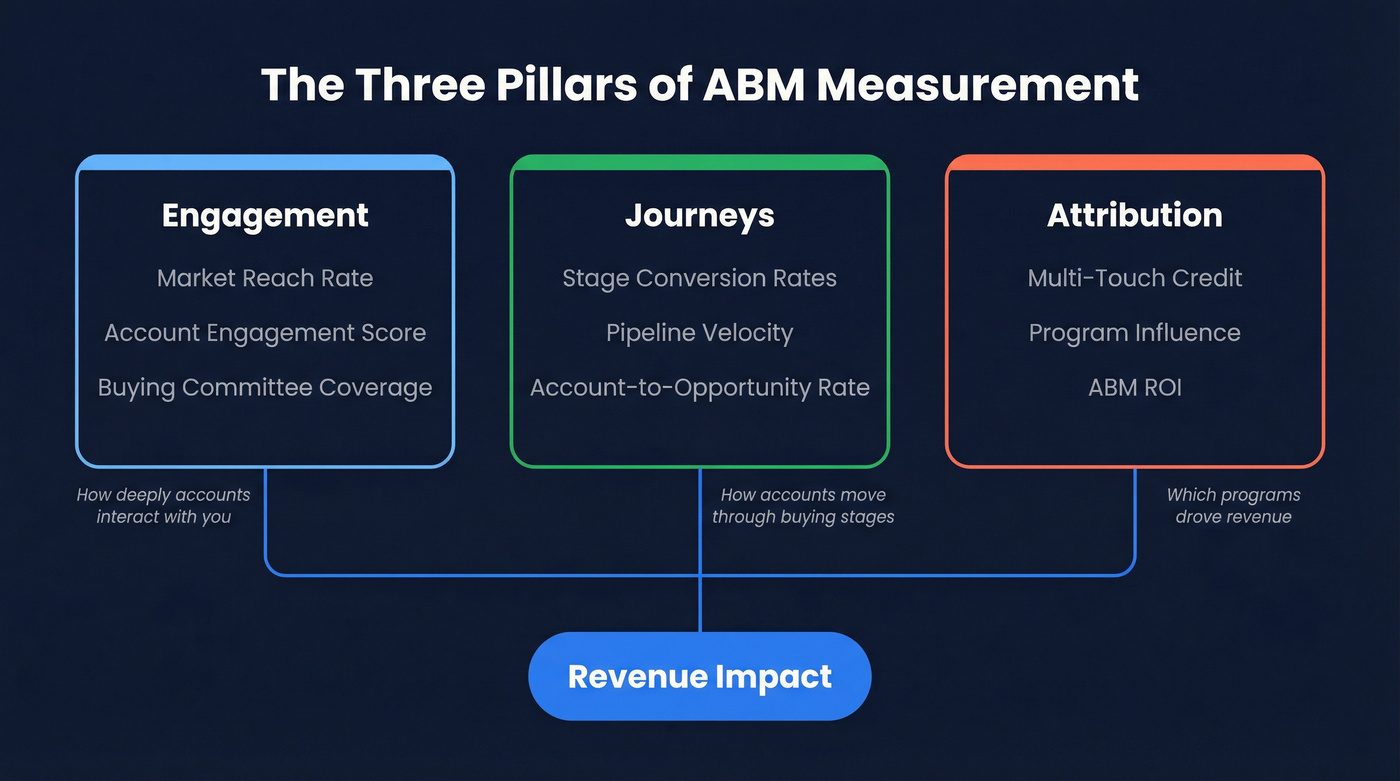
Demandbase breaks ABM measurement into three categories: Engagement (how deeply accounts interact with you), Journeys (how accounts move through buying stages), and Attribution (which programs drove revenue). Every metric you track should map to one of those three.
The payoff is real. A TOPO benchmark found that opportunities from accounts receiving an account-based approach closed at 53%, compared to 19% for standard demand gen. But you'll never prove that gap exists in your own data without proper account-level reporting. The average enterprise purchase involves 13 internal stakeholders and 9 external advisors. 94% of B2B buying decisions involve three or more people. If you're still reporting on individual leads, you're measuring fragments of a buying decision - not the decision itself.
ABM Metrics With Formulas
Reach & Engagement
Market Reach Rate measures what percentage of your TAM you're actually reaching.
Formula: (Total reachable accounts / [Total addressable accounts](https://corporatefinanceinstitute.com/resources/management/total-addressable-market-tam/)) x 100
If your TAM is 2,000 accounts and campaigns have touched 1,400, your reach rate is 70%. Below 50% means your targeting or channel mix has gaps. Above 80% and it's time to focus on depth over breadth. (If you're still tightening your list, use an ABM account prioritization model.)
Account Engagement Score aggregates all interactions from a target account into a single number. Assign weights to activity types and sum them across all known contacts at the account.
A practical scoring model: website visit (1 point), content download (3), email click (2), webinar attendance (8), demo request (15), meeting held (20). An account scoring above your 75th percentile threshold is "highly engaged." Pick your weights, stick with them for two quarters, then recalibrate based on which activities actually correlate with pipeline creation. (If you want a scoring framework, see ABM lead scoring.)
Buying Committee Coverage tracks what percentage of the buying committee you've identified and engaged at each target account.
Formula: (Known/engaged stakeholders / Estimated buying committee size) x 100
If the typical enterprise deal involves 13 internal stakeholders and you've identified 4, your coverage is 31%. That's a problem. 87% of marketers say ABM outperforms other investments, but that outperformance depends on multi-threading into the buying committee - not just engaging one champion. (For a practical way to map roles, use buying group personas.)
Pipeline & Conversion
Pipeline Velocity is the single most important ABM metric. Full stop.
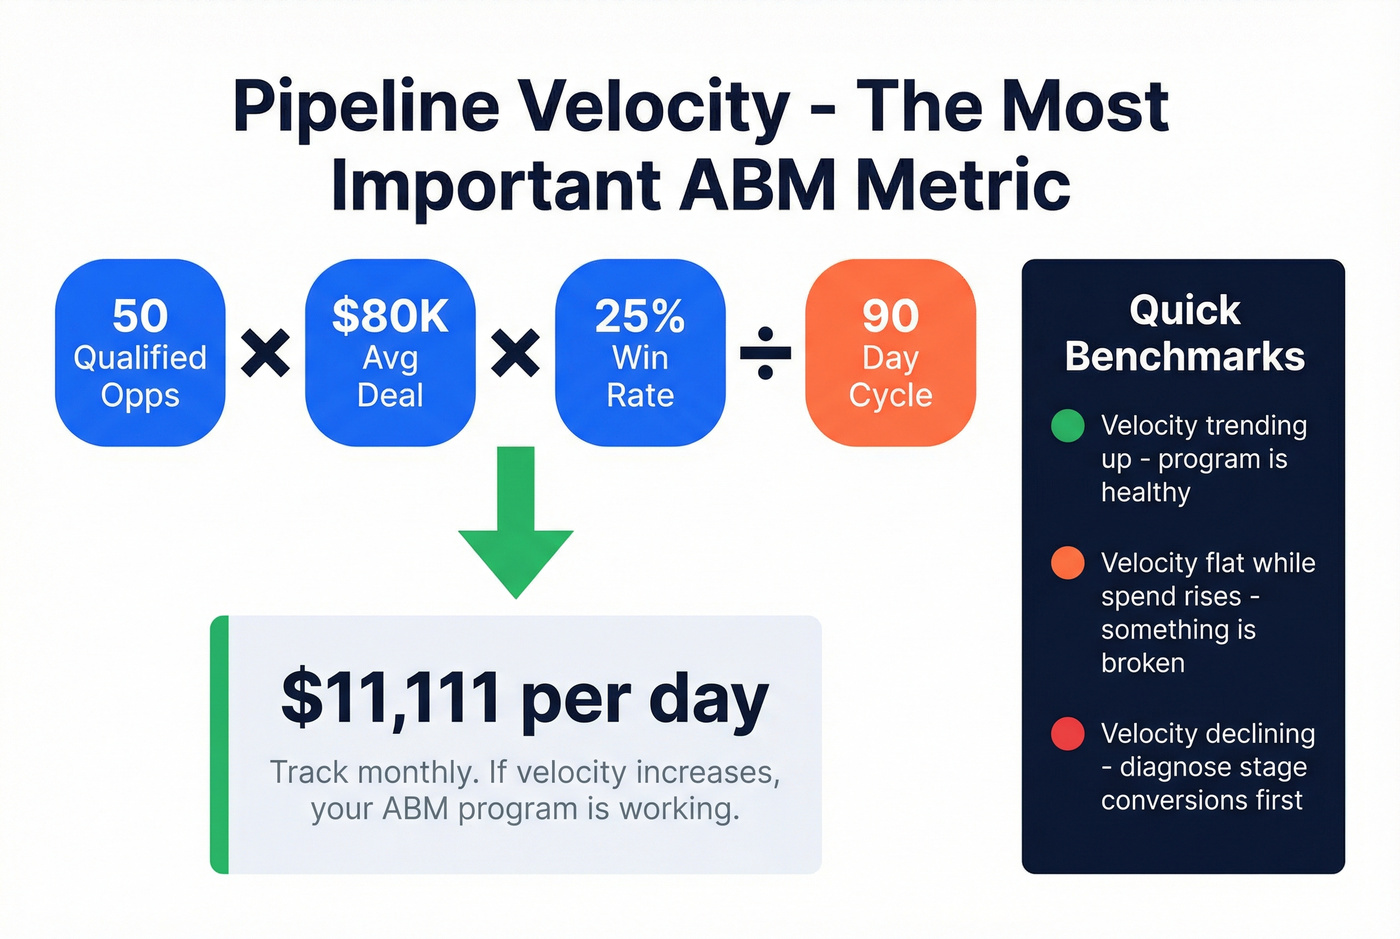
Formula: (Qualified opportunities x Average deal size x Win rate) / Sales cycle length
Worked example: 50 qualified opportunities x $80,000 average deal x 25% win rate / 90-day sales cycle = $11,111 per day. Track this monthly. If velocity increases, your ABM program is working. If it flatlines while spend increases, something's broken. (If you're trying to make this predictable quarter to quarter, use a pipeline predictability cadence.)
Stage Conversion Rates measure how efficiently accounts move between stages: target to aware to engaged to opportunity to closed-won. If 200 accounts enter "engaged" and 40 become opportunities, your conversion rate is 20%.
Account-to-Opportunity Conversion Rate is the broadest funnel metric. We've seen healthy programs convert 15-25% of Tier 1 accounts to opportunities within 12 months.
Revenue & Forecasting
ABM ROI is the metric your CFO cares about most.
Formula: (Revenue from ABM accounts - ABM program cost) / ABM program cost x 100
Worked example: $2.4M in closed revenue, $400K total program cost. ROI = ($2.4M - $400K) / $400K x 100 = 500%. Track this over a 6-18 month window - measuring quarterly will make the program look worse than it is because ABM sales cycles run longer than demand gen.
Pipeline velocity and stage conversion rates feed directly into forecasting models. When you can reliably predict how many accounts will move from "engaged" to "opportunity" each quarter - and at what deal size - finance teams start trusting ABM as a revenue engine, not a marketing experiment. (If forecasting is a recurring fight, fix deal forecast accuracy first.)
Average Deal Size comparison between ABM and non-ABM pipeline tells you whether your targeting is working. If ABM deals aren't meaningfully larger, your engagement strategy needs rethinking.
Account Retention & Expansion Rate tracks post-sale performance. Expansion revenue from existing accounts is often the highest-ROI ABM motion, and tracking the percentage of ABM accounts that renew, upsell, or cross-buy within 12 months gives you the clearest picture of long-term program value.
Moving From MQLs to MQAs
The shift from Marketing Qualified Leads to Marketing Qualified Accounts is where most implementations stall - not because the concept is hard, but because the transition breaks existing workflows. Inverta's research identifies five pitfalls that kill MQA rollouts.
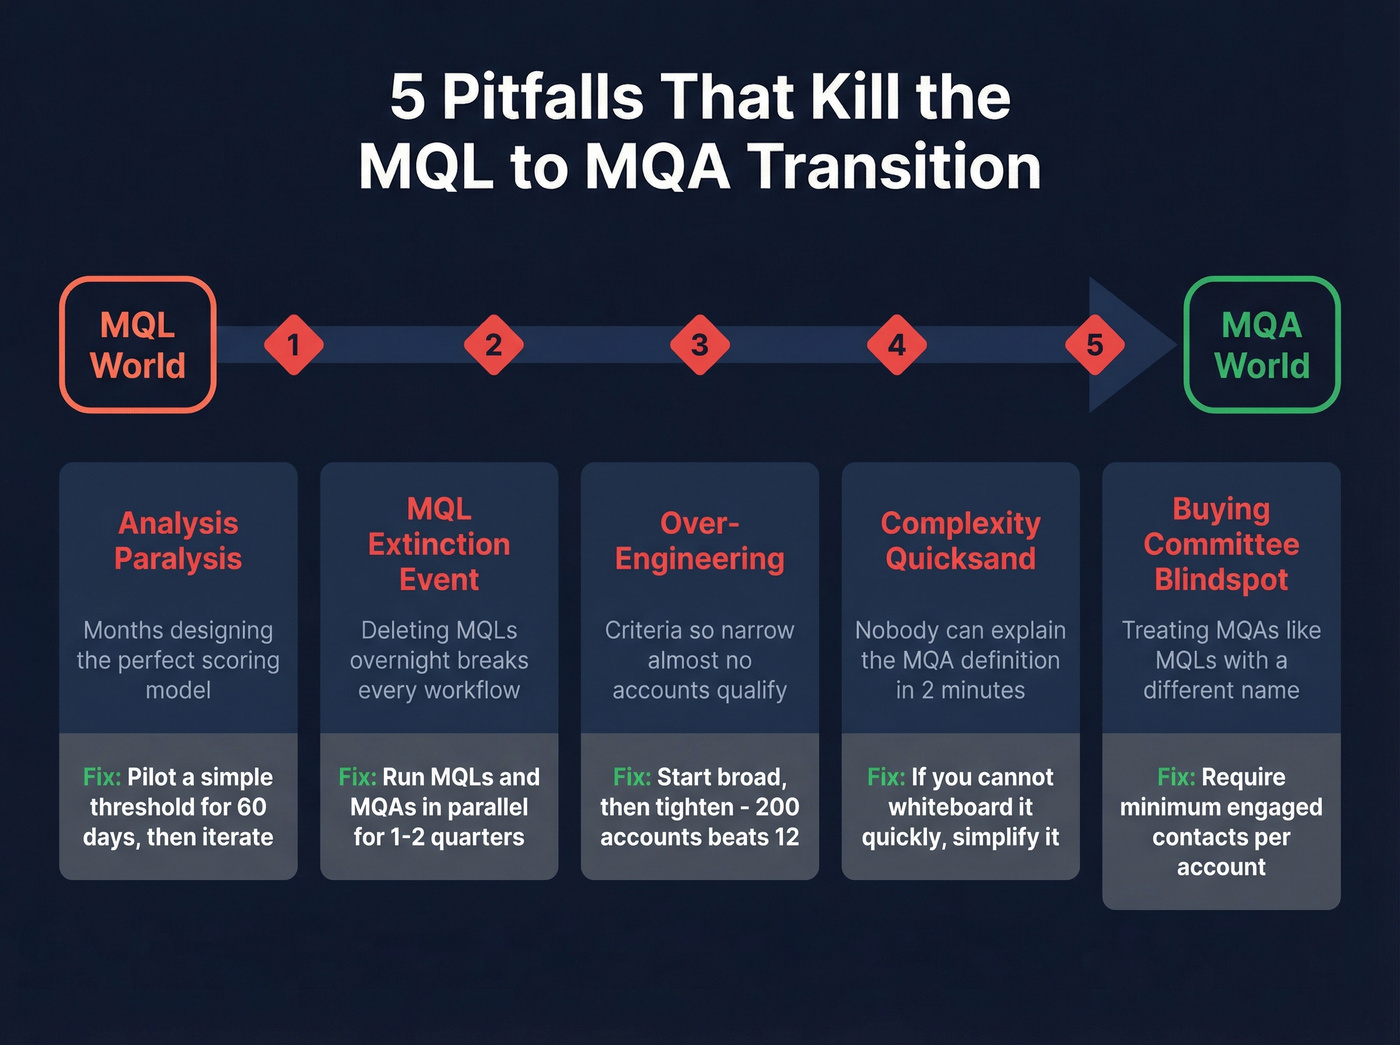
Analysis paralysis hits first. Teams spend months designing the perfect scoring model before testing anything. Instead, pilot with a simple threshold - three or more engaged contacts at an account with an engagement score above X - run it for 60 days, and iterate.
The MQL extinction event comes next. Deleting MQLs overnight breaks every handoff, SLA, and reporting workflow your team has built. Run MQLs and MQAs in parallel for one to two quarters, then phase out MQLs as MQA workflows prove reliable.
Over-engineering is the third killer. When MQA criteria are so narrow that almost no accounts qualify, the model is useless. Start broad, then tighten. A definition that captures 200 accounts per quarter beats one that captures 12.
Complexity quicksand follows closely. If you can't whiteboard the MQA definition in under two minutes, simplify it. RevOps practitioners on Reddit consistently cite the same frustration: leadership wants ROI numbers, but the data infrastructure to produce them is too convoluted for anyone to maintain.
Buying committee blindspot is the most damaging. Teams treat MQAs like MQLs with a different name, still tracking individual contacts instead of buying groups. Require a minimum number of known or engaged contacts per account as a core MQA criterion - that's the single biggest differentiator between lead-based and account-based qualification. (If you need a clean definition, start with account qualification.)
You don't need to solve all five at once. Start with the buying committee requirement and the parallel-run approach. Those two changes alone will move your measurement from lead-centric to account-centric without blowing up existing infrastructure.
Account-Based Attribution
Attribution is where account-level reporting gets genuinely hard. A single deal might involve 50+ touchpoints across 8 contacts over 9 months. AttributionApp's framework breaks implementation into four connected steps.
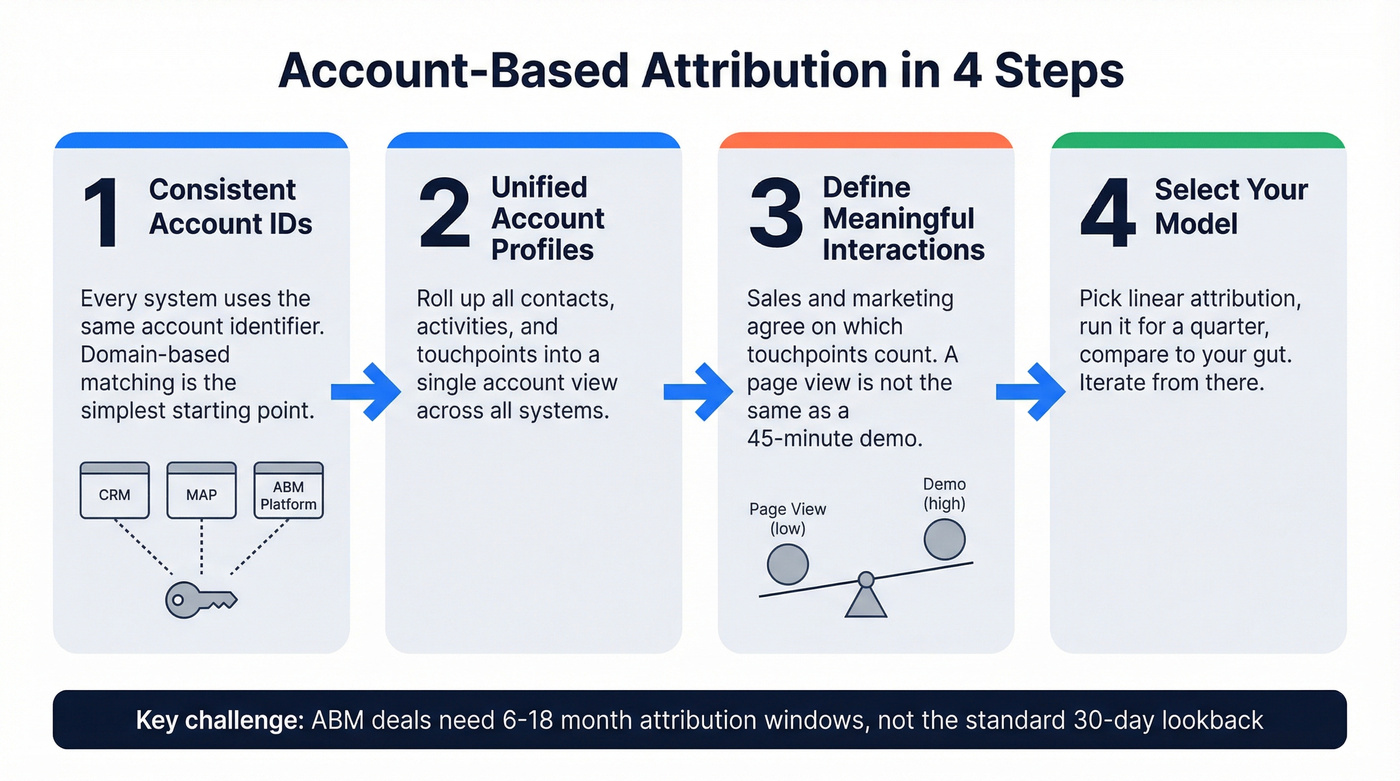
Everything starts with consistent account identifiers. Every system - CRM, MAP, ABM platform, analytics - needs to use the same account ID. Domain-based matching is the simplest starting point. If your CRM uses one ID and your ABM platform uses another, attribution data fragments from day one. From there, you build unified account profiles by rolling up all known contacts, their activities, and their touchpoints into a single account view. This is where most teams get stuck because they have contact-level data in five systems and no clean way to aggregate it.
Before building the model itself, get sales and marketing in a room and agree on which interactions count as "meaningful." A single page view isn't the same as a 45-minute demo. Without this alignment, your attribution model assigns credit to noise. Then select your model - first-touch, last-touch, linear, W-shaped, time-decay. We've watched teams spend entire quarters debating this choice instead of picking one and iterating. Let's be honest: pick linear attribution, run it for a quarter, and compare results to your gut sense of what's working. If the model says your best program is the one nobody believes in, the model is probably wrong.
The real challenge is the 6-18 month attribution window. ABM deals take time, and most attribution tools are built for 30-day conversion windows. HockeyStack builds custom multi-touch attribution designed for account-level reporting with extended lookback windows. It's not cheap, but it's one of the better ways to get accurate attribution on long-cycle deals.
Buying committee coverage is your ABM bottleneck. Prospeo's 300M+ profiles with 30+ filters - including department headcount, job changes, and buyer intent - let you map and verify every stakeholder at your target accounts. 98% email accuracy means your engagement scores reflect real interactions, not bounced messages.
Stop measuring fragments. Map the full buying committee in minutes.
Building ABM Dashboards
A dashboard shows what's happening now. A report explains what happened over a period. You need both, but most teams build reports and call them dashboards.
| Dashboard | Owner | Cadence |
|---|---|---|
| Account Engagement | ABM manager / SDR lead | Weekly |
| Buying Committee Coverage | AEs / Account managers | Weekly |
| Pipeline Velocity & Stage | RevOps / Sales leadership | Weekly pipeline, monthly trend |
| ABM Campaign ROI | Marketing leadership | Monthly |
| Account Health & Retention | CS / Account management | Monthly, quarterly board |
The Account Engagement Overview is your early warning system. It shows engagement score distribution across target accounts, trending engagement by tier, top 10 surging accounts, and channel-level breakdowns. When accounts spike, reps should know immediately.
The Buying Committee Coverage Map drives targeted prospecting by showing coverage percentage per account, engagement depth by persona, and gaps like "we have no contact with procurement at 60% of Tier 1 accounts." The Pipeline Velocity & Stage Progression dashboard is the most operationally useful in the stack - velocity trended over time, stage conversion rates, average time in each stage, and stalled deal alerts. ABM Campaign ROI is what you show leadership: cost per engaged account, pipeline per campaign, influenced revenue by program, channel efficiency. And Account Health & Retention covers post-sale ABM that most teams ignore entirely: NPS by tier, expansion pipeline, churn risk, renewal timelines.
Setting the Right Review Cadence
In our experience, teams that run a single shared dashboard - one that both sales and marketing review together - see alignment improve within a single quarter. Getting the cadence right matters as much as the metrics themselves. Weekly tactical reviews surface operational issues before they compound. Monthly strategic reviews keep leadership informed without drowning them in noise. Quarterly board-level summaries tie everything back to revenue impact. Improvado reports that teams spend 10-20 hours per week on manual reporting; automated dashboards cut that by 80%. If your team is still pulling data into spreadsheets every Monday, fix that before adding more metrics.
Fix Your Data First
None of the metrics or dashboards above matter if your underlying data is garbage. And for most ABM teams, it is.
When 30% of the emails on your target account list bounce, your engagement scores are fiction. Pipeline velocity calculations are skewed because you're missing buying committee members you don't know about. Attribution models assign credit to touches that never reached anyone. Data decay is the silent killer of account-based measurement - contacts change jobs, emails go stale, and the industry average refresh cycle for most providers is six weeks. (If you want benchmarks and a cleanup plan, start with B2B contact data decay.)

Running your target account list through Prospeo's enrichment API before each reporting cycle ensures you're measuring against verified data - 98% email accuracy, an 83% enrichment match rate returning 50+ data points per contact, and a 7-day refresh cycle that keeps records current. Snyk's team of 50 AEs saw bounce rates drop from 35-40% to under 5% after switching, with AE-sourced pipeline up 180%. That's a pipeline story that starts with data quality. (If you're evaluating vendors, compare options in our email ID validator guide.)
ABM Reporting Tool Stack
| Tool | Category | Best For | Approx. Pricing |
|---|---|---|---|
| Prospeo | Data quality | Best data accuracy layer | Free tier; ~$0.01/email |
| 6sense | ABM platform | Best if budget > $50K/yr | ~$55K+/yr |
| Demandbase | ABM platform | Best journey-stage analytics | ~$18K+/yr |
| HubSpot Marketing Hub | CRM + ABM | Best mid-market all-in-one | From $800/mo |
| HockeyStack | Attribution | Best multi-touch attribution | ~$2,200/mo |
| Salesforce | CRM foundation | Best pipeline infrastructure | $25-$300/user/mo |
| RollWorks | ABM ads + reporting | Best SMB entry point | ~$15K-$30K/yr |
Skip 6sense unless you have enterprise budget and a dedicated ops person. Its predictive models and intent-driven analytics are best-in-class, but expect 2-3 months before you get clean insights. Demandbase is the better choice if your primary need is understanding how accounts move through buying stages - its journey visualization is genuinely unmatched, and it starts around $18K/year for smaller teams.
For most mid-market teams, I'd point to HubSpot Marketing Hub. Its ABM features have matured significantly - account-level reporting, target account dashboards, and buying role tracking are all native now. It won't match 6sense on intent depth, but at $800/mo it covers 80% of what most teams need. HockeyStack, RollWorks, and Salesforce round out the stack for attribution, ABM ads, and CRM infrastructure respectively. (If you're deciding between platforms, see HubSpot vs Salesforce.)
Recommended stacks:
- Enterprise: Demandbase or 6sense + HockeyStack + Salesforce
- Mid-market: HubSpot Marketing Hub + a BI tool like Looker or Tableau
- SMB: HubSpot free or Salesforce Essentials + spreadsheet dashboards
7 Common Measurement Mistakes
1. Tracking MQLs instead of MQAs. If your ABM dashboard still has an MQL count, replace it with account-level qualification metrics - engagement score thresholds and buying committee coverage minimums.
2. Ignoring data quality. Run your target account list through a verification tool before every reporting cycle. A weekly refresh cycle prevents the phantom engagement problem where you're measuring against partially dead contact lists.
3. Attribution model paralysis. Pick linear attribution, run it for 90 days, and adjust. A slightly wrong model beats no model every time.
4. Engagement without pipeline overlay. An engagement score that doesn't correlate with pipeline creation is a vanity metric. Every engagement dashboard should show whether highly engaged accounts actually convert.
5. No buying committee coverage tracking. If you don't know how many stakeholders you've engaged at each account, you're guessing at deal health. Add a coverage percentage to every account record in your CRM.
6. Wrong review cadence. Strategic dashboards reviewed daily create noise. Tactical dashboards reviewed quarterly miss signals. Weekly for ops, monthly for leadership, quarterly for the board.
7. Siloed reporting. Marketing shows engagement. Sales shows pipeline. Nobody shows the connection. Build one shared dashboard that both teams review together. Alignment isn't a culture problem - it's a reporting problem.
Every ABM formula on this page breaks when your contact data decays. Prospeo refreshes all 300M+ records every 7 days - not the 6-week industry average. That means your pipeline velocity, stage conversions, and ROI calculations stay grounded in reality, not stale CRM records.
Clean data in, accurate ABM reporting out. Starting at $0.01 per email.
ABM Reporting FAQ
What is ABM reporting?
Account-level performance tracking that measures how target accounts engage, progress through buying stages, and convert to revenue. It replaces lead-centric MQL metrics with account-centric measures like engagement scores, pipeline velocity, and buying committee coverage.
What are the most important ABM metrics?
Pipeline velocity, account engagement score, buying committee coverage, stage conversion rates, and ABM ROI. Focus on 5-7 metrics you can calculate with formulas and defend to your CFO - every one should connect to pipeline or revenue.
How do you measure ABM ROI?
ABM ROI = (Revenue from ABM accounts - ABM program cost) / ABM program cost x 100. Track over 6-18 months since ABM sales cycles run longer than demand gen. Include both new and expansion revenue.
What tools do you need for account-based measurement?
At minimum: a CRM like Salesforce or HubSpot, a data quality tool for verified contacts, and a BI layer for dashboards. Enterprise teams add platforms like 6sense or Demandbase and dedicated attribution tools like HockeyStack.
How often should you review ABM dashboards?
Tactical dashboards weekly, strategic dashboards monthly, board-level summaries quarterly. Match cadence to the stakeholder's decision-making cycle - daily reviews of strategic metrics create noise, not insight.