Stop Scoring Leads. Start Scoring Accounts. Here's How.
Your SDR gets 50 "hot leads" from marketing this morning. Eight are individual contributors who downloaded a whitepaper. The VP of Engineering who visited your pricing page three times last week? Not in the system - she never filled out a form. This is the MQL failure mode, and it's why ABM lead scoring is so often misunderstood. Most implementations fail because they score people instead of accounts.
What you actually need: ABM scoring works at the account level, fed by lead-level inputs - firmographic fit, buying committee engagement, and intent signals rolled up into a single account score. The scoring rubric in Section 4 is the one to bookmark, and the AI workflow in Section 6 is the fastest path to getting this operational. Skip clean data, and you're just assigning arbitrary points to noise.
Why ABM Scoring Starts with the MQL Problem
82% of B2B teams have adopted ABM, but most still measure success by counting MQLs. That's like buying a sports car and judging it by trunk space.
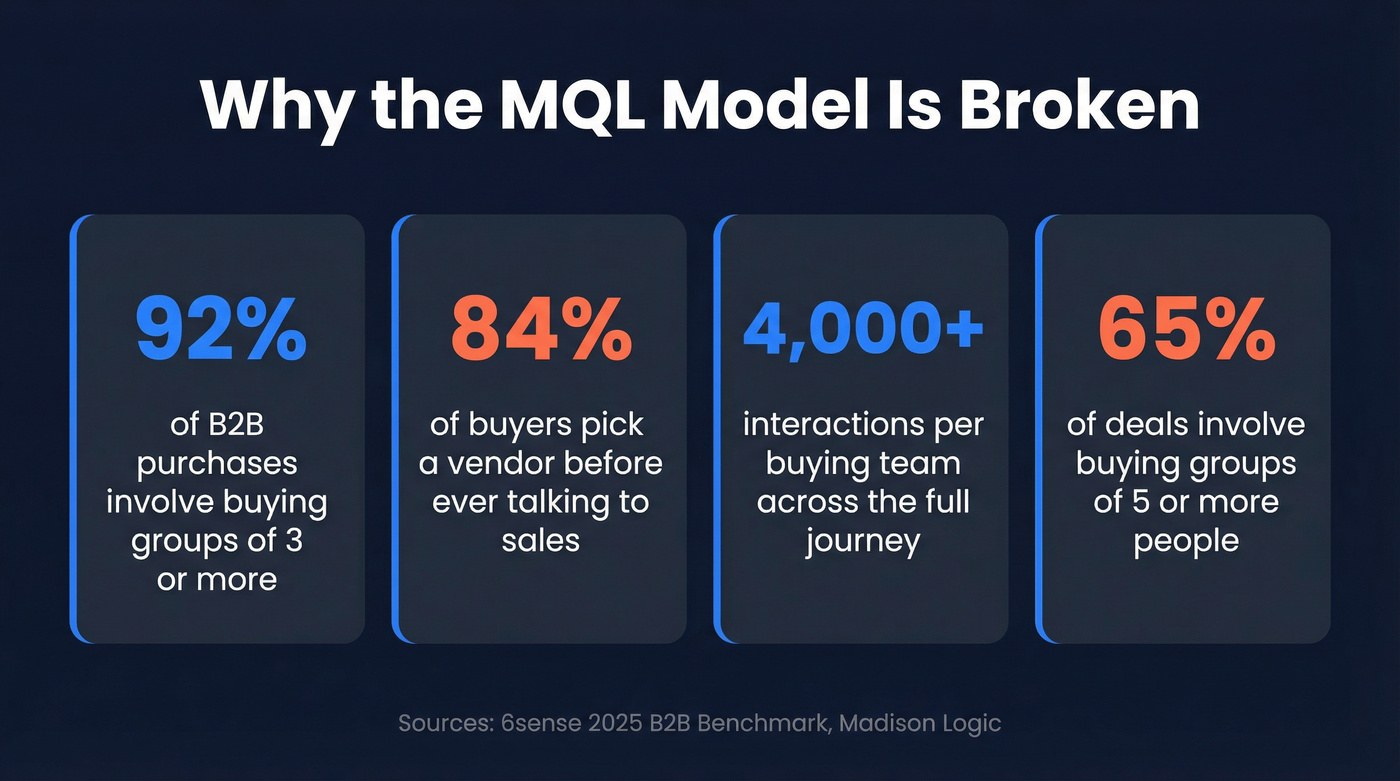
Buying behavior has shifted underneath the old scoring model. 92% of B2B purchases involve buying groups of three or more, and 65% involve groups of five-plus. Worse, 84% of buyers have already selected a preferred vendor before they ever talk to your sales team - contact happens more than two-thirds through the journey.
So when your scoring model gives 50 points to someone who downloaded a PDF, you're not identifying a buyer. You're identifying someone who reads PDFs. The actual decision-maker - the one who's been researching your category for weeks - might never trigger a single form-fill event. Your model needs to find her anyway.
Why Traditional Lead Scoring Breaks in ABM
Traditional lead scoring was built for a world where one person fills out a form, gets nurtured, and eventually buys. That world doesn't exist in enterprise B2B.
Influ2 documented a pattern we've seen repeatedly: ABM-generated MQLs skew heavily toward individual contributors with low decision power. The people with actual buying authority - Directors and above - don't fill out forms. They don't attend webinars. They read your pricing page at 11pm and never leave a trace in your MAP. One marketer admitted their MQL conversion rate was actually lower than cold prospects. Teams that reframe marketing's role as "air cover" - warming decision-makers and surfacing intent signals across the buying committee - report 1.5x-3x improvement in cold prospecting conversion rates.
A typical buying team generates 4,000+ interactions across the journey. Your scoring model needs to capture that breadth, not just the handful of interactions that happen to hit a landing page.
The problems stack up fast. Individual scoring misses the committee - one champion with a high score doesn't mean the account is ready. Engagement scoring rewards the wrong people, because the intern who clicks everything outscores the CFO who reads one email. And static models decay. RevOps practitioners in communities like RevGenius consistently complain about inheriting scoring models built by someone who left the company six months ago, where nobody remembers what "+8 for webinar attendance" was supposed to mean.
Lead Scoring vs. Account Scoring
These terms get used interchangeably, but they're fundamentally different.
| Dimension | Lead Scoring | Account Scoring |
|---|---|---|
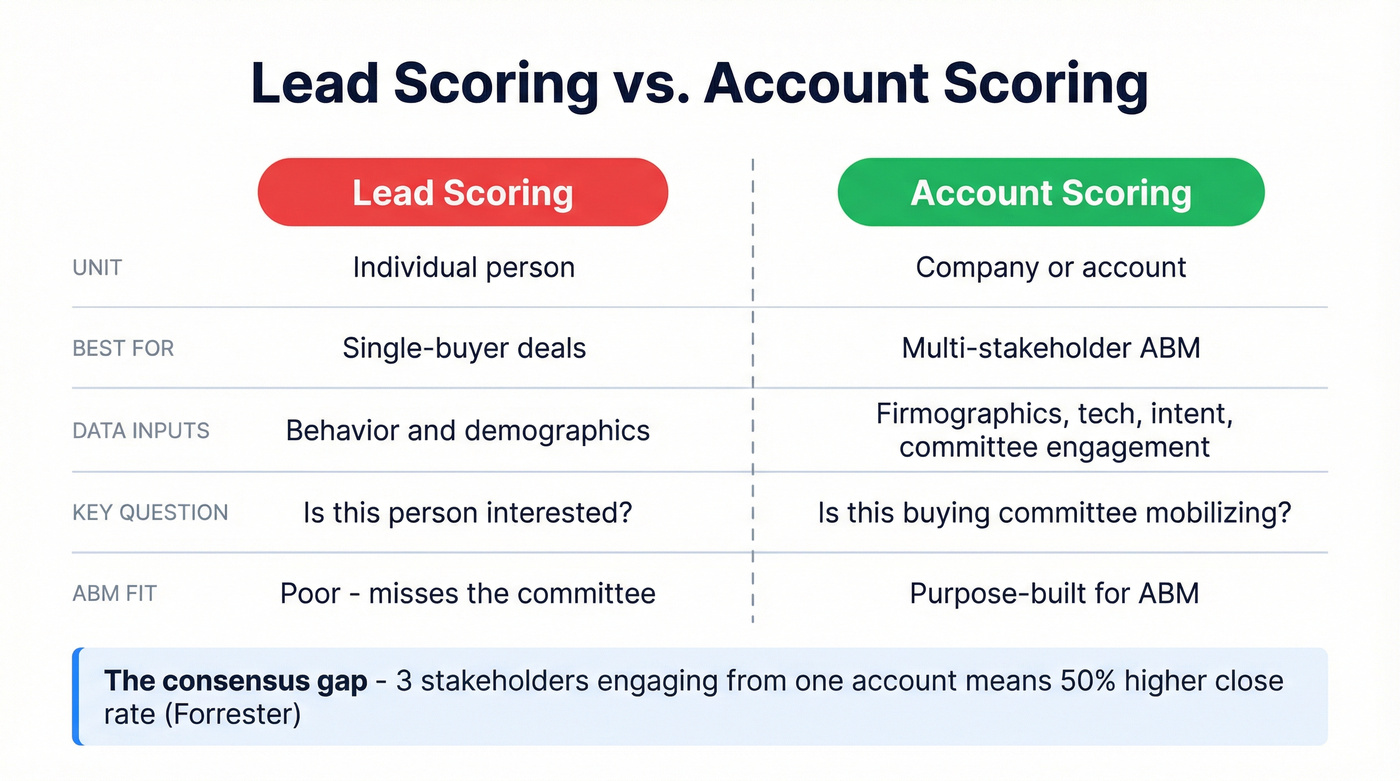
| Unit | Individual person | Company/account |
| Best for | Single-buyer deals | Multi-stakeholder ABM |
| Data inputs | Behavior, demographics | Firmographics, tech, intent, committee engagement |
| ABM fit | Poor | Purpose-built |
Lead scoring asks: "Is this person interested?" Account scoring asks: "Is this company a good fit, and is their buying committee mobilizing?"
Madison Logic calls the gap between these two the "consensus gap" - the difference between individual interest and collective alignment. You can have a single champion scoring 95 while the rest of the buying committee hasn't engaged at all. That account isn't ready. Three mid-level stakeholders each scoring 40, though? That might signal a deal that's actually moving. Forrester client data backs this up: when three stakeholders from the same company engage, you're 50% more likely to convert the opportunity to closed-won.
How to Build Your ABM Scoring Model
This is the operational core. We're expanding xGrowth's 3-step framework into five steps that get you from zero to a working model. One note: the rubric below is built for acquisition scoring (net-new accounts). If you're scoring expansion opportunities with existing customers, your parameters will differ.
Define Your ICP and Scoring Parameters
Before assigning points, define what you're scoring against. Your parameters fall into five categories:
- Firmographic: industry, employee count, revenue, HQ location, funding stage
- Demographic: job title, seniority, department, role in buying committee
- Behavioral: page visits, content downloads, demo requests, email engagement
- Intent: topic surge data, competitor research signals, review site activity
- Negative: disqualifying signals that subtract points
Every parameter needs to map back to your closed-won data. If 80% of your deals come from companies with 100-500 employees in SaaS, that's a +10 signal. Never closed a deal in manufacturing? That's a -15.
The Complete Scoring Rubric
This is the table worth bookmarking. Adapt the point values to your business, but this gives you a working starting point.
Fit Signals
| Signal | Points | Rationale |
|---|---|---|
| C-suite title | +20 | Decision-maker access |
| Director / VP | +15 | Senior influence |
| Manager | +8 | Mid-level stakeholder |
| Individual contributor | +3 | End-user signal |
| Target industry | +15 | ICP alignment |
| 100-500 employees | +10 | Sweet-spot company size |
| Uses competitor tech | +10 | Active category buyer |
Engagement Signals
| Signal | Points | Rationale |
|---|---|---|
| Demo request | +25 | Highest-intent action |
| Pricing page visit | +15 | Active evaluation |
| Content download | +5 | Mid-funnel interest |
| Webinar attendance | +8 | Mid-funnel interest |
| Email open | +2 | Low-intent, high-volume |
Intent Signals
| Signal | Points | Rationale |
|---|---|---|
| High-surge topic (aligned) | +20 | Active category research |
| Moderate surge | +10 | Early-stage interest |
Negative Signals
| Signal | Points | Rationale |
|---|---|---|
| Competitor employee | -30 | Not a prospect |
| Student email (.edu) | -25 | Not a buyer |
| Wrong geography | -15 | Outside serviceable market |
Worked example: Acme Corp - 200 employees, SaaS industry, uses a competitor's tool. Four contacts have engaged:
- VP of Sales (decision-maker): visited pricing page, attended webinar. Score: +15 + +15 + +8 = 38
- Director of RevOps (influencer): requested demo. Score: +15 + +25 = 40
- SDR Manager (end-user): opened two emails. Score: +8 + +4 = 12
- Marketing Coordinator (end-user): downloaded whitepaper. Score: +3 + +5 = 8
Account-level fit signals: +15 (industry) + +10 (size) + +10 (competitor tech) = +35.
Weight Categories and Set Thresholds
For a clean starting point on weighting, xGrowth's example for existing-account expansion scoring uses: Buying signals 30%, Opportunity revenue potential 25%, Access to decision makers 20%, Customer satisfaction 15%, Strategic importance 10%. For acquisition scoring, use that structure, then tune the weights to match what actually predicts closed-won in your data.
Set tier thresholds on a 0-100 normalized scale:
- Tier 1 (70-100): Sales-ready. Handoff SLA: under 4 hours.
- Tier 2 (40-69): Nurture with targeted content. Handoff SLA: under 24 hours.
- Tier 3 (0-39): Automated nurture sequence. No direct sales touch.
Buying Committee Roll-Up
Individual scores need role-weighted aggregation. Decision-makers get a 1.5x multiplier, influencers 1.0x, and end-users 0.5x.
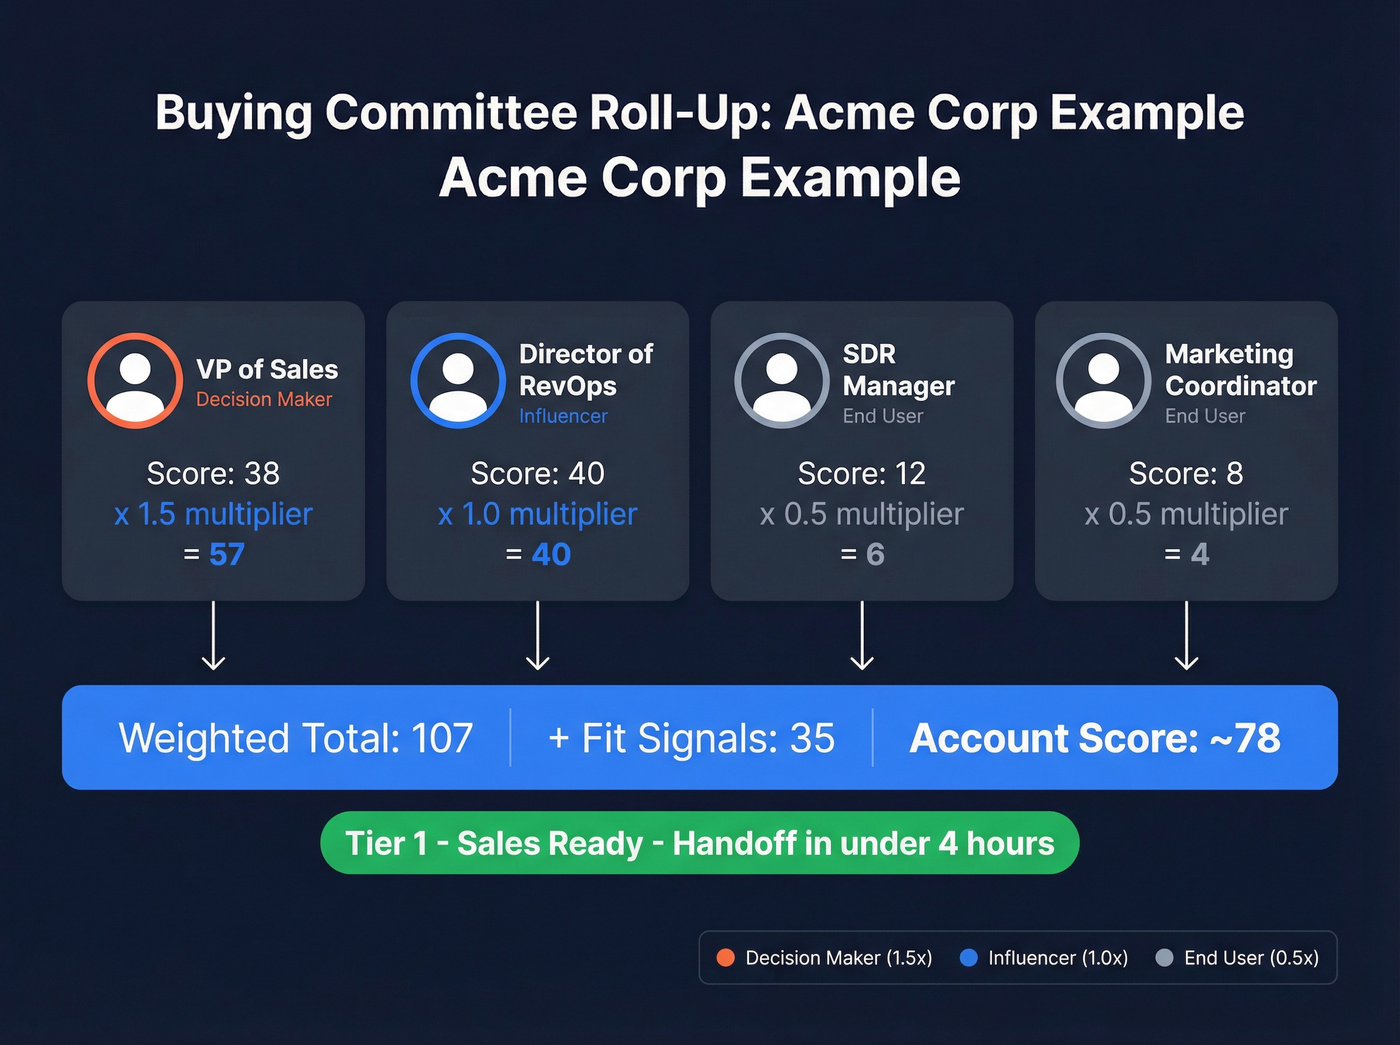
Back to Acme Corp: VP of Sales (38 x 1.5 = 57), Director of RevOps (40 x 1.0 = 40), SDR Manager (12 x 0.5 = 6), Marketing Coordinator (8 x 0.5 = 4). Weighted individual total: 107. Normalize to 0-100 and add weighted fit signals. Acme Corp lands at roughly 78 - a solid Tier 1 account.
Your ABM scoring model collapses when contact data is wrong. Prospeo's 300M+ profiles with 98% email accuracy and 125M+ verified mobiles mean your buying committee data is real - not stale records from six weeks ago. Layer in intent data across 15,000 Bombora topics to fuel the surge signals your rubric needs.
Stop scoring noise. Start scoring accounts with data refreshed every 7 days.
Intent Data in Your Scoring Model
Intent data tells you which accounts are actively researching your category before they ever visit your site. It's the difference between scoring what happened and scoring what's happening right now.
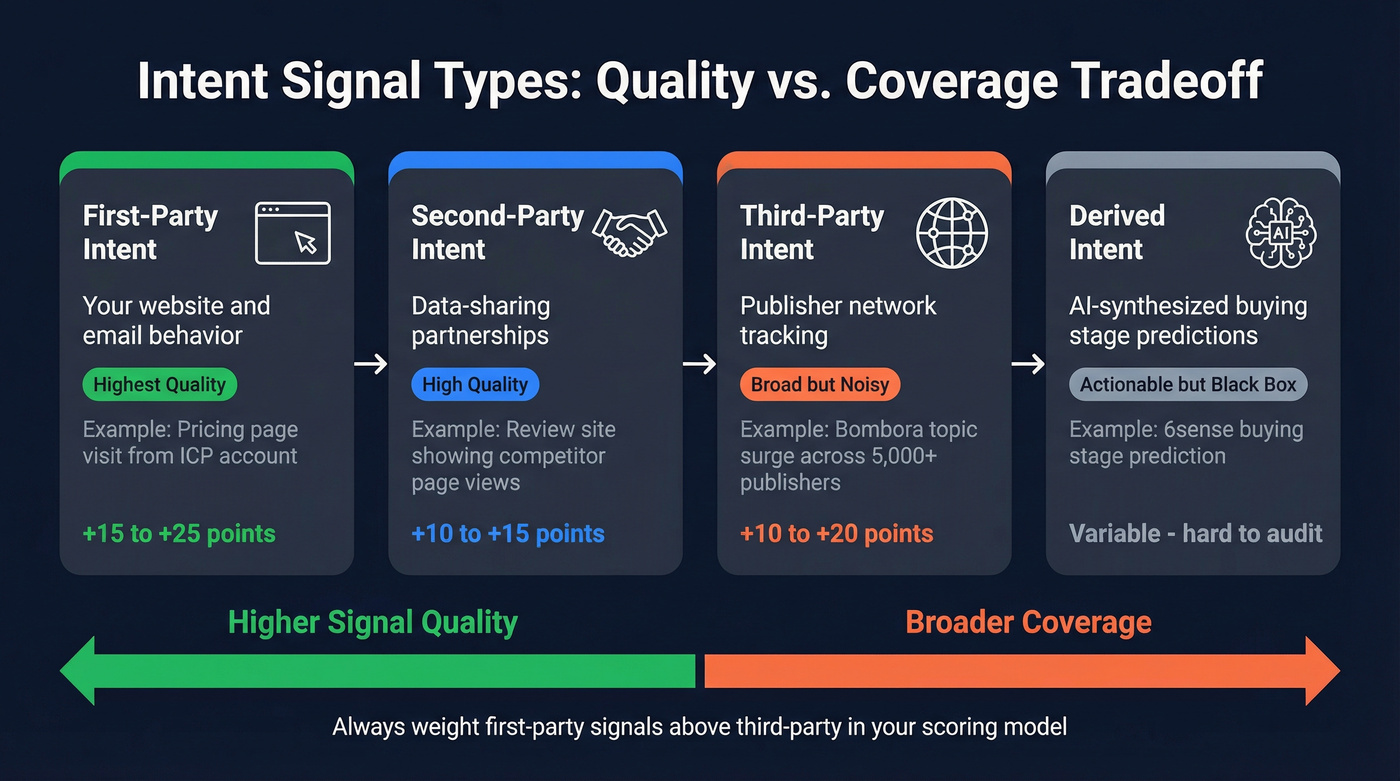
Signal Types
First-party intent is your own website and email behavior. Highest quality, but limited to accounts that already know you exist. A pricing page visit from an ICP account is the strongest signal in your model.
Second-party intent comes from data-sharing partnerships - a review site sharing who's reading your competitor's page, for example.
Third-party intent tracks content consumption across publisher networks. Bombora tracks consumption across its 5,000+ B2B publisher network. Broad coverage, but noisier - matching an anonymous IP to a company isn't perfect.
Derived intent is where AI platforms like 6sense synthesize multiple sources into buying-stage predictions. The output is actionable, but it's a black box. You can't audit what you can't see, and that's a real risk when your scoring model depends on it.
What Intent Data Actually Costs
Intent data vendors love to say "custom pricing." Here's what that actually means:
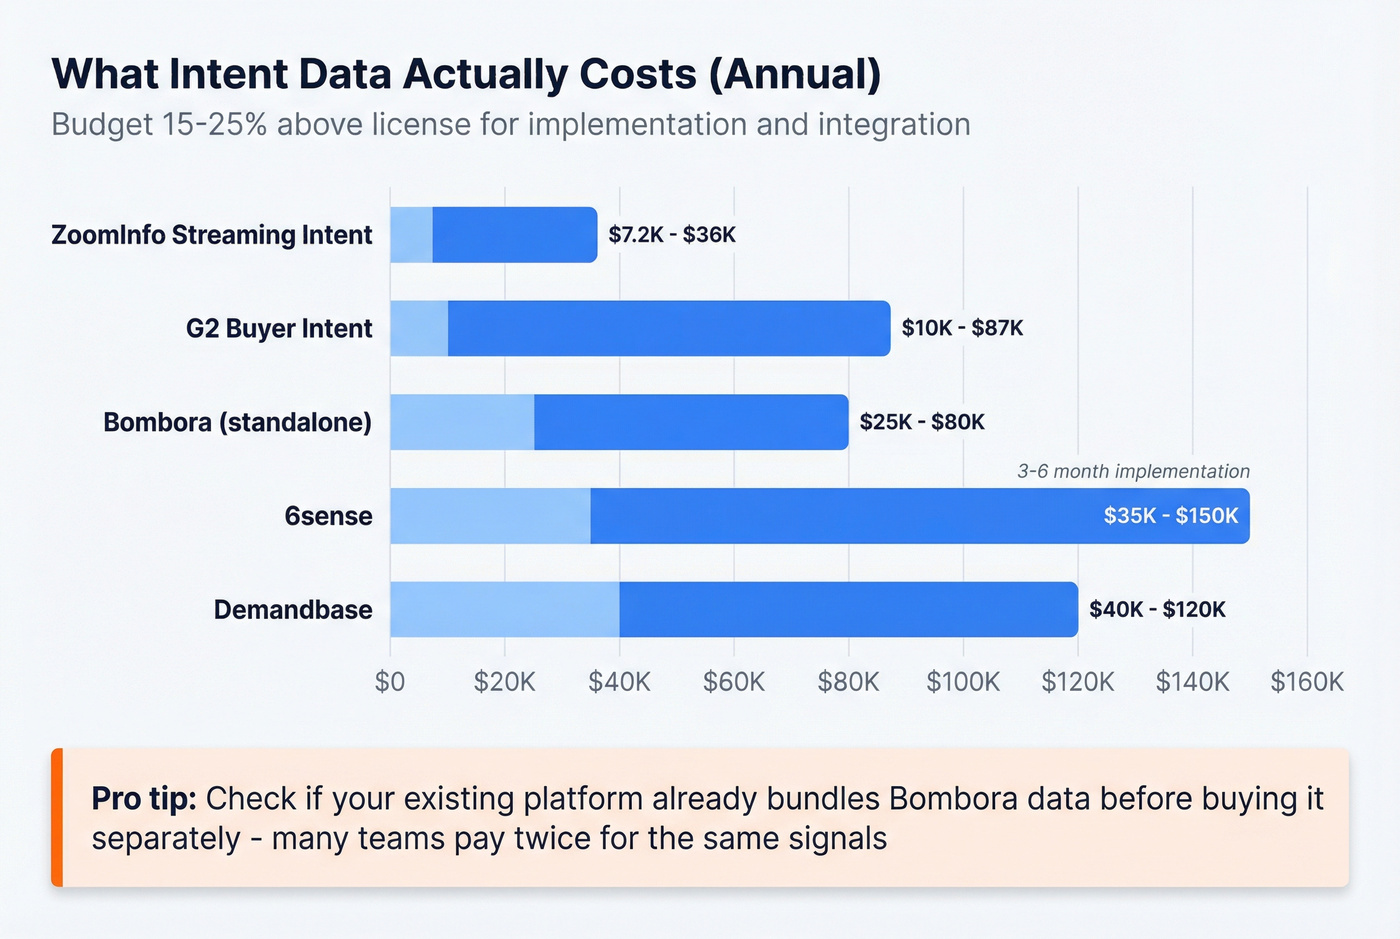
| Vendor | Annual Cost | Notes |
|---|---|---|
| ZoomInfo Streaming Intent | $7,200-$36,000 | Part of broader contract |
| G2 Buyer Intent | $10,000-$87,000+ | Varies by tracked categories |
| Bombora (standalone) | $25,000-$80,000 | Often bundled w/ 6sense |
| 6sense | $35,000-$150,000+ | 3-6 month implementation |
| Demandbase | $40,000-$120,000 | Enterprise; incl. orchestration |
Budget 15-25% above the license cost for implementation, topic configuration, and CRM integration. And check whether your existing platform already bundles Bombora data before buying it separately - many teams are paying twice for the same signals.

How to Weight Intent Signals
A high-surge topic aligned to your product category earns +20 in your model. Moderate surge gets +10. But first-party intent should always outweigh third-party - a pricing page visit from an ICP account is worth more than a third-party surge signal, because you know exactly who did it and what they looked at.
If you want a deeper framework for keyword- and topic-level scoring, start with intent keywords and build your taxonomy from there.
Here's the thing: if your average deal size is under $15K, you probably don't need a $25K+ standalone intent data contract. First-party signals plus a platform that bundles Bombora-powered intent data across 15,000 topics will get you 80% of the way there at a fraction of the cost. Intent alone isn't enough anyway. An account surging on "CRM software" but with 12 employees and no budget isn't Tier 1. Intent must combine with fit.
AI-Powered Scoring vs. Rule-Based
Rule-based scoring works when you have fewer than 50 closed-won deals, a simple ICP, or you're just getting started. Build the rubric from Section 4, run it in a spreadsheet, and iterate.
For everyone else, AI scoring is faster, more accurate, and easier to maintain. Let's be honest: manual point systems are guesswork codified. AI scoring against closed-won patterns finds signals humans miss - like the correlation between a company's hiring velocity and their likelihood to buy your product.
The AI Scoring Workflow
Here's the practical workflow from CXL, adapted for 2026 tooling:
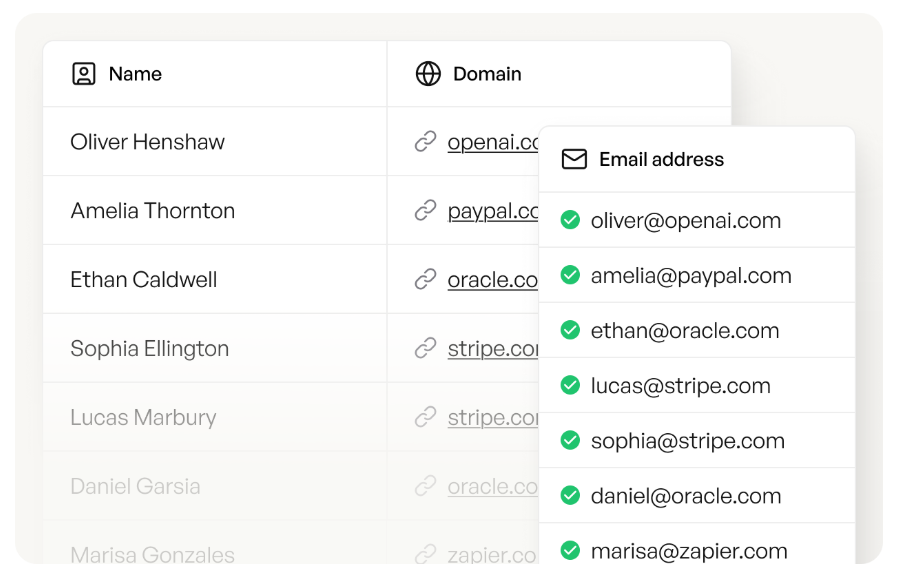
- Export enriched account data to CSV. Use Prospeo's enrichment API (92% match rate, 50+ data points per contact), Clay, or Apollo. Your model's output is only as good as its input - garbage enrichment produces garbage scores.
- Upload to ChatGPT or Claude with a prompt framework: "Score each account 0-100 on fit to buy [your product]. Return fit score, confidence level, and top 3 drivers."
- Generate fit score + confidence + top drivers per account. The LLM will find patterns across your enrichment fields - industry, headcount, tech stack, hiring trends, funding stage.
- Tier accounts: 70-100 (Tier 1), 40-69 (Tier 2), 0-39 (Tier 3). Demandbase uses slightly different bands - 95+ Highly Likely, 50+ Likely, under 50 Unlikely - pick whichever maps to your sales capacity.
- Attach plays by tier. Tier 1 gets direct outreach within 4 hours. Tier 2 gets a targeted nurture sequence. Tier 3 goes into automated drip.
Batch-test on 10-20 accounts first. Spot-check the enrichment data before scaling - one bad field like a wrong industry classification or outdated headcount can skew scores across hundreds of accounts.
If you want to automate the ops side (routing, enrichment, and logging), pair this with AI CRM data entry automation.
Data Quality: The Part Everyone Skips
Garbage data produces garbage scores. This isn't a platitude - it's the #1 reason scoring models fail in production.
We've seen teams invest $50K+ in intent data platforms and then feed them contact lists with 30% bounce rates. The intent signals were right. The data underneath was wrong. In six weeks, people change jobs, companies get acquired, phone numbers go dead. If your scoring model runs on stale data, you're making decisions based on last quarter's org chart.
Snyk's team of 50 AEs experienced this firsthand - bounce rates of 35-40% were undermining their entire outbound motion. After switching to a 7-day data refresh cycle with 98% email accuracy via Prospeo, they cut bounce rates to under 5% and saw AE-sourced pipeline jump 180%. That's what happens when your scoring model runs on data that reflects reality instead of outdated records.
If you’re seeing decay like this, it’s usually a B2B contact data decay problem first, and a scoring problem second.
You don't need a $100K tech stack. A spreadsheet, verified data, and an LLM can outperform a six-figure ABM platform if your data is clean. The scoring model is the easy part. Getting accurate, fresh data into it is where most teams fall down.
Rolling up engagement across a buying committee requires knowing who's actually on it. Prospeo's 30+ search filters - including department headcount, job changes, and technographics - let you map entire buying groups at target accounts. At $0.01 per email, enriching every stakeholder costs less than one bad MQL.
Map the full buying committee for less than the cost of a single wasted lead.
Operationalizing Your Scores
A scoring model that lives in a spreadsheet is a science project. Here's the checklist to make it operational:
- Pick your CRM. HubSpot works for SMB teams with its native scoring. Salesforce is the move for mid-market and enterprise, especially with Flow-based automation for tier-based routing.
- Set handoff SLAs. Tier 1: sales touches within 4 hours, no exceptions. Tier 2: assigned within 24 hours with a targeted content sequence. Tier 3: automated nurture only until the score changes.
- Backtest quarterly. Compare conversion rates by tier against last quarter's closed-won deals. If Tier 2 accounts close at the same rate as Tier 1, your thresholds are wrong. If Tier 3 converts better than Tier 2, your scoring parameters are broken.
- Document everything. Calibrate against real outcomes, not assumptions. Watch for model drift - review point values and weights every quarter.
If you need a governance layer (owners, change logs, and versioning), use a lightweight RevOps lead scoring process so the model doesn’t die when one operator leaves.
The best ABM lead scoring model in the world is worthless if nobody follows the SLAs. Get sales leadership to sign off on the handoff rules before you launch. Skip this step, and I guarantee you'll be debugging "why aren't reps working Tier 1 accounts?" three months from now.
ABM Lead Scoring FAQ
What's the difference between lead scoring and account scoring?
Lead scoring ranks individual people by behavior and demographics. Account scoring ranks companies by aggregating signals across multiple contacts, firmographic fit, and intent data. ABM requires account scoring because B2B purchases involve buying committees of 3-10 people - scoring individuals in isolation misses the collective buying motion that predicts closed-won deals.
How often should you recalibrate your scoring model?
Recalibrate quarterly at minimum by backtesting tier thresholds against the previous quarter's closed-won and closed-lost deals. If Tier 1 accounts aren't converting at meaningfully higher rates than Tier 2, your weights or thresholds need adjustment. Markets shift, ICPs evolve, and scoring models decay faster than most teams realize.
Can you do ABM scoring without expensive intent data?
Yes. First-party intent like pricing page visits, demo requests, and email engagement is free and higher quality than third-party signals. Start there. Layer third-party intent on top of fit scoring as budget allows, not instead of it. For teams with deal sizes under $15K, a standalone $25K+ intent contract rarely makes financial sense.
What's the biggest reason ABM scoring models fail?
Bad data. Teams invest in sophisticated scoring logic but feed it contact lists with 30%+ bounce rates and outdated job titles. A 7-day data refresh cycle - versus the 6-week industry average - is the single highest-leverage fix. Clean, verified data makes even a simple scoring rubric outperform a complex model running on stale records.