How to Prioritize ABM Accounts: A Scoring Model That Actually Works
Your SDRs start calling Tier 1 accounts on Monday. By Wednesday, 30% of the emails have bounced and half the phone numbers connect to front desks. The prioritization model was perfect on paper - but the data underneath it was stale, and now your best accounts are getting the worst experience.
That's the ABM account prioritization problem in a nutshell: great strategy, terrible execution. Gartner found that structured account prioritization drives a 28% increase in overall account engagement, and businesses attribute 77% of revenue growth to their ABM programs. None of that matters if you can't actually reach the accounts you've prioritized.
What You Need (Quick Version)
You need four things to prioritize target accounts well. First, a weighted scoring model with numeric thresholds - not a vague "high/medium/low" label. Second, intent data layered on top of firmographics so you're chasing accounts that are actually in-market. Third, verified contact data so your reps can reach Tier 1 accounts without burning through bounced emails. Fourth, a governance cadence that keeps the list alive instead of letting it rot in a spreadsheet for six months.
You don't need an enterprise ABM platform to start. A spreadsheet, a CRM, and a solid data quality tool will get you 80% of the way there.
What Account Prioritization Actually Means
Account prioritization is the process of ranking your target accounts by fit, intent, and engagement - then allocating resources proportionally. Tier 1 gets the white-glove treatment. Tier 3 gets programmatic air cover. Simple concept, but most teams get it wrong in one of three ways:
- They target the wrong accounts. Marketing builds the list without sales input, or they treat ABM like scaled demand gen with 2,000 "priority" accounts and zero personalization. If your ICP definition lives in one person's head, your list is already broken.
- Sales and marketing stay misaligned. Different KPIs, different definitions of success, and the ABM initiative gets treated as an experiment nobody owns.
- They score leads instead of buying groups. One person downloading a whitepaper triggers a flurry of outreach while nobody notices that three other stakeholders at the account went completely dark. Forrester put hard numbers on this: shifting from MQLs to a buying-group process produced a 200% increase in win rates and 800% increase in opportunity progression.
Build Your Scoring Model
Pick Your Scoring Criteria
Every account scoring model needs five categories of signal. Firmographic data covers the basics - industry, revenue, employee count, geography. Technographic signals tell you whether the account runs a tech stack compatible with your product; Wappalyzer data and job postings are two of the best sources here. Intent signals capture topic surges, competitor research, and pricing page visits.
Engagement tracks direct interactions with your brand: email opens, webinar attendance, content downloads. Relationship signals account for existing champions, past customers, or warm intros that shorten the sales cycle. This includes champion job changes - when a former buyer moves to a new company, that account should immediately spike in your scoring model.
Assign Weights and Score
Here's a scoring model that works as a starting point for most B2B teams. Adjust the weights based on your sales cycle and data availability, but don't start from scratch. And don't treat this as a one-time exercise. Scores should recalculate weekly as new intent and engagement data flows in.
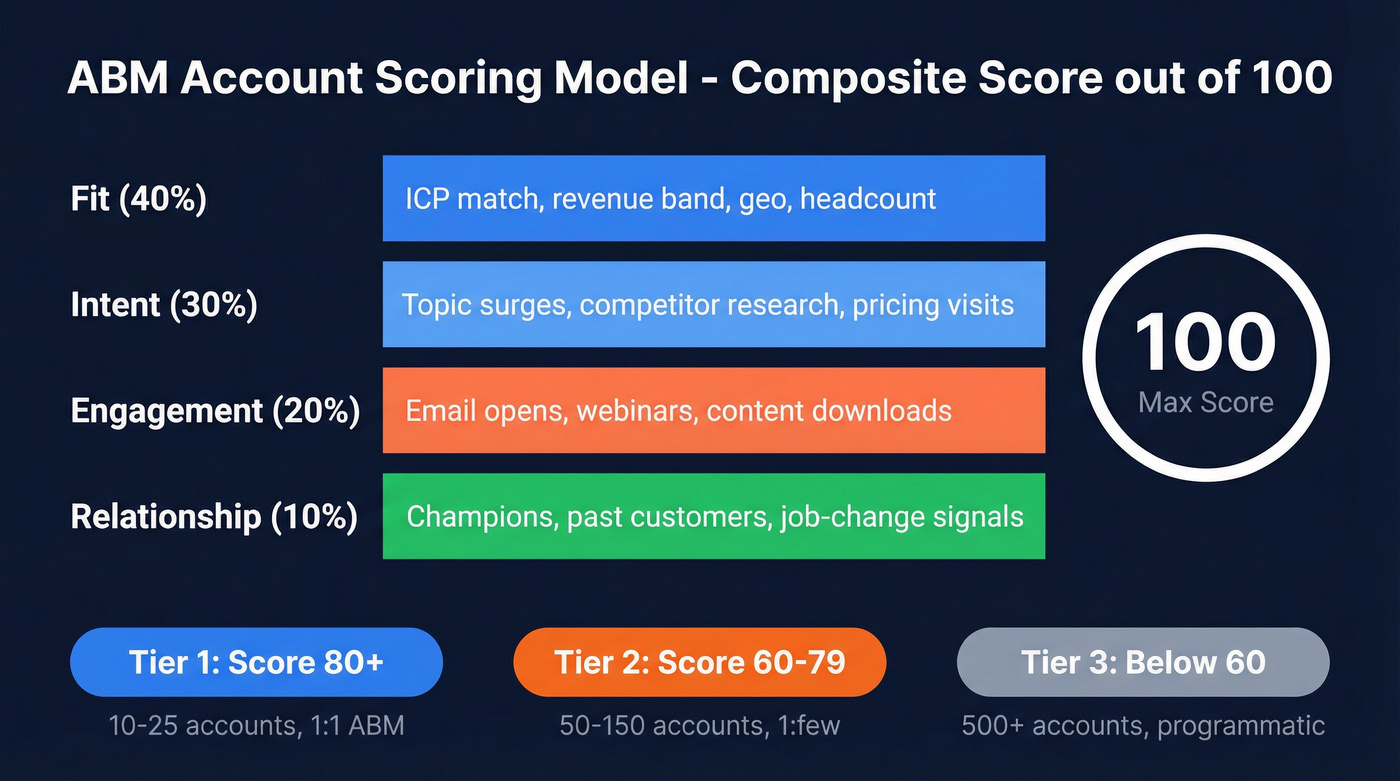
| Parameter | Weight | Example Sub-Criteria | Score Range |
|---|---|---|---|
| Fit | 40% | ICP match, revenue band, geo, employee count | 0-40 |
| Intent | 30% | Topic surges, competitor research, pricing visits | 0-30 |
| Engagement | 20% | Email opens, webinar attendance, content downloads | 0-20 |
| Relationship | 10% | Existing champion, past customer, job-change signal | 0-10 |
Each account gets a composite score out of 100. The tier cutoffs: 80+ = Tier 1, 60-79 = Tier 2, below 60 = Tier 3. Score each sub-criterion on a 1-5 scale, multiply by the category weight, and sum. It takes about 30 minutes to set up in a spreadsheet and saves months of misallocated effort.
One insight from xGrowth's scoring framework worth stealing: use different parameter sets for prospective accounts versus existing-account expansion. An expansion model should weight customer satisfaction and opportunity revenue potential more heavily than firmographic fit - you already know they're a fit.
Map Execution by Tier
Tier 1 is around 10-25 accounts for true 1:1 ABM. These get a dedicated marketing contact, a named SDR, fully custom content and outreach. If your Tier 1 has 200 accounts, you don't have tiers. You have a list.
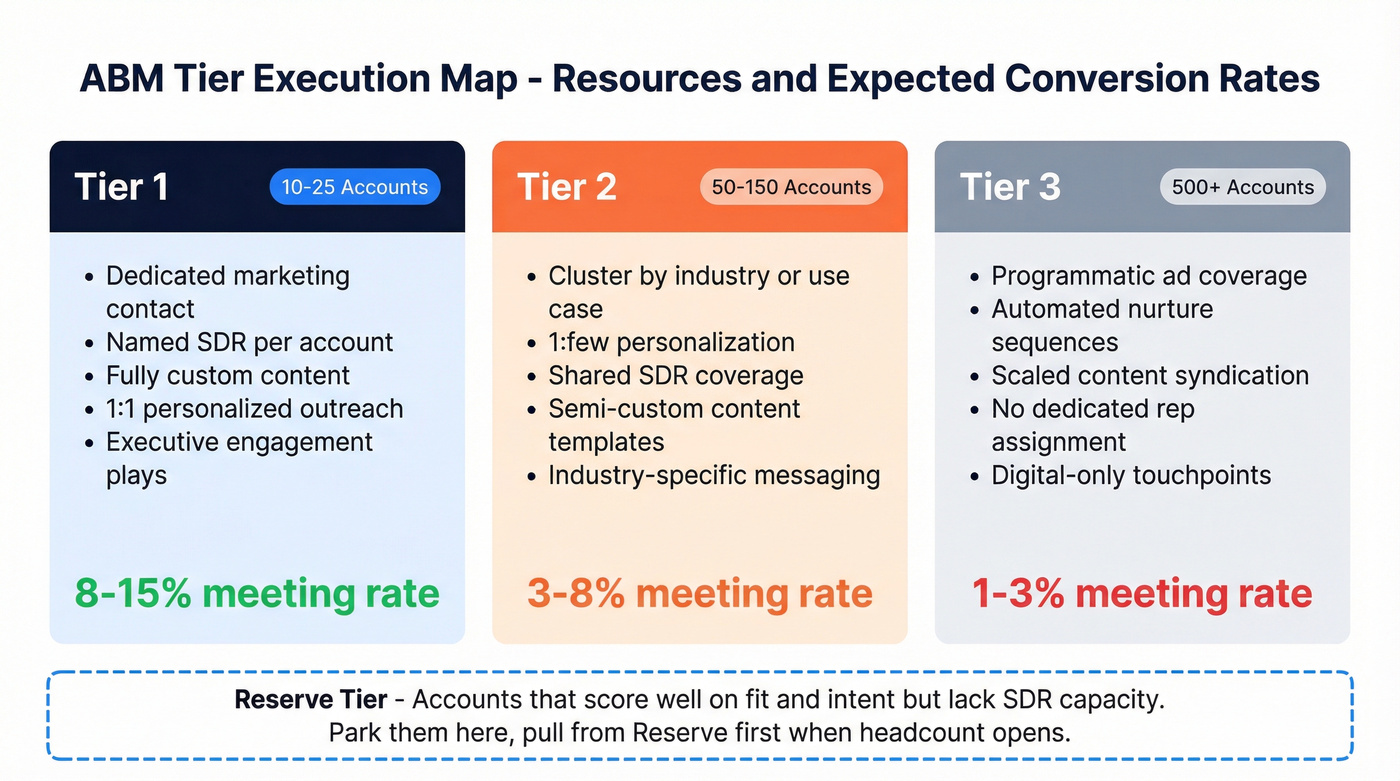
Tier 2 commonly runs 50-150 accounts with 1:few treatment. Cluster them by industry vertical or use case and build personalization at the cluster level. Tier 3 is 500+ accounts getting programmatic, automated coverage - targeted ads, nurture sequences, and scaled content.
We've also found it helpful to maintain a Reserve tier for accounts that score well on fit and intent but can't be worked due to SDR capacity constraints. Park them rather than forcing them into Tier 3 where they'll get generic treatment. When headcount opens up or a Tier 1 account closes, pull from Reserve first.
Here's what to expect for conversion benchmarks: Tier 1 outreach-to-meeting rates run 8-15%, Tier 2 lands in the 3-8% range, and Tier 3 is 1-3%. If your Tier 1 conversion rate looks like Tier 3, the scoring model is broken - or the data is. 58% of marketers see deal size increase with ABM, but that lift concentrates in Tier 1 where the personalization is real.
Intent Signals: Sources and Costs
First-, Second-, and Third-Party Intent
Not all intent signals are created equal. First-party intent comes from your owned properties - pricing page visits, demo requests, email clicks, chatbot conversations. Second-party intent is a partner's first-party data: G2 category views, Gartner Digital Markets signals, review site comparisons. Third-party intent is aggregated behavior across the open web, collected through data co-ops and ad networks.
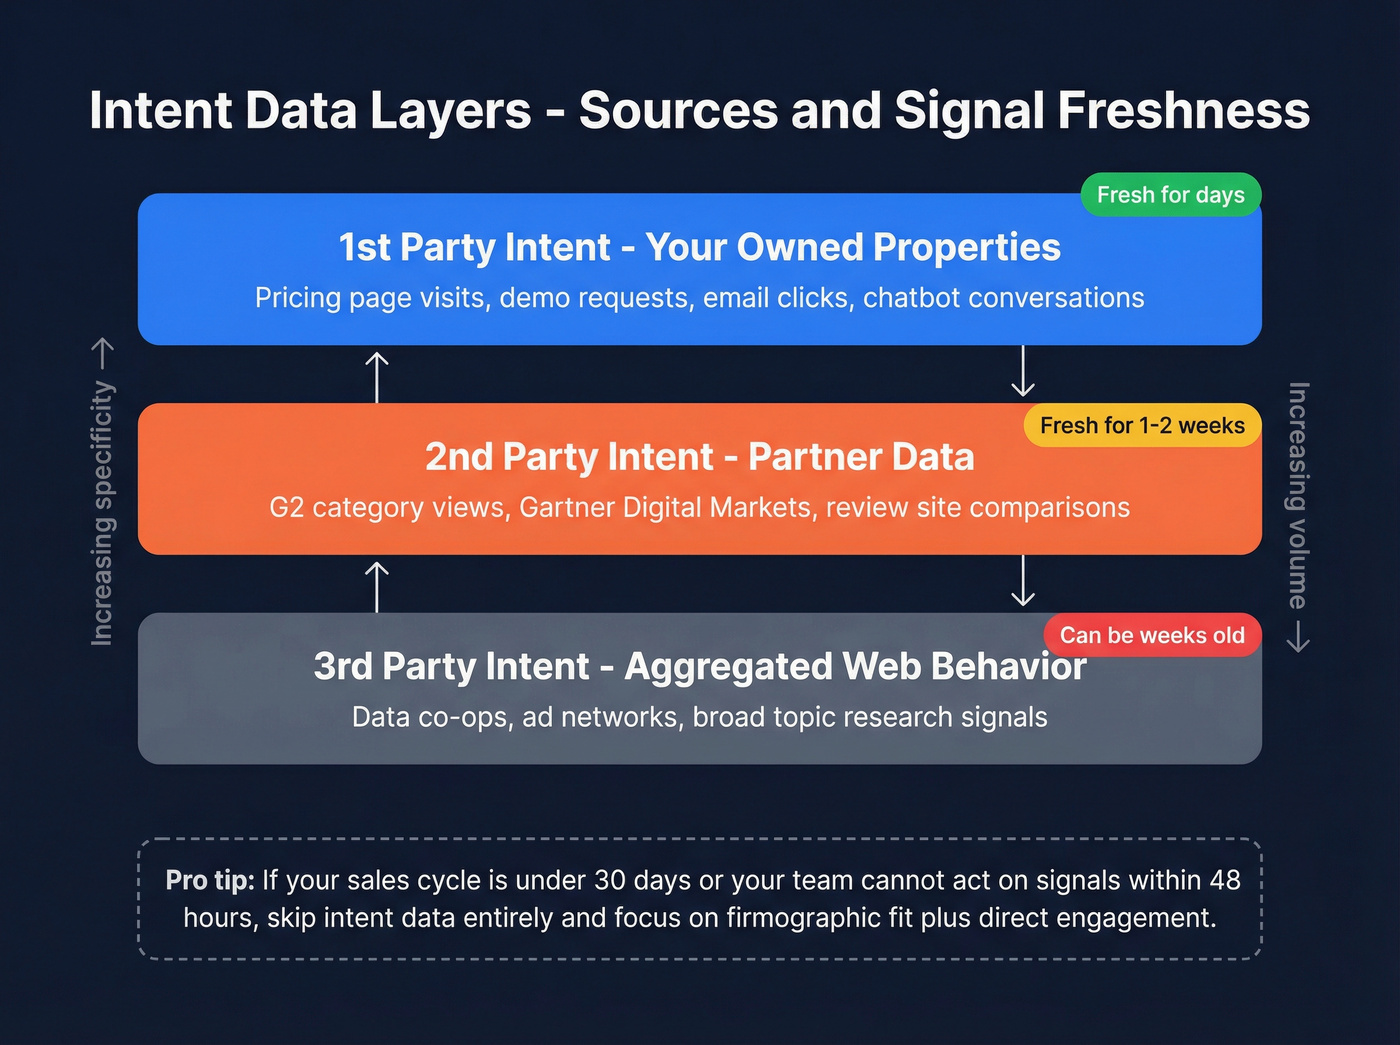
Demandbase's taxonomy frames it well: first-party tells you who's interested in you specifically, second-party tells you who's shopping your category, and third-party tells you who's researching the broader problem space. You need all three layers, but they decay at different rates. First-party signals are fresh for days. Third-party signals can be weeks old by the time they reach your CRM.
Here's the thing: intent data isn't always worth the investment. If your sales cycle is under 30 days, your TAM is extremely narrow, or your team can't operationalize the signals within 48 hours, skip the intent layer entirely and focus on firmographic fit and direct engagement. You can always add it later.
Provider Landscape
The pricing spectrum for intent data runs from about $99/month for basic website visitor identification to $100K+/year for enterprise ABM platforms with full intent suites.
| Provider Type | Signal Type | Level | Price Range |
|---|---|---|---|
| Website visitor ID (e.g., Snitcher) | Page visits, sessions | Account | ~$99-300/mo |
| G2 Buyer Intent | Category views, comparisons | Account | Packaged with G2 plans |
| Bombora (direct) | Topic surges, 5,000+ sites | Account | ~$25K-60K/yr |
| 6sense | Predictive + multi-source | Account | ~$60K+/yr |
| Prospeo | Intent topics + verified contacts | Account + Contact | Free tier available |
Your scoring model says Tier 1. Your bounce rate says otherwise. Prospeo delivers 98% email accuracy and 125M+ verified mobile numbers on a 7-day refresh cycle - so your highest-priority accounts actually get reached, not wasted.
Stop prioritizing accounts you can't actually contact.
Why Buying-Group Scoring Beats Lead Scoring
Complex B2B purchases involve 6-10 decision-makers on average. Scoring individual leads in isolation misses the signal that matters most: is the buying group mobilizing?
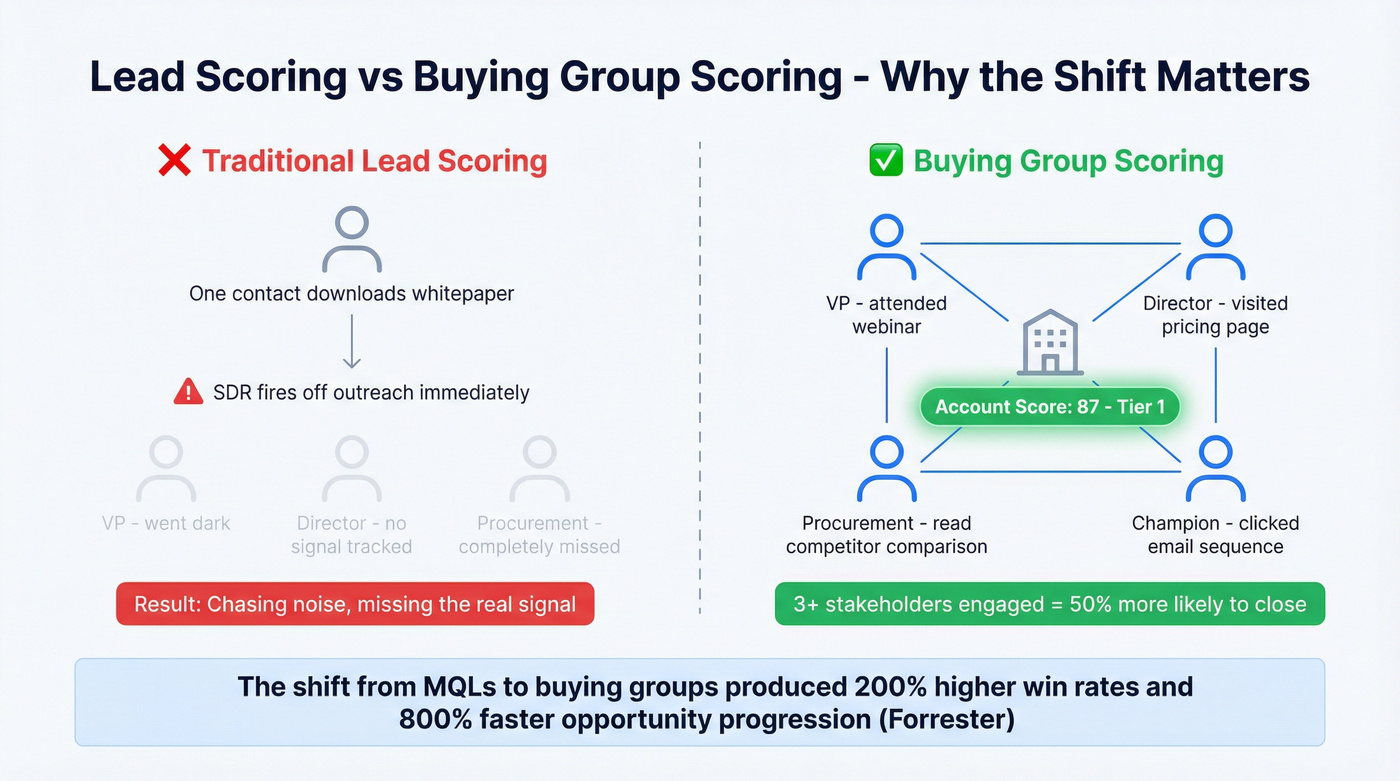
When three stakeholders from the same company engage with your brand, you're 50% more likely to convert that opportunity to closed-won. One person downloading a whitepaper is noise. Three people from the same account attending a webinar, visiting your pricing page, and reading competitor comparisons - that's a buying signal.
Your scoring model should aggregate engagement at the account level, not the contact level. Track how many unique contacts from each account are engaging, what roles they hold, and whether the engagement pattern matches your typical buying committee composition. A single VP clicking an email is less predictive than a VP, a director, and a procurement lead all showing activity in the same week. We've watched teams double their pipeline velocity just by making this one shift in how they measure engagement.
The Data Quality Gap
Let's be honest: the best scoring model in the world is worthless if your SDRs can't reach the accounts it surfaces.

We've seen this play out too many times. A team spends weeks building a beautiful tiering framework, loads it into Salesforce, and then watches Tier 1 outreach crater because a third of the emails bounce and the phone numbers connect to nobody useful. The industry-average data refresh cycle is six weeks. In six weeks, people change jobs, get promoted, switch email addresses, and move companies entirely. Your Tier 1 accounts deserve better than six-week-old data.
Snyk's team of 50 AEs saw their bounce rate drop from 35-40% to under 5% and generated 200+ new opportunities per month after switching to a 7-day data refresh cycle with 98% email accuracy through Prospeo. That's what happens when the execution layer matches the strategy layer - the scoring model finally gets a fair shot.
Intent surges, champion job changes, technographic signals - your scoring model tracks all of it. Prospeo layers 15,000 Bombora intent topics with 30+ filters including job change alerts and tech stack data, so every account score reflects reality, not last quarter's snapshot.
Score accounts on live signals, not stale spreadsheets.
Dynamic Tiering Cadences
A static account list is a dead account list. Dynamic prioritization means accounts move between tiers based on intent signal changes, deal progression, and engagement spikes - not just during quarterly planning sessions. Companies with strong sales-marketing alignment achieve 36% higher retention and 38% higher win rates, and alignment doesn't happen without structured cadences.
| Cadence | Participants | Agenda | Output |
|---|---|---|---|
| Weekly | SDRs + marketing | Pipeline review, campaign performance, blockers | Updated contact priorities |
| Monthly | Sales + marketing leads | Tier 1 deep dives, competitive intel, process fixes | Revised tier assignments |
| Quarterly | Revenue leadership | Program performance, goals, tech stack evaluation | Budget + strategy adjustments |
The weekly review is where dynamic tiering actually happens. An account that just spiked on three intent topics and had two stakeholders attend your webinar should move from Tier 2 to Tier 1 that week - not sit in a quarterly review queue. A champion who just left a Tier 1 account should trigger a downgrade while their new company gets flagged for Reserve. Build trigger-based tier movement into your CRM workflows so the model stays alive between meetings.
Tools to Operationalize It
Most teams don't need an enterprise ABM platform to start. Prove the model works first, then scale the tooling.
| Tool | Category | Starting Price | Best For |
|---|---|---|---|
| Prospeo | Data + enrichment + intent | Free tier, ~$0.01/email | Verified contacts + intent at startup pricing |
| Apollo.io | Sales intelligence | ~$49/mo per user | Prospecting + sequences for SMB |
| Demandbase | Full ABM platform | ~$30K-100K+/yr | Enterprise orchestration |
| 6sense | Full ABM platform | ~$60K/yr+ | Predictive analytics at scale |
| Bombora | Intent data | ~$25K-60K/yr | Pure intent co-op, 5,000+ sites |
| UserGems | Champion tracking | ~$1K-3K/mo | Job-change signals + warm intros |
| HubSpot Marketing Hub | Marketing automation | From $800/mo | ABM workflows for HubSpot teams |
Skip the six-figure platform if you're running fewer than 200 target accounts. For most teams starting out, the two biggest gaps are verified contacts and intent signals. Cover those first, prove the model, then layer on orchestration as your program matures. If you need a deeper framework for scoring and governance, use this ABM lead scoring guide as a companion.
FAQ
How many accounts should be in each ABM tier?
Tier 1 should hold 10-25 accounts for full 1:1 treatment with dedicated marketing and SDR resources. Tier 2 commonly runs 50-150 accounts with cluster-based personalization. Tier 3 is 500+ accounts receiving programmatic coverage. If your Tier 1 exceeds 50 accounts, you're spreading resources too thin to deliver real personalization.
Do I need an ABM platform to prioritize accounts?
No. A spreadsheet scoring model, a CRM like Salesforce or HubSpot, and a data enrichment tool for verified contacts and intent signals will get most teams started. The scoring model matters more than the software. Invest in a dedicated platform after you've validated your tiering framework and need multi-channel orchestration at scale.
How often should I refresh my account tiers?
Review tiers weekly during pipeline meetings and run a full re-score monthly. Accounts should move between tiers based on intent signal changes, deal progression, or engagement spikes - not sit static for a quarter. Build trigger-based workflows in your CRM so tier movement happens automatically when key thresholds are crossed.
When is intent data not worth the investment?
Skip the intent layer if your average sales cycle is under 30 days, your ICP has fewer than 500 total addressable accounts, or your team can't act on signals within 48 hours. Focus on firmographic fit and direct engagement instead - you can layer intent in later once the operational foundation is solid.