Sales Insights vs Sales Data: Your CRM Is Full of One and Starving for the Other
It's Monday morning. Your pipeline review starts in 20 minutes, and you're staring at a Salesforce dashboard with 14 charts, 6 filters, and absolutely no idea which deals to save this week. You've got data - thousands of rows of it. What you don't have is a single insight telling you what to do next.
This is the sales insights vs sales data problem, and it's costing your team quota every quarter.
Sales reps already spend 60% of their time on non-selling tasks. A big chunk of that goes to wrestling with data that never becomes useful. Most sales teams are data-rich and insight-poor, and the gap between those two things is where quota attainment goes to die.
The Quick Version
Sales data tells you what happened. Sales insights are the understanding and analysis you pull from that data to make better decisions about what to do next.
The framework connecting them is DIKW (Data -> Information -> Knowledge -> Wisdom), and we'll walk through it below. The core takeaway? If your underlying data is dirty - bounced emails, stale contacts, duplicate records - no amount of analysis will produce reliable insights. Clean data is the prerequisite. Everything else is downstream.
The Core Difference
Sales data is raw, unprocessed facts without context. A call log. A deal amount. A contact's job title. It answers nothing on its own.
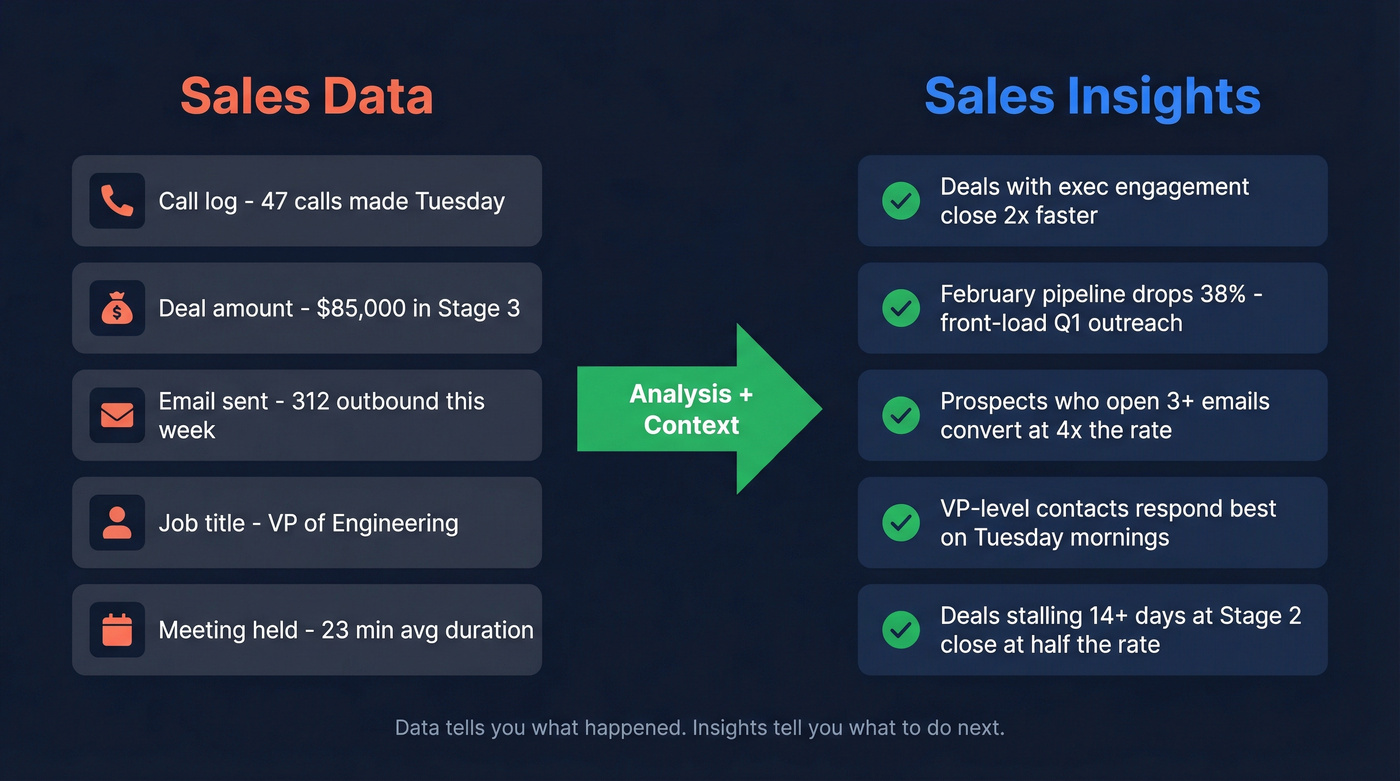
Sales insights are the interpreted, contextual conclusions you draw from that data - conclusions specific enough to change how you sell.
The confusion happens because most CRM dashboards sit somewhere in the middle. They organize data into charts, which feels like insight but isn't. A bar chart showing pipeline by stage is organized data. "Deals with executive engagement move through Stage 2 faster, so require an exec touchpoint before Stage 3" - that's an insight.
| Dimension | Sales Data | Sales Insights |
|---|---|---|
| Definition | Raw facts, no context | Interpreted conclusions |
| Examples | Call logs, deal amounts | "February pipeline drops 38%" |
| Format | Spreadsheets, CRM fields | Narratives, recommendations |
| Time orientation | Backward-looking | Forward-looking |
| Who uses it | Analysts, ops | Reps, managers, leaders |
| Action required | Needs processing | Ready to act on |
| Value without context | None | High |
Several data types feed into insights. Firmographic data like company size, industry, and revenue provides the foundation. Technographic signals reveal what tools prospects already use. Intent data drawn from content consumption shows who's actively in-market. Behavioral data from email opens and meeting attendance tracks engagement. And chronographic data - job changes, funding rounds, hiring surges - flags timely opportunities. Each type is a raw ingredient. The insight is the recipe.
The DIKW Framework for Sales Teams
The DIKW pyramid - Data, Information, Knowledge, Wisdom - is the clearest mental model for understanding how raw CRM records become decisions.
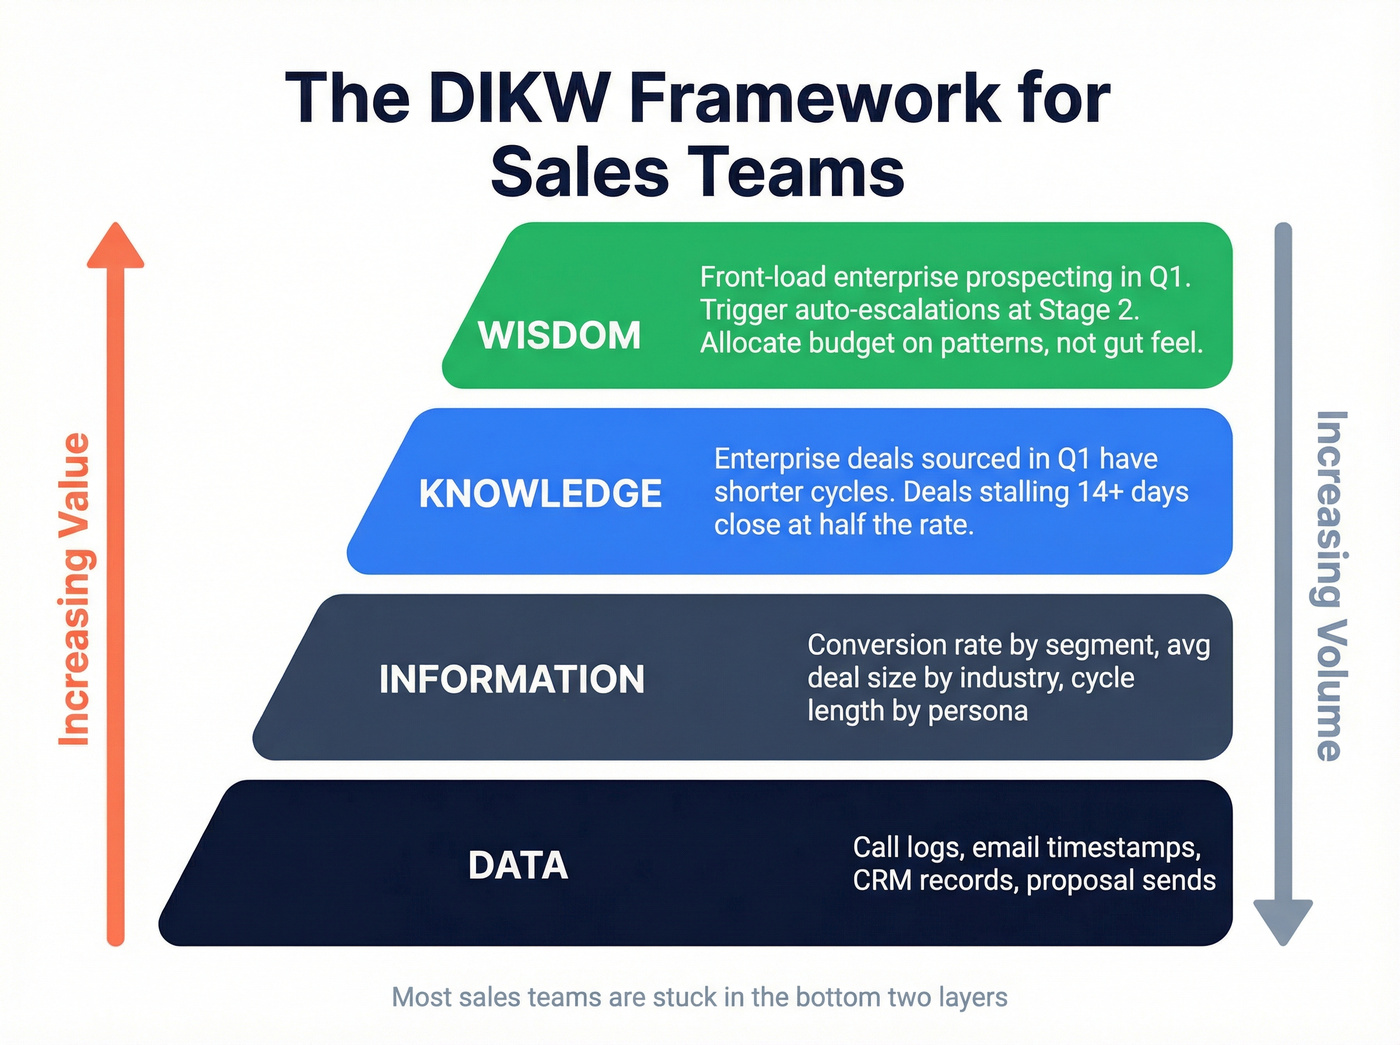
Data: Raw CRM interactions. Call logs, email timestamps, meeting notes, proposal sends, closed-won/lost records. Facts without context.
Information: Organized metrics. Conversion rate by segment, average deal size by industry, sales cycle length by persona. You've answered who, what, where, when - but not why or what next.
Knowledge: Patterns emerge. You notice enterprise deals sourced in Q1 have shorter cycles than Q3-sourced deals. Deals stalling 14+ days at Stage 2 close at a much lower rate than those that move faster. This is the "how" and "why" layer.
Wisdom: You act. You front-load enterprise prospecting in Q1. You trigger automated escalations when deals stall at Stage 2. You allocate budget based on patterns, not gut feel.
The sales intelligence market hit an estimated $3.80B in 2025 and continues growing at a 12.3% CAGR - that growth is driven almost entirely by teams trying to climb from the data layer to the wisdom layer faster.
You can't climb the DIKW pyramid on dirty data. Prospeo's 5-step verification delivers 98% email accuracy, and every record refreshes every 7 days - not the 6-week industry average. That means your CRM stays insight-ready, not insight-blocking.
Stop analyzing stale data. Start with contacts you can actually trust.
What Makes an Insight Actionable?
Not every "insight" deserves the name. A lot of what gets labeled as insight in sales decks is really just slightly organized data. Here's a five-point SMART test:
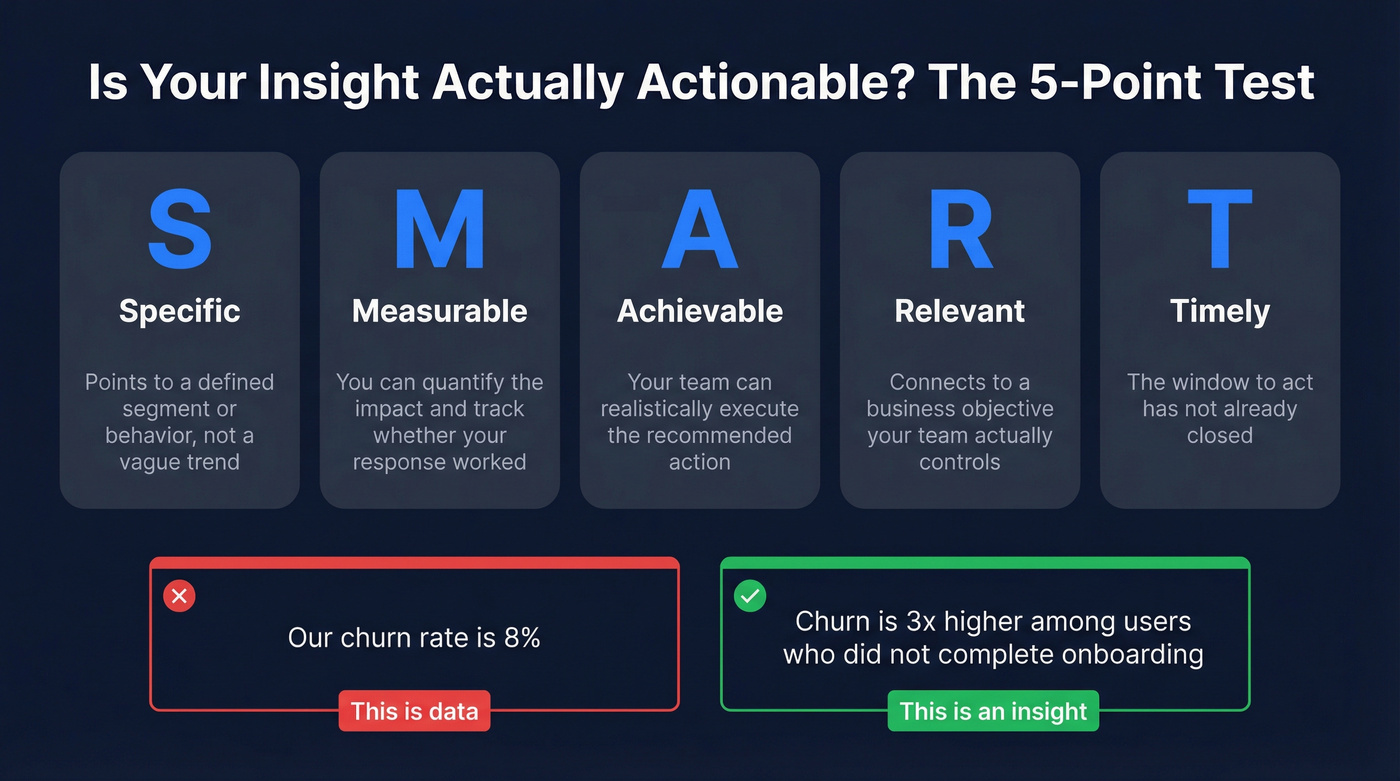
- Specific: Points to a defined segment, behavior, or variable - not a vague trend.
- Measurable: You can quantify the impact and track whether your response worked.
- Relevant: Connects to a business objective your team actually controls.
- Timely: The window to act hasn't already closed.
- Achievable: Your team can realistically execute the recommended action.
"Our churn rate is 8%" is data. "Churn is 3x higher among users who didn't complete onboarding" is an insight - it tells you exactly what to fix and gives you a measurable target. One number sits in a dashboard. The other changes your roadmap.
Here's the thing nobody talks about enough: even good insights can mislead you. Confirmation bias creeps in when you only look for patterns that validate what you already believe. Correlation masquerades as causation. And analysis paralysis is real - I've watched teams spend three weeks debating a dashboard while their pipeline rotted. The antidote is speed. Form a hypothesis, test it for two weeks, measure the result, move on.
The Cost of Skipping Insights
Only 43.5% of sales professionals hit quota. That's a majority of reps missing target. Worse, 17% of reps generate 81% of revenue, which means most organizations run on a handful of "hero reps" while the rest drown in data they can't interpret.
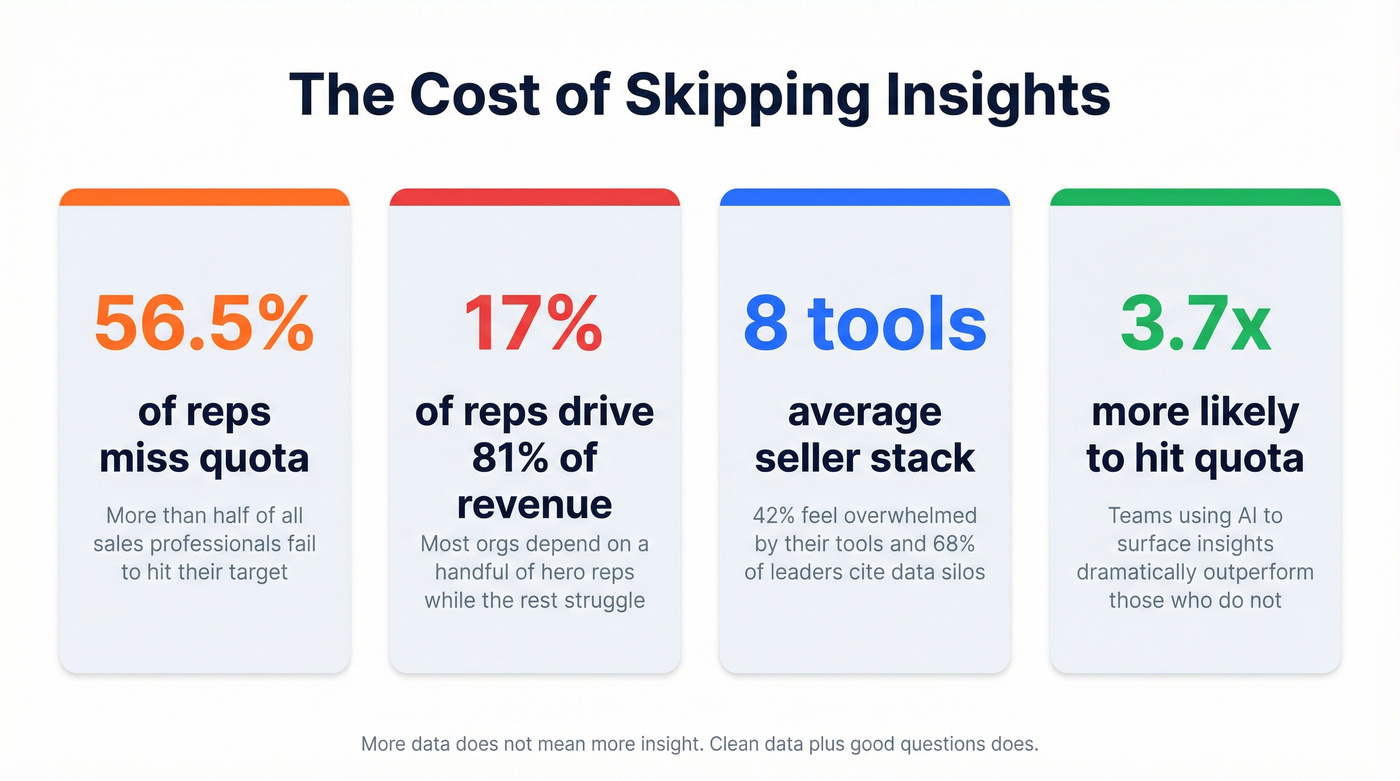
Tool overload compounds the problem. Sellers use an average of 8 tools to close deals, 42% feel overwhelmed by their stack, and 68% of sales leaders struggle with tool overlap and data silos. More tools means more data - but not more insight. The most common complaint we see in sales ops communities captures it perfectly: "My dashboard has 14 charts and tells me nothing."
In our experience, the pattern looks like this: a team exports a few thousand contacts, loads them into a sequence, and a big chunk bounce on the first send. The remaining list gets a low reply rate. The domain takes a hit, and the "data-driven" campaign produces a deliverability problem that takes weeks to fix. Nobody asked "is this data clean enough to act on?" before pressing send. That's not a data problem. It's an insight problem.
Clean, insight-ready CRM data also increases business valuation. Acquirers pay premiums for companies with clear pipeline visibility and reliable customer data. Skipping insights doesn't just cost you this quarter's number - it costs you long-term enterprise value.
Converting Data into Insights: A 4-Step Process
The gap between data and insight isn't mysterious. It's a four-step process, and most teams fail at step one.
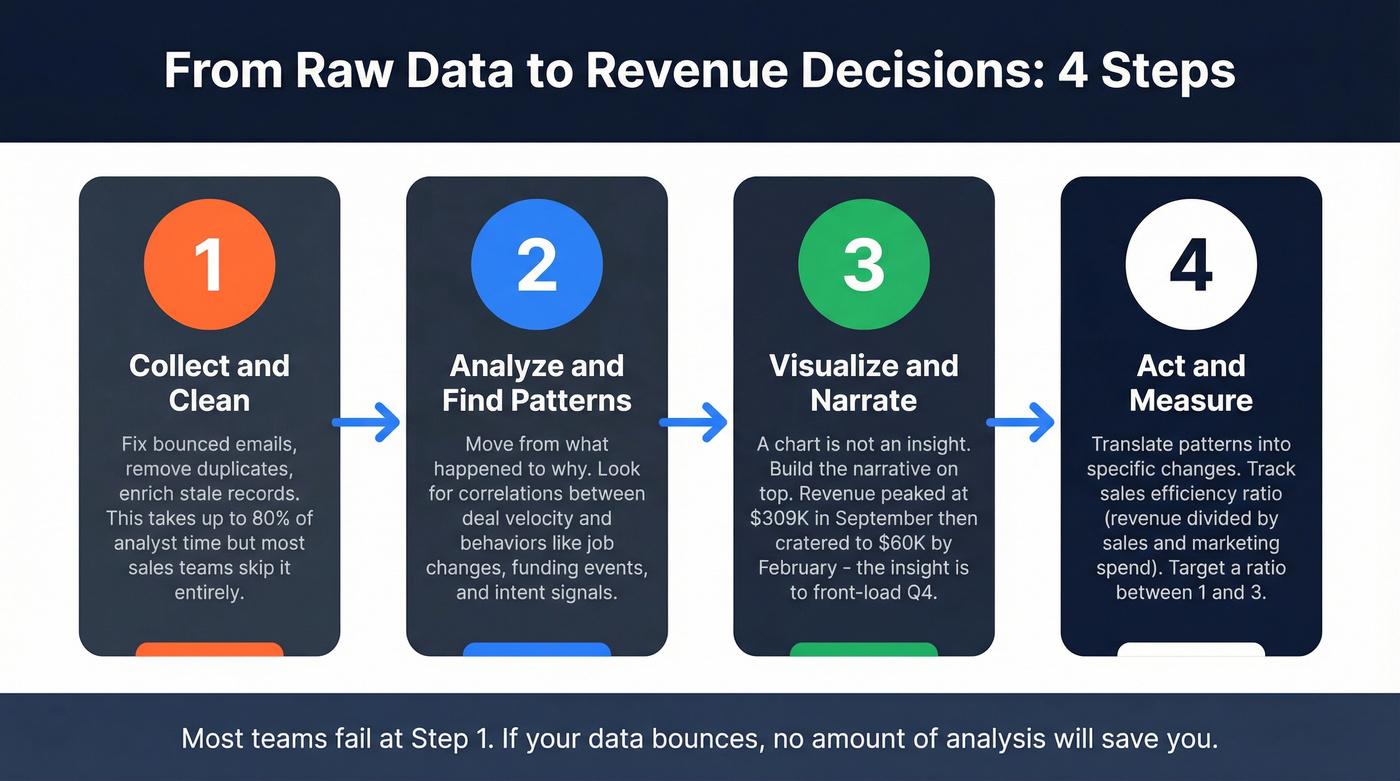
Step 1: Collect and Clean
A commonly cited industry benchmark puts data cleaning at up to 80% of analyst time. Sales teams aren't much different - except they often skip cleaning entirely. Sales leaders estimate 19% of company data is inaccessible, and CRM record incompleteness often sits in the 10-30% range. There's a reason 74% of sales teams using AI prioritize data hygiene first.
This is where data quality tools earn their keep. Prospeo's database covers 300M+ professional profiles on a 7-day refresh cycle, compared to the 6-week industry average, and email accuracy runs at 98% through a proprietary 5-step verification process. Snyk dropped bounce rates from 35-40% to under 5% after switching - that's the difference clean data makes before any analysis even begins.
Whatever tool you use, make sure it's GDPR compliant with clear data handling policies, especially when enriching contact records with third-party data.

Step 2: Analyze and Find Patterns
Once your data foundation is solid, you move from structured metrics to pattern recognition - the DIKW "knowledge" layer. Stop asking "what happened?" and start asking "why?" and "what's repeating?"
Look for correlations between deal velocity and specific behaviors. Job changes, new hires, and funding events are often some of the highest-signal triggers for expansion and reactivation - and they're easy to miss if you only look at account-level dashboards. Intent signals across multiple topics are another strong indicator of in-market activity.
Teams using AI for this analysis are 3.7x more likely to meet quota, largely because AI surfaces patterns across thousands of records that no human would catch manually.
Step 3: Visualize and Narrate
A dashboard isn't an insight. A chart showing monthly revenue is data visualization. An insight is the narrative you build on top of it.
Consider a straightforward example from an Excel-based sales analysis: revenue peaked in September at $309.8K, then cratered to $60.2K by February. The chart shows the drop. The insight is that there's a seasonal pattern, and the recommendation is to front-load promotions and pipeline building in Q4 to cushion the Q1 dip. The chart is information. The recommendation is wisdom.
Step 4: Act and Measure
Insights without action are just interesting observations.
The final step is translating patterns into specific, measurable changes and tracking whether they worked. The sales efficiency formula ties everything together: Gross Sales Efficiency = Total Revenue / Total Sales & Marketing Expenses. A healthy ratio falls between 1 and 3. Below 1 means you're spending more than you're earning. If you triggered automated escalations at Stage 2 based on a pattern you found in Step 2, did your efficiency ratio improve? That's the wisdom layer - decisions validated by results.
Tools That Bridge the Gap
With 11,000+ sales tech solutions on the market, the temptation is to buy another analytics tool every time insights feel thin. Resist that. You don't need more analytics tools - you need cleaner data and someone who asks better questions.
Let's be honest: if your average deal size is under $15K and your CRM contact data bounces above 10%, you've got no business spending $50K on a revenue intelligence platform. Fix the foundation first.
Here are the four categories that matter:
CRM-native analytics. Salesforce (from $25/user/mo) and HubSpot Sales Hub (paid plans typically start around $20-$25/user/mo depending on tier) already have built-in reporting. Most teams underuse what they're already paying for. Skip this if you haven't maxed out your existing CRM's reporting capabilities.
Revenue intelligence. Gong (~$30-50K/yr) and Clari (~$25-50K/yr) analyze sales conversations to surface deal-level insights. Powerful, but best suited for teams with 20+ reps and the budget to match.
BI tools. Tableau (from $15/user/mo) connects to your CRM for custom dashboards. Great if you have a dedicated analyst. Useless if you don't.
Bounced emails and stale contacts don't just kill campaigns - they poison every insight your team tries to extract. Prospeo enriches leads with 50+ data points at a 92% match rate, layering firmographic, technographic, and intent signals so your analysis actually means something.
Turn your CRM from data graveyard into decision engine for $0.01 per email.
FAQ
What's the difference between sales insights and sales intelligence?
Sales intelligence is the broader discipline of collecting and analyzing external data to inform selling decisions. Sales insights are the specific, actionable conclusions drawn from that intelligence - the "so what?" that changes how a rep approaches their next call. Think of intelligence as the process and infrastructure; insights are the output.
What are examples of actionable sales insights?
"Deals stalling 14+ days at Stage 2 close at half the rate - trigger an automated escalation at day 10" is an insight. "We closed 47 deals last quarter" is data. The distinction is action-orientation: if a finding doesn't suggest a specific next step, it's data wearing an insight costume.
How do you ensure data quality for reliable insights?
Start with verified contact data refreshed on a weekly cycle, then enforce CRM hygiene standards: mandatory fields on key objects, automated duplicate removal, and quarterly audits. The verification layer handles the foundation so your downstream analysis stays trustworthy - and it's the single highest-ROI investment most teams can make in their data stack.
Why does this distinction matter for revenue teams?
Acting on raw data without interpretation is how teams burn domains, miss quota, and waste budget. The distinction forces a critical question before every campaign: "Do we have a conclusion that tells us what to do, or just a number that tells us what happened?" Teams that internalize this consistently outperform those that don't.