Revenue Generation: The Data-Driven Guide for 2026
U.S. executives expect 7.9% revenue growth in 2026 - the most optimistic forecast in three years. But one-third of companies had to reforecast mid-year in 2025. Optimism without operational discipline is wishful thinking.
Here's the framework, benchmarks, and strategies that separate companies actually generating revenue from those just projecting it.
The Short Version
Revenue generation is the full set of motions - acquisition, expansion, retention - that turn your go-to-market into recurring income. Three metrics predict health: NRR, CAC payback, and pipeline velocity. If you track nothing else, track these.
What Is Revenue Generation?
It isn't a department. It's the coordinated system across sales, marketing, and customer success that produces income and keeps producing it. Revenue is total income before expenses; profit is what remains after deducting costs. The focus here is the top line: how you create, expand, and retain income streams.
Terminology creates confusion. Lead generation, demand generation, and revenue marketing get used interchangeably, but they're different scopes of the same problem.
| Lead Gen | Demand Gen | Revenue Marketing | |
|---|---|---|---|
| Focus | Contact capture | Awareness + interest | Full-funnel revenue |
| Tactics | Lists, forms, cold outbound | Content, SEO, events, nurture | Pipeline, expansion, retention |
| Metrics | MQLs, list size | Engagement, campaign ROI | Pipeline, ARR, NRR |
| Outcome | Names for sales | Qualified interest | Closed revenue + expansion |
When marketing and sales align around full-funnel accountability, the results aren't subtle. Commonly cited alignment benchmarks include 67% higher efficiency in closing deals, 208% higher marketing-generated revenue, and 38% higher win rates. RevOps sits underneath all of this as the operating system - the process, data, and tooling layer that makes growth repeatable instead of heroic.
Why It Matters in 2026
The macro picture looks encouraging on the surface. A survey of 1,030 U.S. companies found executives expect 7.9% average revenue growth in 2026, up from 6.9% projected in 2025 and 5.6% actual in 2024. Momentum is building - but the productivity story tells a different tale.
Top-quartile revenue per employee was forecast to drop 6% to $500,000 in 2025. Median revenue per employee barely moved - $265,714 to $266,667, a 0.3% increase. Hiring more reps isn't a growth strategy. It's a cost strategy unless your unit economics support it.
The one-third of companies that reforecast mid-year didn't fail because of market conditions. They failed because their systems couldn't predict or adapt. The companies that held their forecasts had better data, tighter operating cadences, and clearer metrics.
2026 Benchmarks Worth Knowing
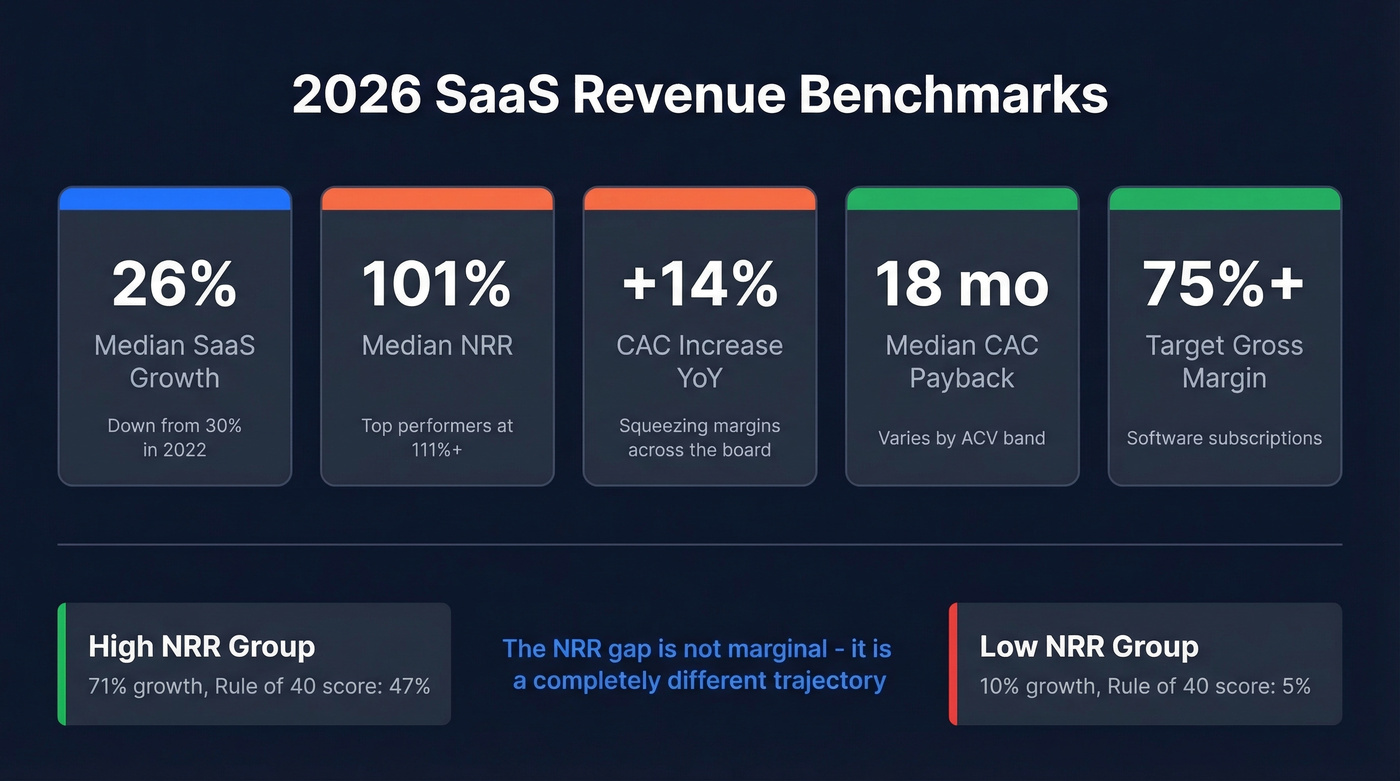
These benchmarks come primarily from aggregated SaaS data covering growth-stage and scale-up companies. Median SaaS growth settled at 26%, down from 30% in 2022. Net revenue retention compressed to 101% at the median, with top performers maintaining 111%+. Customer acquisition costs rose 14% in 2024, squeezing margins across the board.
CAC payback varies dramatically by deal size:
| ACV Range | Median CAC Payback |
|---|---|
| <$5K | 8 months |
| $5K-$25K | 14-18 months |
| $25K-$50K | 22 months |
| >$50K | 24 months |
The industry-wide median sits at 18 months. If you're above that for your ACV band, you're either spending too much to acquire or not retaining long enough to recoup.
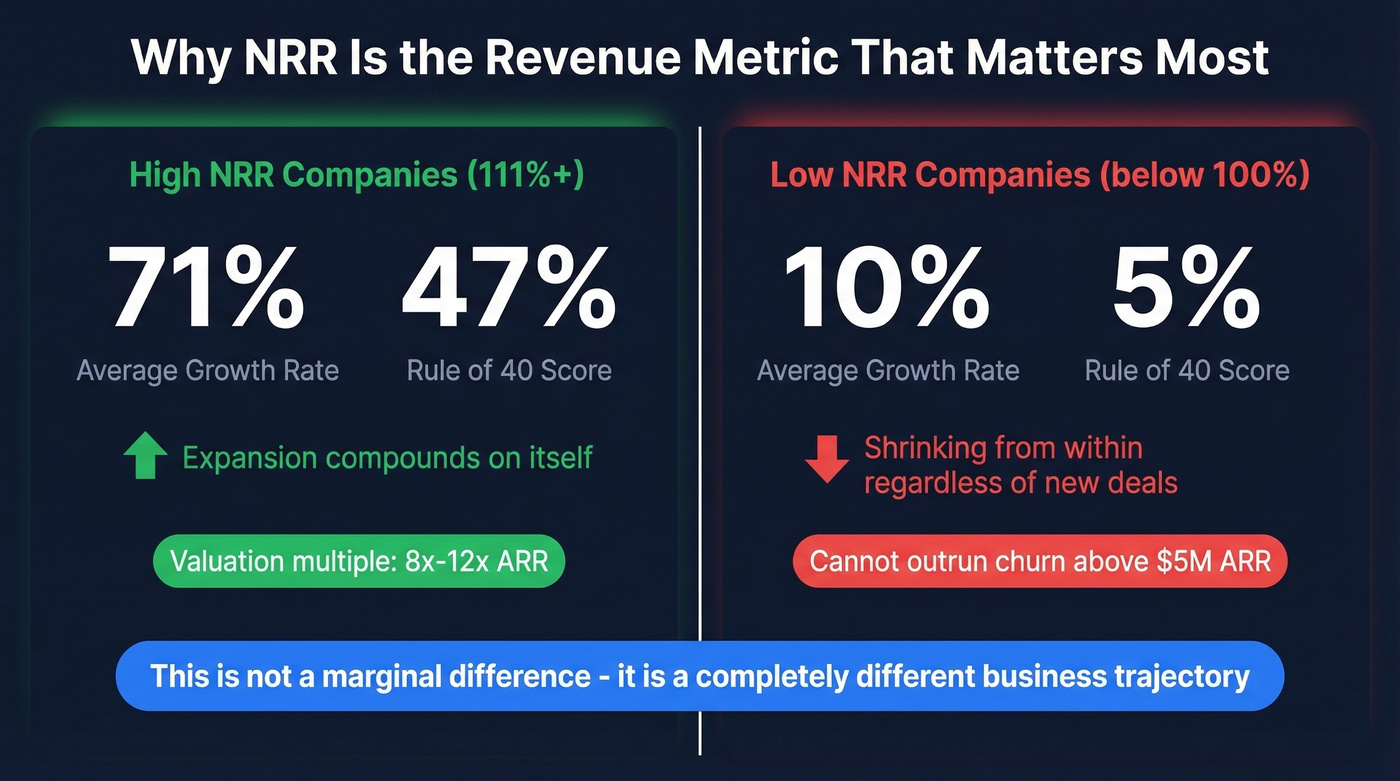
The Rule of 40 data tells the real story. High Alpha analyzed 800+ SaaS companies and found the high-NRR group averaged 71% growth with a Rule of 40 score of 47%. The low-NRR group? 10% growth and a Rule of 40 of 5%. That's not a marginal difference - it's a completely different business trajectory.
Gross margins should be 75%+ for software subscriptions. VC-backed ARR growth benchmarks run 25-30% median with top quartile at 50%+. Bootstrapped companies typically land at 20-23% median. For context on what the market rewards: US SaaS valuation multiples sit at 8x-12x ARR, while AI companies command 25x-30x ARR. Retention and efficiency aren't just operational metrics - they're valuation drivers.
Revenue Models at a Glance
Your revenue model is the income-generating framework within your business model - not the same as a revenue stream or a business model itself.
| Model | Description | Best For | Example |
|---|---|---|---|
| Subscription | Recurring fee for access | SaaS, media | Salesforce, Netflix |
| Markup | Margin on goods sold | E-commerce, retail | Amazon |
| Licensing | One-time or periodic IP fee | Software, content | Microsoft Office |
| Commission | % of transaction value | Marketplaces, brokers | Airbnb, Stripe |
| Usage-based | Pay per unit consumed | Infrastructure, APIs | AWS, Twilio |
| Marketplace | Platform fee on GMV | Two-sided platforms | Etsy, Uber |
Freemium isn't a revenue model - it's an acquisition model. The model underneath is usually subscription or usage-based. And pay-per-user pricing is declining in popularity because it suppresses adoption, hurts MAU/DAU metrics, and contributes to churn. If you're still charging per seat without a strong reason, rethink it.
CAC payback is rising 14% year over year. The fastest fix isn't spending less - it's connecting with the right buyers faster. Prospeo's 300M+ profiles with 30+ filters (intent data, technographics, headcount growth) let you build pipeline against your exact ICP, not a loose approximation. At $0.01 per verified email with 98% accuracy, your unit economics improve before you change a single campaign.
Fix the top of your pipeline velocity formula today.
The 90-Day Framework
Most failures here aren't strategy failures - they're execution failures. Teams pick the right strategies but implement them without structure, measurement, or accountability.
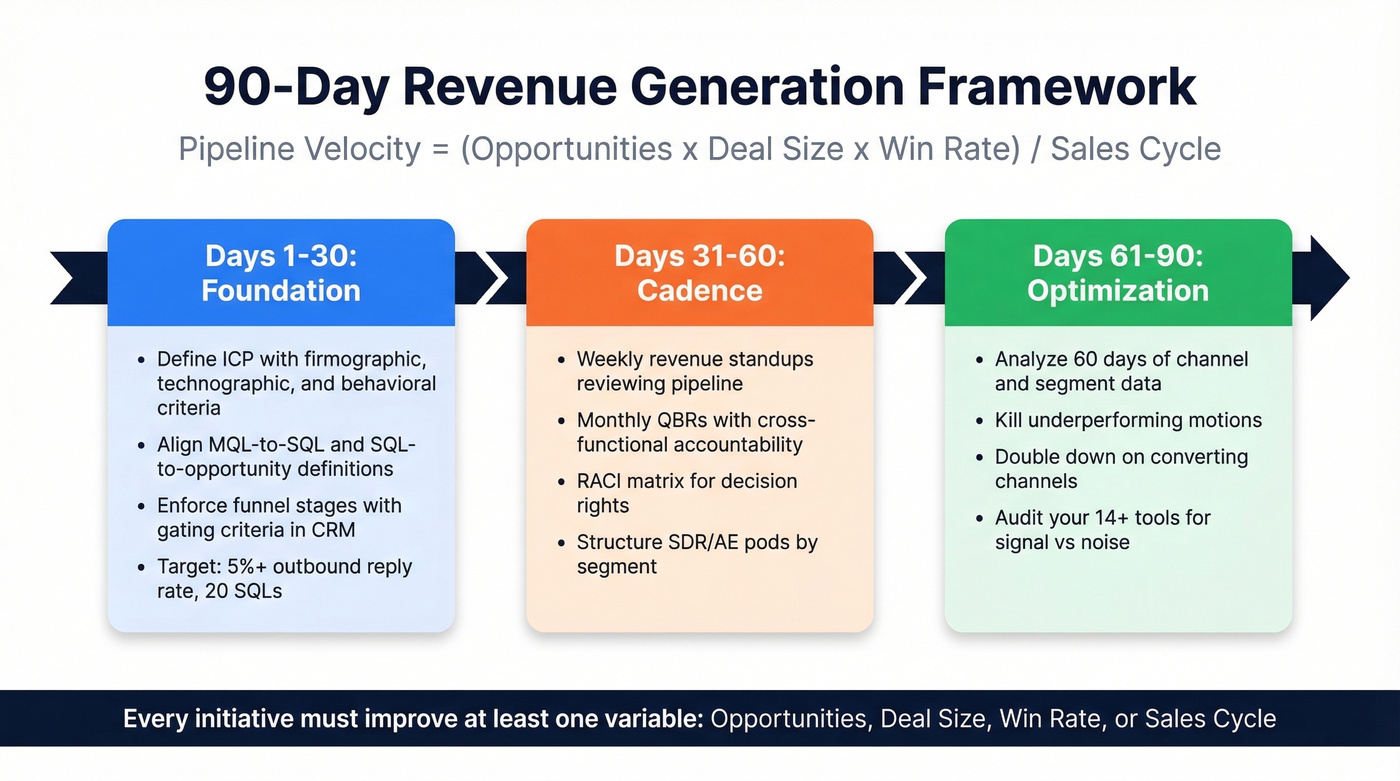
The core formula: Pipeline Velocity = (Opportunities x Deal Size x Win Rate) / Sales Cycle. Every initiative you run should improve at least one of those four variables. If it doesn't, question why you're doing it.
Days 1-30: Foundation
Define your ICP with precision - not "mid-market SaaS" but specific firmographic, technographic, and behavioral criteria. Align sales and marketing on shared MQL-to-SQL and SQL-to-opportunity definitions. Enforce funnel stages in your CRM with gating criteria. Set early targets: outbound reply rates of 5%+, webinar live-to-MQL conversion of 30%+, 20 SQLs by day 30.
Days 31-60: Cadence
Establish weekly revenue standups reviewing pipeline, monthly QBRs with cross-functional accountability, and a RACI matrix for decision rights. In our experience, this is where most teams stall - they build the foundation but never create the operating rhythm to sustain it.
B2B buyers spend 87% of their journey without seller involvement and require roughly 2,000 impressions and 200 touchpoints before committing. Your cadence needs to account for that complexity. Consider structuring SDR/AE pods by segment so each team owns the full cycle for their ICP slice.
Days 61-90: Optimization
With 60 days of data, you can see which channels, messages, and segments actually convert. Kill what isn't working. Double down on what is. The average B2B company uses 14+ tools to manage the customer lifecycle - this is the phase where you audit whether those tools generate signal or just noise.
7 Strategies That Drive Revenue Growth
1. Pricing and Packaging
This is the highest-leverage, lowest-effort strategy most companies ignore. A 10% price increase on existing plans often generates more incremental revenue than hiring two new reps - and costs nothing to test. Usage-based components layered onto a subscription base give customers flexibility while protecting your floor. Let's be honest: if you haven't revisited pricing in the last 12 months, you're probably leaving six figures on the table.
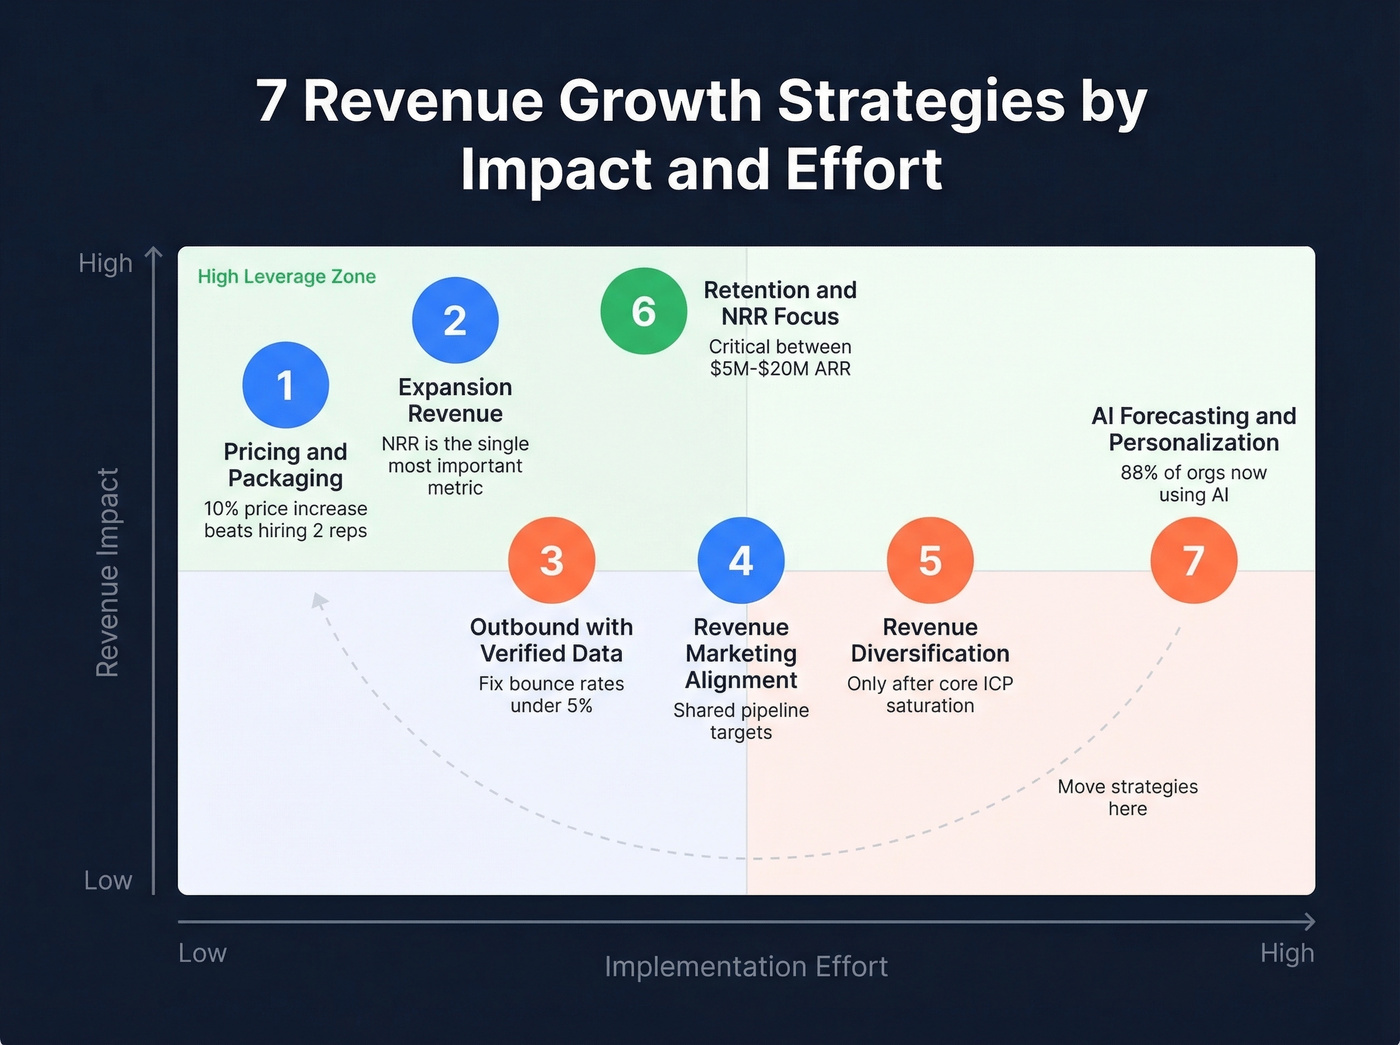
2. Expansion Revenue
NRR is the single metric we'd watch for subscription businesses. Companies with high NRR average 71% growth; low-NRR companies average 10%. If your CS team doesn't have expansion targets, you're leaving the most efficient income on the table. Upsells, cross-sells, and seat expansion all compound - and they cost a fraction of new logo acquisition.
3. Outbound Prospecting with Verified Data
Skip this if your ACV is under $2K and your motion is purely product-led. For everyone else, data quality is the invisible bottleneck. If your bounce rate is above 5%, you're leaking pipeline before a human ever sees your message. One rep with verified data outperforms three reps dialing dead numbers - we've seen this pattern repeatedly across teams we work with.
Here's a scenario that plays out constantly: a 50-person AE team spends 4-6 hours per week prospecting, but 35-40% of their emails bounce. That's not a sales problem. That's a data problem. Snyk faced exactly this situation, and after fixing their data source, AE-sourced pipeline jumped 180% with bounce rates dropping under 5%. Meritt tripled pipeline from $100K to $300K/week after a similar switch. The common thread in both cases was moving to a provider with a 7-day data refresh cycle and 98% email accuracy - which is what Prospeo delivers at roughly $0.01 per verified email.

4. Revenue Marketing Alignment
Stop measuring marketing on MQLs and sales on closed-won as if they're separate sports. Full-funnel accountability means shared pipeline targets, SLAs on lead response time, and joint ownership of conversion rates at every stage. The tactical move is simple: put marketing and sales in the same weekly standup reviewing the same pipeline dashboard. We've watched this single change shift team dynamics faster than any tool purchase.
5. Revenue Diversification
Readymode launched a new license type and saw a 30% ARPU lift. Partner ecosystems, international expansion, and complementary service offerings all reduce concentration risk. The consensus on r/SaaS and in most founder communities aligns: don't diversify until you've saturated your core ICP. Premature diversification is one of the most common scaling mistakes.
6. Retention and NRR Focus
Churn reduction becomes critical between $5M and $20M ARR. Below that, you can outrun churn with new logos. Above it, the math stops working.
NRR benchmarks: 101% median, 111%+ for top performers. If you're below 100%, you're shrinking from within regardless of how many new deals you close. And sometimes the best retention move is pruning customers that are unprofitable to serve - counterintuitive, but it frees up CS bandwidth for accounts that actually expand.
7. AI-Powered Forecasting and Personalization
88% of organizations now use AI regularly in at least one business function. AI-driven forecasting, personalized outreach, and automated lead scoring produce real results. But AI accelerates what's already working - it doesn't fix broken processes. If your data is garbage, AI just processes garbage faster.
5 Mistakes That Kill Growth
Chasing the shiny penny. Expanding into new segments before you've saturated your core market. The SaaStr community recommends waiting until $10M-$20M ARR before putting even a small team on adjacent segments. Zero-traction experiments burn cash and distract leadership.
The "I give up" VP hire. Compromising on leadership quality because you're tired of searching. A mediocre VP of Sales doesn't just underperform - they hire mediocre managers, build mediocre processes, and set mediocre expectations. This one decision can set you back 12-18 months.
Comp plans that kill LTV. If your reps earn the same commission on a 1-year deal as a 3-year deal, you've built a comp plan that optimizes for short-term income at the expense of lifetime value. We've watched teams wonder why churn spikes 12 months after a record-breaking sales quarter - the answer was always in the comp structure.
Underestimating burn rate past $1M-$2M ARR. More reps means more managers, more enablement, more tooling, more marketing spend, more CSMs. The cost curve isn't linear - it accelerates. Model this aggressively or you'll find yourself raising an emergency round at unfavorable terms.
The win-rate paradox. Persistently high win rates feel good but signal a problem: you're not entering enough competitive deals. As you scale, win rates should decline because you're expanding into harder segments. If your win rate stays at 60%+ as you grow, you're cherry-picking deals and leaving money on the table.
AI and Revenue in 2026
Look, here's the hot take: most companies don't have an AI problem. They have a data quality problem they're hoping AI will solve. It won't.
McKinsey's 2025 survey found that while 88% of organizations use AI regularly, only 39% report any EBIT impact - and most say it's less than 5%. NVIDIA's 2026 survey paints a more optimistic picture: 30% of companies report more than 10% revenue increase from AI. PepsiCo's digital twins delivered a 20% throughput increase. These are real results, but they come from companies with clean data and clear processes.
Agentic AI is the current frontier - 23% of companies are scaling it, 39% experimenting. But the fundamental constraint hasn't changed: AI is an accelerant, not a strategy. The companies seeing real AI ROI aren't the ones with the fanciest models. They're the ones with the cleanest inputs.
You need 200 touchpoints to close a B2B deal. Every bounced email and wrong number wastes one. Prospeo's 7-day data refresh cycle means your outbound hits real inboxes - not spam traps. Teams using Prospeo book 26% more meetings than ZoomInfo users and 35% more than Apollo, turning pipeline into revenue instead of reforecasting mid-year.
Stop reforecasting. Start closing with data that connects.
Key Metrics to Track
Every metric below connects back to the pipeline velocity formula. The "Opportunities" variable depends entirely on reaching verified contacts - bad data shrinks the numerator before your team even gets a chance.
| Metric | What It Measures | 2026 Benchmark |
|---|---|---|
| MRR/ARR | Recurring revenue run rate | Company-specific |
| NRR | Expansion minus churn | 101% median, 111%+ top |
| CAC Payback | Months to recoup acquisition cost | 18 mo median |
| CLV:CAC | Lifetime value vs acquisition cost | 3:1+ healthy |
| Pipeline Velocity | Revenue throughput speed | Formula-driven |
| Win Rate | Deals won / deals entered | Declines as you scale |
| Revenue/Employee | Productivity efficiency | $266,667 median |
| Gross Margin | Revenue minus COGS | 75%+ for SaaS |
The metrics that matter most depend on your stage. Pre-$5M ARR, obsess over pipeline health and win rate. Between $5M and $20M, shift focus to NRR and CAC payback. Post-$20M, revenue per employee and gross margin become the efficiency levers that determine whether you're building a durable business or just a big one.
FAQ
What's the difference between revenue generation and demand generation?
Revenue generation spans the full customer lifecycle - acquisition, expansion, and retention - measured by pipeline, ARR, and NRR. Demand generation is one input within that system, focused on creating awareness and qualified interest. The distinction matters because optimizing demand gen alone ignores expansion and retention, which often drive more efficient growth than new logos.
What's a good net revenue retention rate?
Median NRR across SaaS is 101% in 2026; top performers maintain 111%+. Companies with high NRR grow at 71% on average versus 10% for low-NRR companies, based on High Alpha's analysis of 800+ SaaS firms. NRR above 100% means existing customers generate more income each year without new sales - the clearest signal of product-market fit at scale.
How does data quality affect pipeline and revenue?
Bad prospect data silently kills pipeline velocity. If 30%+ of outbound emails bounce, a third of your pipeline evaporates before a human sees your message. Clean data with a short refresh cycle keeps your pipeline math honest and your domain reputation intact. It's the foundation every other growth strategy depends on.
Can you share real-world revenue generation examples?
Meritt tripled weekly pipeline from $100K to $300K by fixing data quality. Readymode lifted ARPU 30% through a new license type - a pricing and packaging play. PepsiCo used AI-driven digital twins for a 20% throughput increase. Each example targets a different lever: data accuracy, pricing, operational efficiency. That's why sustainable income growth is a system, not a single tactic.
How long does it take to build a predictable revenue engine?
Expect 90 days to establish the foundation - ICP definition, funnel alignment, and operating cadence. Meaningful pipeline impact typically shows within 60-90 days of disciplined execution. Full maturity, where your engine is predictable and self-correcting, takes 6-12 months depending on sales cycle length and team size.