Revenue Prediction: What the Textbooks Skip
A RevOps lead we know built a beautiful revenue projection model in January. By March, actual revenue was 22% below the forecast. The board lost confidence, the hiring plan got frozen, and the team spent Q2 rebuilding trust instead of building pipeline.
That story isn't unusual - only 43% of sales leaders forecast within 10% accuracy. The other 57% are making resource decisions on numbers they can't trust. Revenue prediction doesn't have to be this broken, but most teams are doing it wrong.
The Short Version
Pick weighted pipeline if you're sales-led, cohort retention modeling if you're SaaS. Measure accuracy with WAPE, not gut feel. Fix your data before you upgrade your model - a simple method on clean data beats a sophisticated model on stale CRM records every time.
What Is Revenue Prediction?
Revenue prediction is the process of estimating future revenue using historical data, pipeline signals, and statistical or machine-learning models. It sounds straightforward. It isn't.
The terms "prediction," "forecast," and "projection" get tossed around interchangeably in most organizations, but they mean slightly different things - and the distinction matters when you're talking to your CFO versus your data science team.
| Term | Definition | Typical Use Case |
|---|---|---|
| Forecast | Expected outcome given current conditions and plans | Quarterly board decks, budget planning |
| Prediction | Data-driven estimate, often ML/statistical | Demand modeling, pipeline scoring |
| Projection | Hypothetical "what-if" scenario analysis | M&A modeling, expansion planning |
The AICPA framework classifies both forecasts and projections as "prospective financial statements," but forecasts assume expected conditions while projections test hypothetical ones. In practice, most sales and RevOps teams use "forecast" and "prediction" interchangeably - and that's fine.
Why Accurate Forecasts Matter
Revenue prediction drives every downstream decision your company makes:
- Budgeting and headcount planning. Miss your forecast by 15% and that hiring plan you approved in January becomes a liability by Q3.
- Cash flow management. Especially for SaaS companies where bookings, billings, and recognized revenue are three different numbers.
- Investor confidence. Public companies that consistently miss guidance take a stock price hit. Private companies that miss forecasts lose board trust - and rebuilding that trust takes quarters, not weeks.
- Go-to-market timing. Product launches, territory expansions, and marketing spend all depend on revenue assumptions. Bad assumptions cascade into bad decisions across every department.
The #1 complaint on r/SaaS about revenue forecasting? "It's usually wrong because deals slip." That's not a methodology problem. It's a data and process problem.
Revenue Prediction Methods
Not every method works for every business. A SaaS company with $5M ARR and a transactional e-commerce business need fundamentally different approaches. Choosing the right model starts with understanding your go-to-market motion.
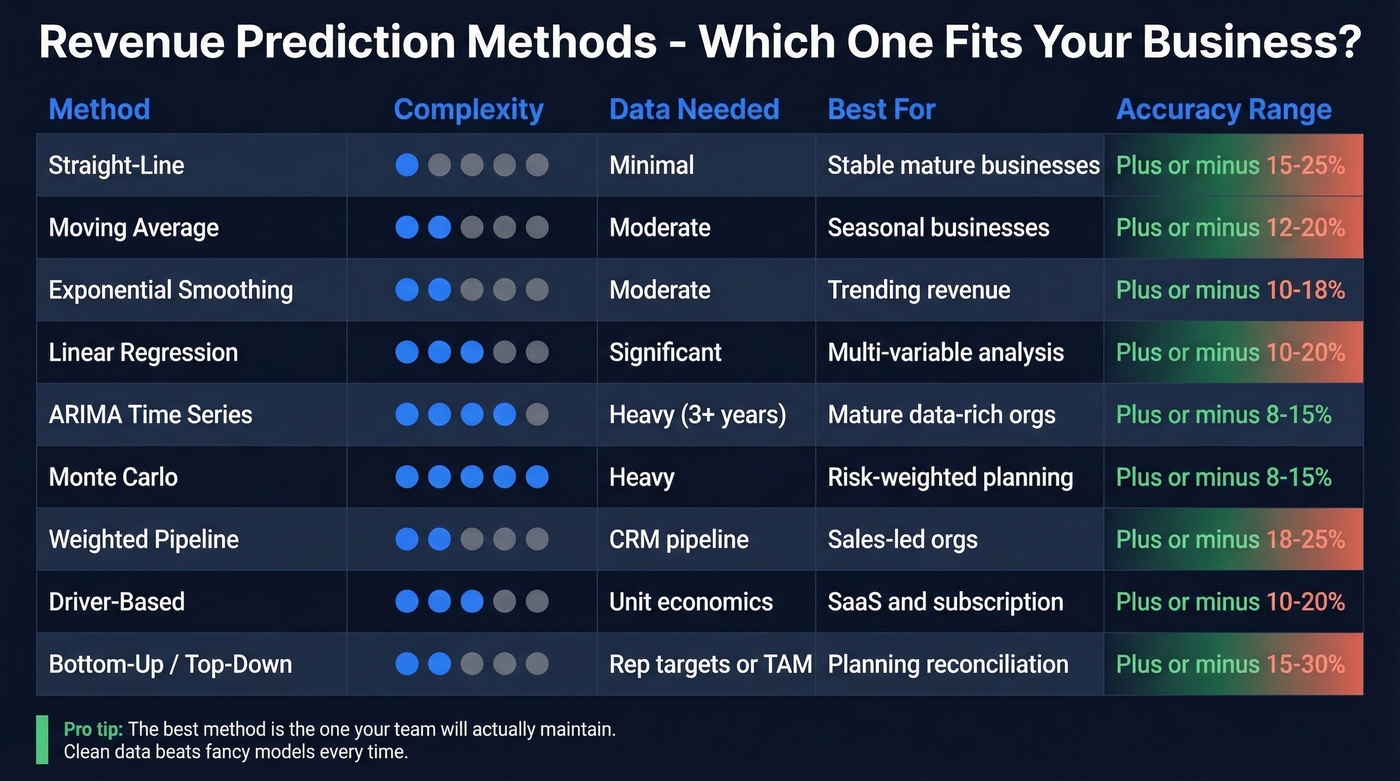
| Method | Description | Best For | Typical Variance |
|---|---|---|---|
| Straight-line | Assumes constant growth rate | Stable, mature businesses | ±15-25% |
| Moving average | Smooths recent periods | Seasonal businesses | ±12-20% |
| Exponential smoothing | Weights recent data more heavily | Trending revenue | ±10-18% |
| Linear regression | Models revenue vs. drivers | Multi-variable analysis | ±10-20% |
| Time series (ARIMA) | Decomposes trend + seasonality | 3+ years of data | ±8-15% |
| Monte Carlo | Simulates many probability scenarios | Risk-weighted planning | ±8-15% |
| Pipeline-based | Weights deals by stage probability | Sales-led orgs | ±18-25% |
| Driver-based | Models from unit economics up | Subscription/usage models | ±10-20% |
| Bottom-up / Top-down | Aggregates rep/segment targets or starts from TAM | Planning and reconciliation | ±15-30% |
Quantitative Models
Straight-line extrapolation is the simplest approach - take last year's revenue, apply a growth rate, done. It works surprisingly well for mature businesses with stable markets. Moving average and exponential smoothing add sophistication by accounting for recent trends and seasonality.
Regression and ARIMA models bring statistical rigor but require clean historical data and someone who understands the math. Monte Carlo simulation uses random sampling to generate a range of possible revenue outcomes - powerful for risk-weighted planning, but often overkill if your fundamentals aren't solid. Here's the thing: the fancier the model, the more it depends on data quality. We've seen teams spend weeks building ARIMA models that performed worse than a weighted pipeline approach because the underlying CRM data was garbage.
Pipeline & Driver-Based Methods
Pipeline-based forecasting weights each deal by its stage probability and expected close date. It's the default for sales-led organizations, and for good reason - it connects directly to what reps are working. The weakness is that it inherits every bias in your pipeline: sandbagging reps, stale opportunities nobody's cleaned up, and the eternal optimism of a deal that's been "closing next week" for three months.
Driver-based modeling works from unit economics upward - number of leads multiplied by conversion rate, multiplied by average deal size, multiplied by expansion rate. It's more resilient to individual deal noise but requires you to actually know your conversion rates with precision.
Bottom-up aggregates individual rep or segment forecasts. Top-down starts from market size and works backward. Smart teams use both and reconcile the gap.
When You Don't Have a Backlog
If you're running a transactional business - e-commerce, services without contracts, project-based revenue - you don't have a pipeline to weight. One FP&A analyst on r/FPandA put it perfectly: "We don't have a meaningful backlog... forecasting feels more like educated guessing."
For these businesses, combine daily/weekly sales averages with operational input like marketing calendars, seasonal patterns, and promotion schedules. Layer in regression against leading indicators - web traffic, quote volume, inbound inquiries - and you'll get closer than gut feel alone. Tracking forecast volume by channel or product line adds granularity that pure averages miss. Accept that accuracy will be lower than pipeline-based models. That's the nature of the business, not a failure of the method.
Which Method Should You Pick?
If you're sales-led with a CRM pipeline, start with weighted pipeline. SaaS with renewals driving 30%+ of revenue? Cohort retention modeling. Transactional with no backlog? Moving averages plus leading indicators. Don't overcomplicate it - the best method is the one your team will actually maintain.
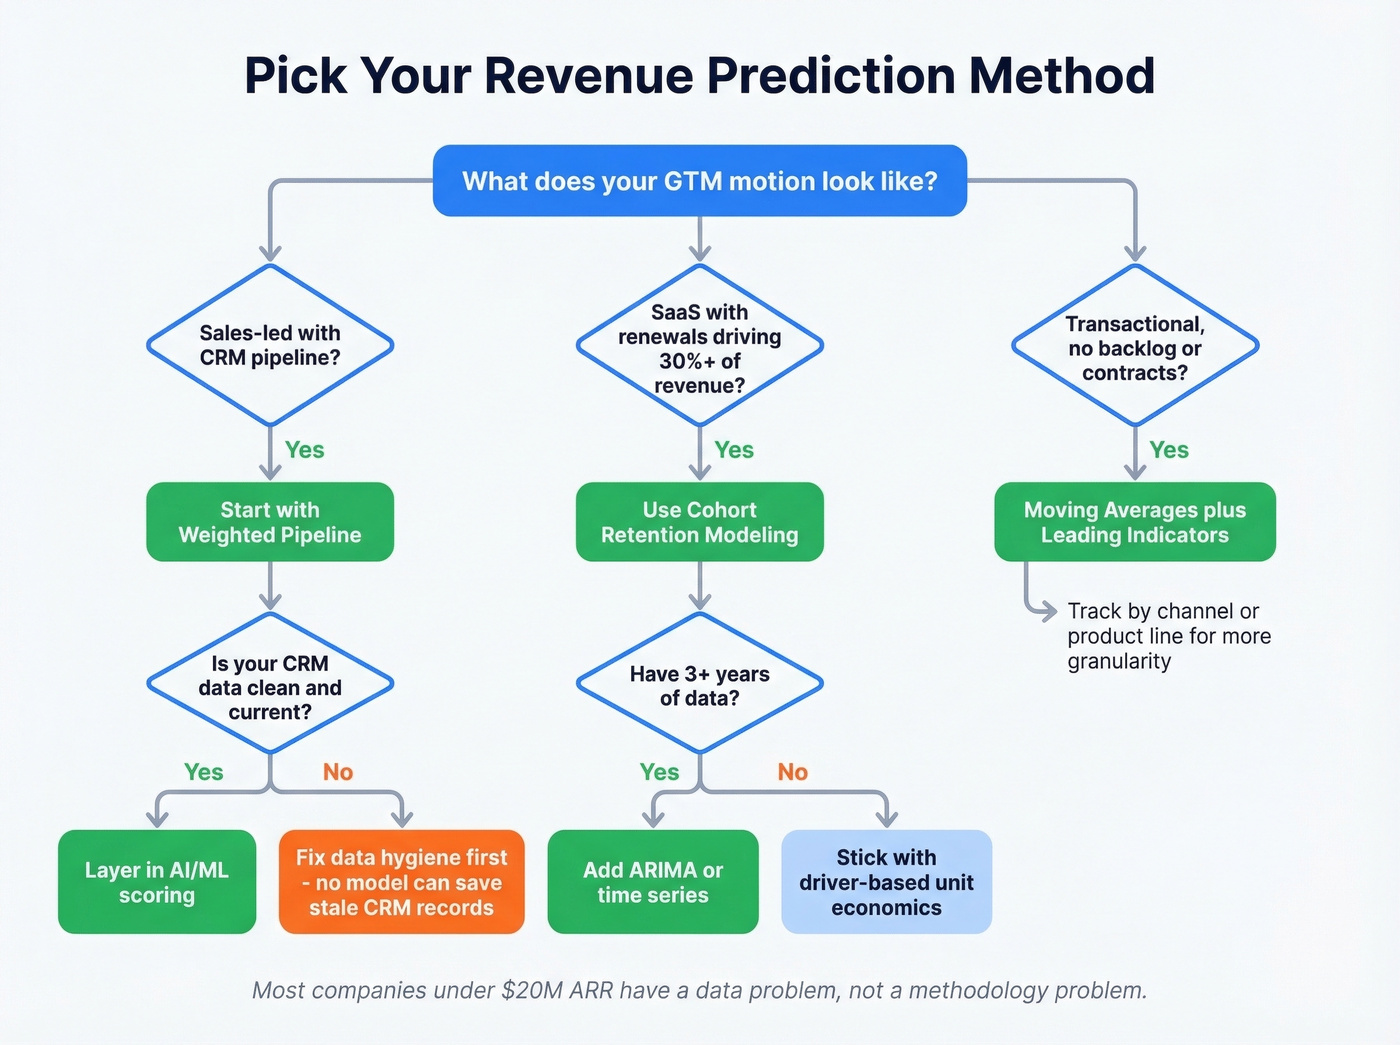
Let's be honest: most companies under $20M ARR don't have a forecasting methodology problem. They have a sales pipeline data hygiene problem. Upgrading from a spreadsheet to Clari won't help if a big chunk of your pipeline hasn't been updated in weeks.
Bad CRM data is the #1 reason revenue forecasts miss. Prospeo enriches your pipeline with 50+ verified data points per contact at a 92% match rate - refreshed every 7 days, not every 6 weeks.
Stop forecasting on stale data. Clean your pipeline first.
What Good Accuracy Looks Like
Most teams have no idea whether their forecast is good or bad. They just know it was "off."
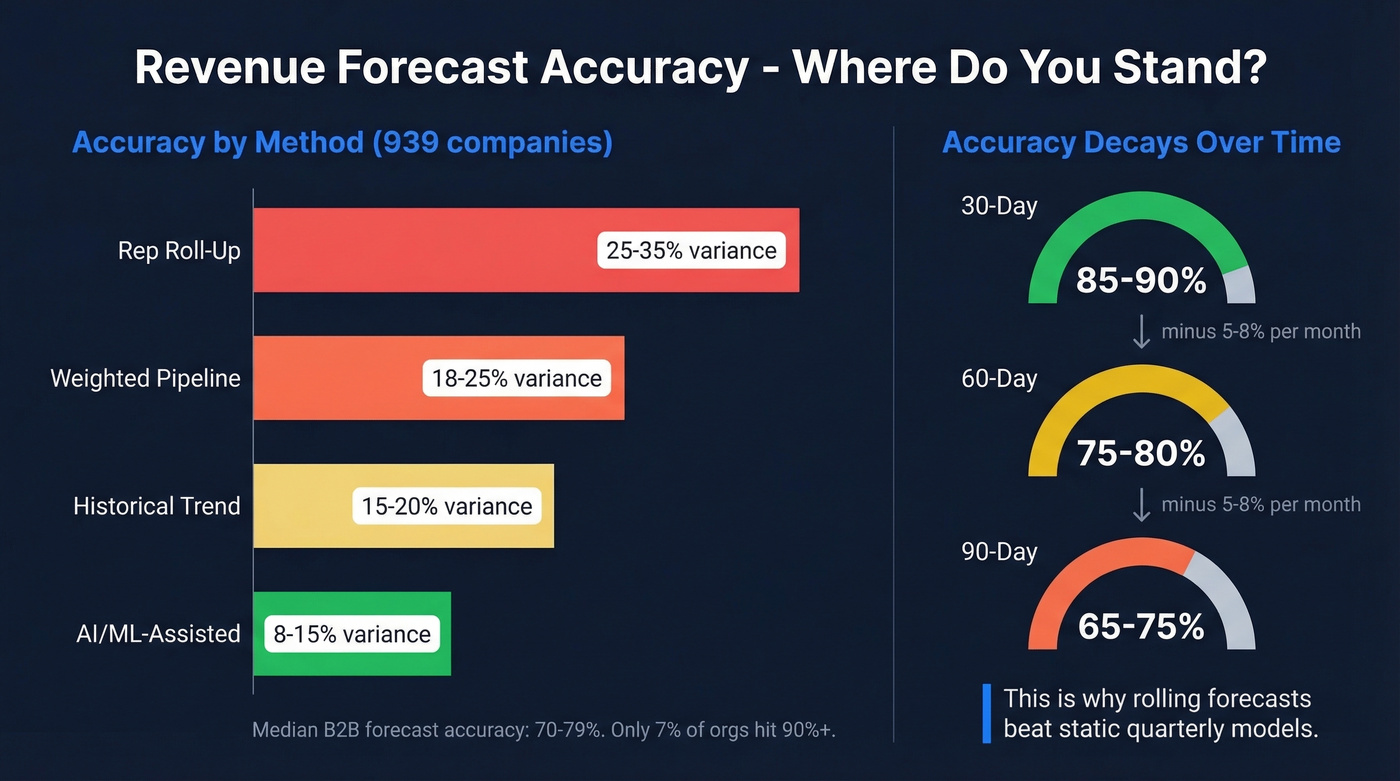
A benchmark study of 939 companies found these variance ranges by method:
| Method | Typical Variance (±) |
|---|---|
| Rep roll-up | 25-35% |
| Weighted pipeline | 18-25% |
| Historical trend | 15-20% |
| AI/ML-assisted | 8-15% |
The median B2B forecast accuracy sits at 70-79%. Only 7% of sales organizations achieve 90%+ accuracy. If your forecast is within 10-15%, you're already outperforming most of your peers.
Accuracy also decays with horizon length:
| Horizon | Accuracy Range | Decay Rate |
|---|---|---|
| 30-day | 85-90% | Baseline |
| 60-day | 75-80% | ~5-8%/month |
| 90-day | 65-75% | ~5-8%/month |
This is why rolling forecasts outperform static quarterly models. A forecast made on day 1 of the quarter is almost guaranteed to be worse than one updated weekly with fresh pipeline data.
Measuring Forecast Accuracy
You can't improve what you don't measure. And "we were off by a lot" isn't a measurement.
Core Metrics
MAPE (Mean Absolute Percentage Error) = mean(|Actual - Forecast| / Actual). It's the most common metric, but it has a fatal flaw: when actual values are small, MAPE explodes. A $5K miss on a $10K deal is 50% MAPE. That same $5K miss on a $500K deal is 1%.
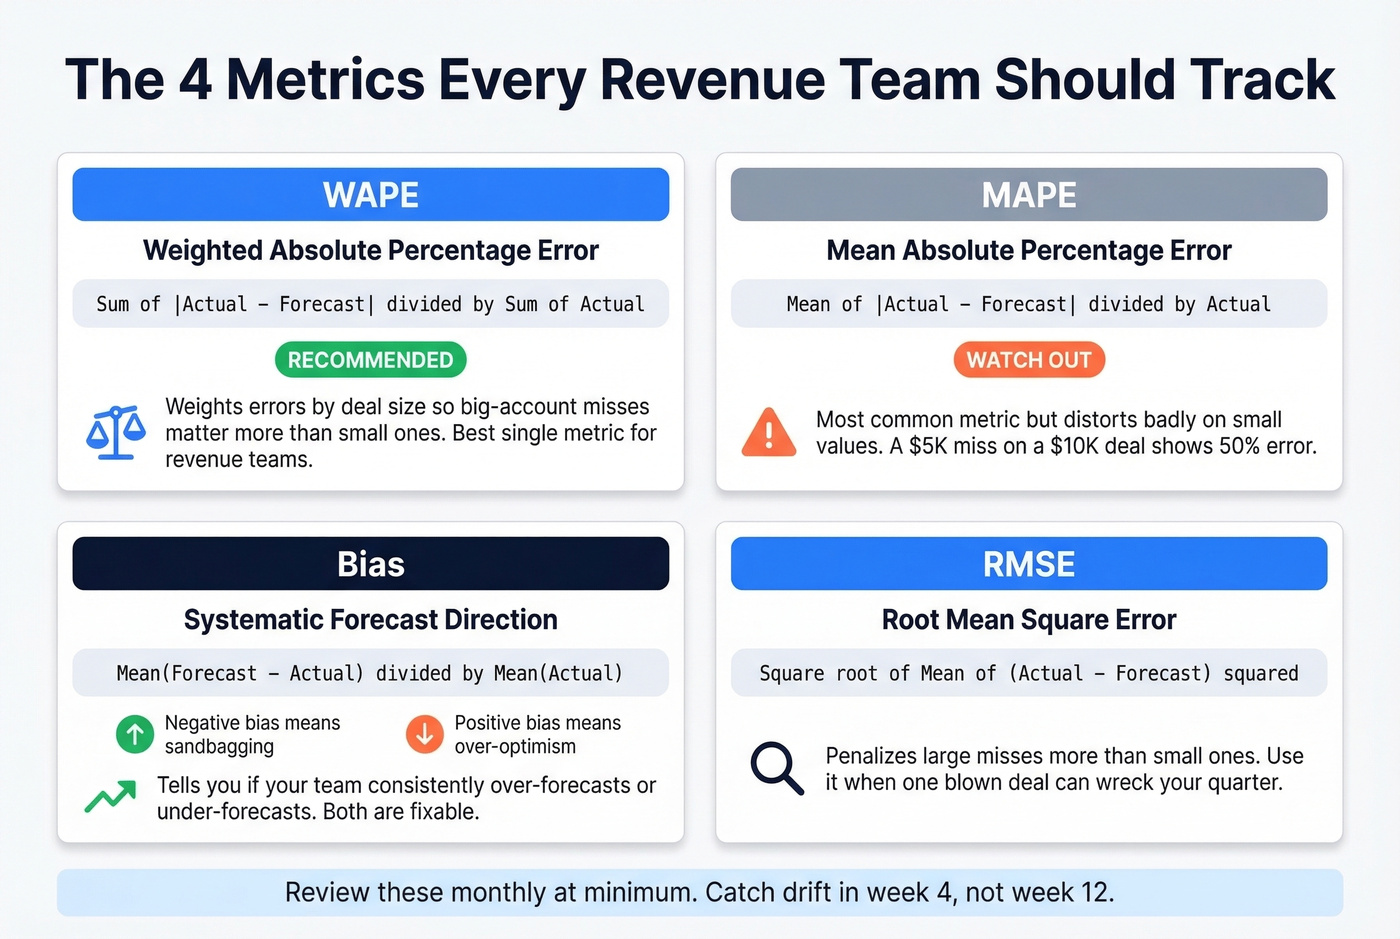
WAPE (Weighted Absolute Percentage Error) = sum of |Actual - Forecast| divided by sum of Actual. This is what we recommend for most revenue teams. It weights errors by deal size, so a miss on your largest accounts matters more than a miss on a $2K deal. That matches how your business actually works.
Bias = mean(Forecast - Actual) / mean(Actual). Tells you whether you're systematically over-forecasting or under-forecasting. Positive bias means your team is optimistic. Negative bias means they're sandbagging. Both are problems.
RMSE (Root Mean Square Error) penalizes large misses more heavily than small ones, which makes it useful when a single blown deal can wreck your quarter.
| Metric | Best For | Watch Out For |
|---|---|---|
| MAPE | Quick benchmarking | Distorts on small values |
| WAPE | Revenue-weighted accuracy | Requires deal-level data |
| Bias | Detecting systematic error | Doesn't show magnitude |
| RMSE | Flagging big misses | Hard to interpret alone |
| FVA | Proving process value | Needs a naive baseline |
Review these monthly at minimum so you can spot drift before it compounds.
Forecast Value Add (FVA)
Most teams never ask the uncomfortable question: is our forecasting process actually better than doing nothing? Forecast Value Add compares your model's accuracy against a naive baseline - typically last-year-same-period or a simple seasonal average.
If your elaborate model with 15 inputs and a weekly review cadence isn't beating "just use last year's number," you're adding process without adding value. That's more common than anyone wants to admit.
Remember the RevOps lead whose forecast was 22% off by March? If they'd been tracking FVA, they'd have caught the drift in week 4, not week 12. When FVA is negative, diagnose why: was the miss driven by price/volume/mix shifts, timing and recognition errors, or pipeline driver changes like win rate and cycle time? Slice your accuracy metrics by horizon - in-quarter, next quarter, full-year - because the drivers of error are different at each timeframe.
SaaS Revenue Prediction
SaaS forecasting is a different animal. You're not just predicting new sales - you're modeling a layered system of new business, renewals, expansions, downgrades, and churn. 29-53% of SaaS revenue comes from existing ARR, which means your renewal and expansion forecast matters as much as your new-business pipeline.
The first rule: don't mix everything into one pipeline. Create separate forecasts for new business, renewals, and expansion. Each has different drivers, different conversion rates, and different accuracy profiles. Mixing them produces a number that's wrong in ways you can't diagnose.
The basic MRR model is deceptively simple: start with current MRR, add expected new business MRR, subtract expected churn MRR, add expansion MRR. That's your baseline monthly forecast - annualize it for ARR.
Churn assumptions make or break SaaS forecasts. Use these benchmarks as starting points:
| Segment | Monthly Churn | Annual Equivalent |
|---|---|---|
| SMB | 5-7% | 46-58% |
| Mid-market | 2-4% | 22-39% |
| Enterprise | 0.5-1.5% | 6-17% |
Industry benchmarks put average annual SaaS churn at ~3.8% overall, or 4.9% for B2B SaaS. "Good" B2B churn is below 1% monthly.
Don't forget the revenue recognition distinction. A $120K annual contract booked in January isn't $120K of January revenue - it's $10K/month recognized over 12 months. Confusing bookings with recognized revenue is one of the fastest ways to produce a forecast that looks great on paper and falls apart in the P&L.
Your renewal forecast is only as accurate as the contact data behind it. If 20% of your customer contacts have stale emails, you can't even reach accounts to confirm renewal intent - and that gap shows up as "surprise churn" in your numbers. Tools like Prospeo that refresh CRM data on a 7-day cycle and verify emails at 98% accuracy help keep your pipeline grounded in reality rather than last quarter's org chart.

Mistakes That Kill Accuracy
We've seen every one of these destroy a forecast.
Hockey stick without a driver. If your Q4 projection assumes 3x Q3 growth, you need a specific mechanism - not hope. Tie every inflection to a named driver: new rep ramp, product launch, seasonal lift.
Ignoring churn. $100K MRR losing 5% monthly drops to ~$54K MRR by month 12. That's $46K/month in lost recurring revenue. Model gross and net churn separately, update monthly.
Revenue recognition confusion. That $120K annual contract is $10K/month, not a lump sum. Always forecast in recognized revenue, not bookings.
Static forecasts. A forecast built in January and never updated is fiction by March. Use rolling weekly or monthly updates.
Confirmation bias. Teams see the data that supports their number and ignore the rest. Track bias metric explicitly; rotate forecast ownership so no single person "owns" the narrative.
Overcomplicating the model. A 47-variable model nobody understands is worse than a 5-variable model everyone trusts. Start simple, add complexity only when it improves FVA.
Not updating assumptions is equally dangerous - your win rate from last year isn't your win rate in 2026. Refresh conversion rates and cycle times quarterly. And don't ignore external factors: macro shifts, competitor moves, and regulatory changes don't show up in historical data, so scenario-plan at least one downside case. If you aren't tracking WAPE or FVA, you can't tell whether your forecast is improving. Pick two metrics, measure monthly, report to leadership.
Revenue Prediction Tools
You don't need to spend tens of thousands a year on a platform to forecast revenue. But you might. Here's how the tools break down:
| Category | Tool | Starting Price | Notes |
|---|---|---|---|
| Revenue Intelligence | Clari | ~$30K-50K/yr | Enterprise forecasting + pipeline |
| Revenue Intelligence | Gong | ~$5K-50K/yr + $100-250/user/mo | Conversation intel + deal signals |
| FP&A / Forecasting | Anaplan | ~$50K+/yr | Enterprise planning, complex models |
| FP&A / Forecasting | Jirav | From $50/mo | Startup-friendly FP&A |
| FP&A / Forecasting | Vena | ~$1K-3K/mo | Excel-native planning platform |
| Lightweight / SMB | LivePlan | From $15/mo | Simple projections + dashboards |
| Lightweight / SMB | Zoho Finance Plus | From $249/mo | Bundled finance suite |
| Spreadsheets | Excel / Google Sheets | Free-~$12/user/mo | Still the most common tool |
Most companies under $10M ARR are forecasting in spreadsheets, and that's fine. The tool doesn't matter nearly as much as the process and data quality behind it.
Clari is worth the investment for enterprise sales orgs running complex multi-stage pipelines - it pulls signals from email, calendar, and CRM activity to give you a real-time view of deal health, and for large teams the ROI on avoided forecast misses pays for itself quickly. Skip it if you're under 50 reps or don't have the pipeline complexity to justify the price tag.
Jirav hits the sweet spot for startups that need real FP&A without Anaplan's price tag. Gong is less of a forecasting tool and more of a deal intelligence layer - useful if your forecast misses are driven by reps misreading buyer signals rather than bad data.
For teams where the problem isn't the model but the data feeding it, Prospeo fills a gap most forecasting guides ignore. With an 83% enrichment match rate and 50+ data points returned per contact, it keeps the CRM foundation under your forecast from rotting - which, as we've argued throughout this piece, matters more than the model itself.
If you want to go deeper on the data side, start with data enrichment and compare vendors in our guide to data enrichment services. For pipeline rigor, align your process to pipeline health and sanity-check against sales pipeline benchmarks. And if you're evaluating platforms, our breakdown of sales forecasting solutions and best sales forecasting tools can help you shortlist faster.
Pipeline-based forecasting only works when your pipeline reflects reality. With 98% email accuracy and 83% enrichment match rates, Prospeo ensures every deal in your CRM is tied to verified, reachable buyers.
Accurate predictions start with accurate contact data at $0.01 per lead.
FAQ
What's the difference between revenue prediction and forecasting?
In practice, they're interchangeable. "Prediction" leans toward data science and ML modeling, while "forecast" is the standard term in finance and sales operations. Use whichever term your CFO prefers - the underlying math is the same.
How accurate should a revenue forecast be?
Median B2B forecast accuracy is 70-79%, and only 7% of organizations hit 90%+. A realistic target is within 10% variance, measured by WAPE. Track improvement quarter over quarter rather than chasing a perfect number.
How often should you update revenue projections?
Monthly at minimum. For pipeline-based forecasts in high-velocity sales environments, weekly updates are standard. Rolling forecasts that continuously extend the horizon outperform static quarterly models by 5-10 percentage points in accuracy.
How do you build revenue projections from scratch?
Start with your historical revenue data - even six months is enough for a baseline. Identify your primary drivers (leads, conversion rate, average deal size), build a simple driver-based model in a spreadsheet, and validate it against the last two quarters of actuals. Layer in churn and expansion assumptions if you're SaaS, then measure accuracy with WAPE each month and iterate.