Revenue Projection Templates for Excel: Free Downloads + Build Your Own
Your co-founder just asked "when do we run out of money?" and you don't have a good answer. You're not alone - 38% of startups fail because they run out of cash or can't raise new capital. The fix isn't complicated: it's a revenue projection template in Excel that actually reflects your business, updated regularly, built on assumptions you can defend.
Quick Downloads
If you just want a free template and don't need the tutorial:
- Best all-around: SCORE Financial Projections Template - covers startups and small businesses with built-in diagnostics
- Best for fundraising: Equidam Financial Projections Template - clean, stakeholder-ready outputs in yearly and monthly versions
- Best for B2B sales teams: Gong Revenue Forecast Template - weighted pipeline method with coverage calculators
Or skip templates entirely. We'll teach you to build one from scratch below.
Forecast vs. Projection vs. Budget
These three terms get swapped constantly, and that causes real problems. They mean different things, and picking the wrong format for your audience will cost you credibility. Read more in Forecast vs. Projection vs. Budget.
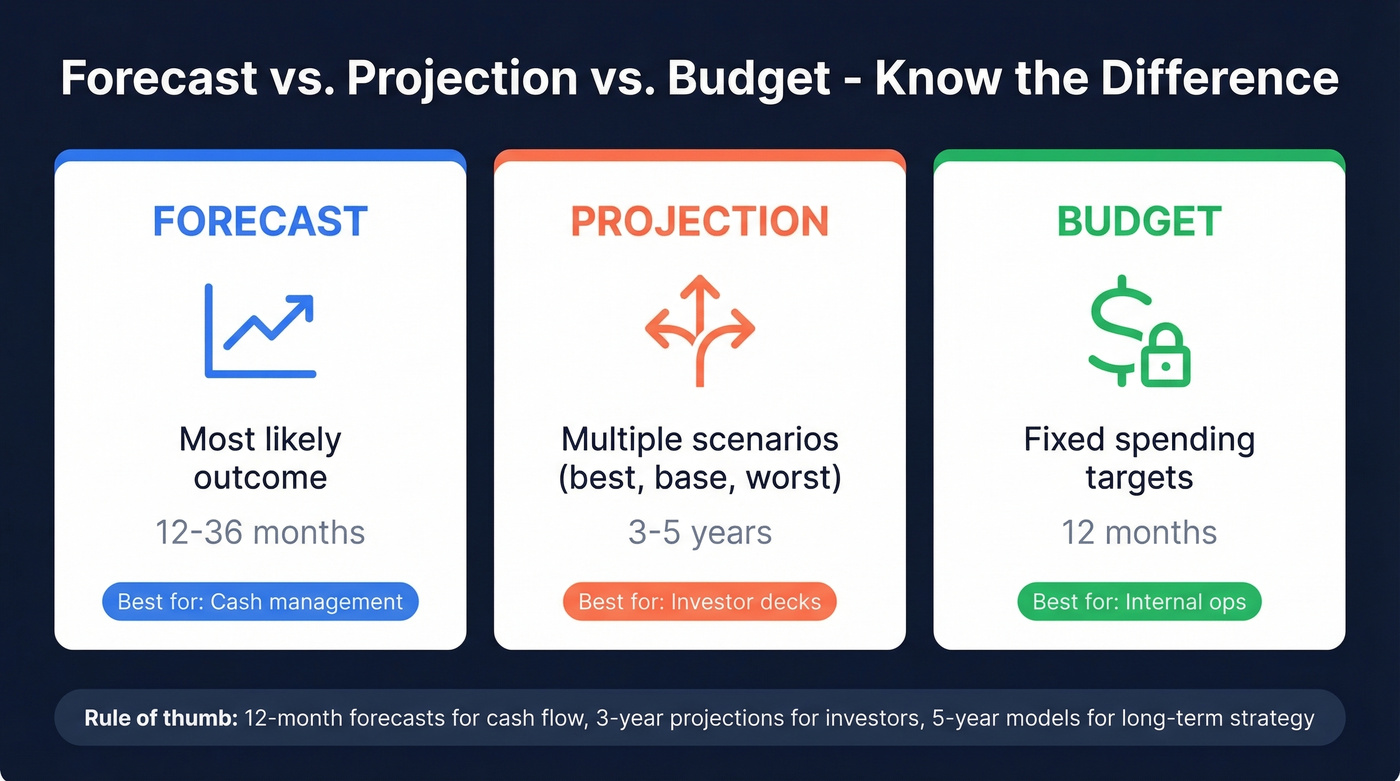
| Term | Definition | Time Horizon | Best For |
|---|---|---|---|
| Forecast | Most likely outcome | 12-36 months | Cash management |
| Projection | Multiple scenarios | 3-5 years | Investor decks |
| Budget | Fixed spending targets | 12 months | Internal ops |
The rule of thumb: 12-month forecasts for cash flow management, 3-year projections for investors, and 5-year models for long-term strategic planning. If a VC asks for "projections," they want scenarios - best case, base case, worst case - not a single-line prediction.
What Makes a Good Template
We've evaluated dozens of templates, and the gap between good and bad is enormous. OpenVC's author tested 12 SaaS financial models against 40+ criteria, and most failed on basics. Here's what separates the useful ones from the time-wasters:
Editable formulas are non-negotiable. Some templates lock cells, which defeats the purpose. SCORE's template ships locked but uses the unlock code "1234." If a template won't let you modify assumptions, skip it.
Monthly granularity for Year 1 matters because annual buckets hide cash flow problems. You need month-by-month visibility for at least the first 12 months, a 3+ year horizon for investors, and scenario comparison baked into the structure rather than bolted on as an afterthought. SaaS companies should look for native MRR, churn, CAC, and LTV tracking. And every number should trace back to a clearly labeled input cell - hidden assumptions are how projections become fiction.
The most common issues with free templates are locked formulas and missing cash flow. Every template below avoids both.
Best Free Revenue Projection Templates
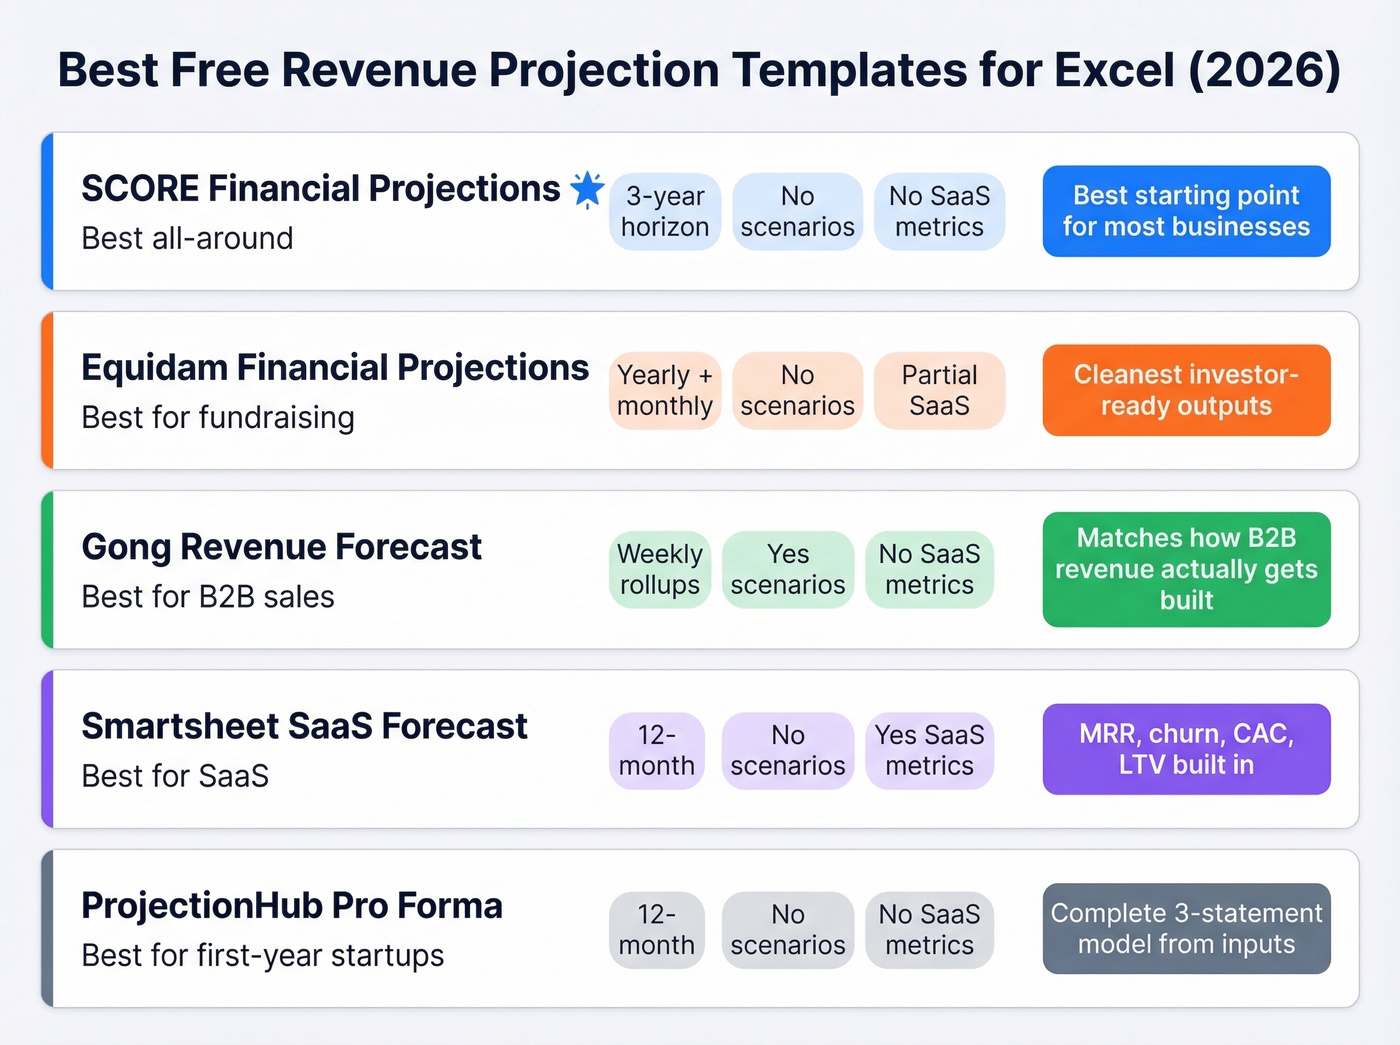
| Template | Best For | Horizon | Scenarios? | SaaS Metrics? |
|---|---|---|---|---|
| SCORE Financial Projections | All-around | 3 years | No | No |
| Equidam Financial Projections | Fundraising | Yearly + monthly | No | Partial |
| Gong Revenue Forecast | B2B sales teams | Weekly | Yes | No |
| Smartsheet SaaS Forecast | SaaS companies | 12-month | No | Yes |
| ProjectionHub Pro Forma | First-year startups | 12 months | No | No |
SCORE Financial Projections
The best starting point for most small businesses and early-stage startups. It covers startup expenses, sales forecasting, cash flow, income statements, and balance sheets in a single workbook. The built-in diagnostics flag common errors before you send it to anyone, which has saved us from embarrassing mistakes more than once. It won't handle SaaS-specific metrics natively, but for general revenue projection work, nothing free beats it.
Equidam Financial Projections
Built for forecasting revenue, costs, and runway with clean outputs you can share with stakeholders. You only fill in the green cells; everything else updates automatically. Equidam offers two versions: a yearly Fundraising Template and a monthly Budgeting Template.
Gong Revenue Forecast
This isn't a 3-statement financial model - it's a sales forecasting engine. It includes weekly forecast rollups, total pipeline coverage, weighted pipeline calculators, and a "needed pipeline" calculator that tells you how much pipe you need to hit target. For B2B sales orgs, this is the template that actually matches how revenue gets built.
The weighted-stage method is straightforward: deal value x win probability by stage. A $100K deal at 40% probability contributes $40K to your weighted forecast.
Smartsheet SaaS Sales Forecast
Purpose-built for subscription businesses with built-in formulas for MRR, churn rate, CAC, LTV, tier breakdowns, and net revenue retention. If you're running a SaaS company and need a revenue tracker that speaks your language out of the box, start here.
ProjectionHub 1-Year Pro Forma
A clean 12-month template that generates three financial statements from your inputs: income statement, cash flow forecast, and balance sheet. Revenue assumptions model by customer count, product mix, and pricing. Good for first-year startups that need a complete picture without multi-year complexity.
How to Build a Revenue Projection in Excel
Templates are great for speed, but building your own model teaches you where the assumptions live - and that's where projections go wrong. Here's the driver-based approach that actually holds up under investor scrutiny.
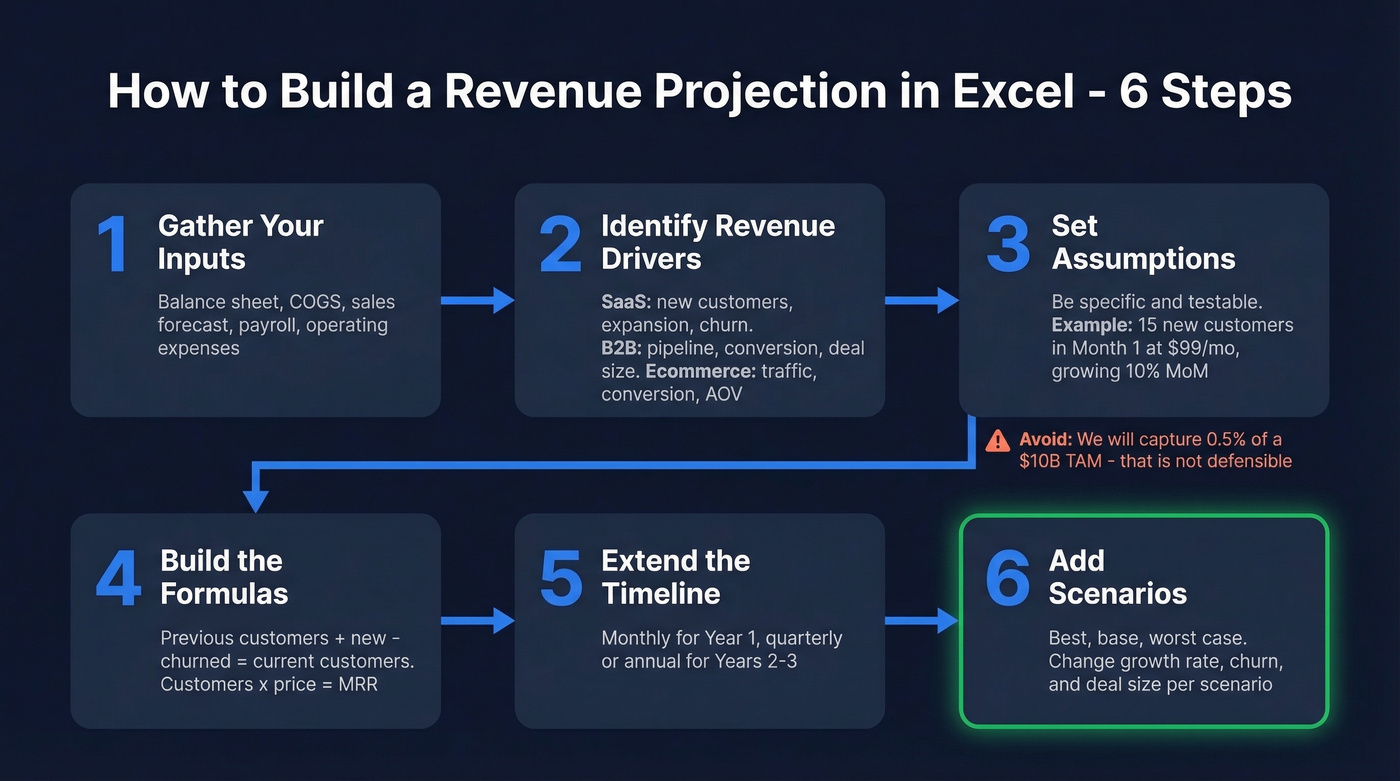
Step 1: Gather your inputs. The US Chamber recommends starting with your balance sheet, COGS, sales forecast, payroll, and operating expenses. If you're pre-revenue, you'll estimate most of these - that's fine, just label them as assumptions.
Step 2: Identify your revenue drivers. This is the critical step most templates skip. Don't start with revenue - start with what drives it. For a SaaS company, that's new customers, expansion revenue, and churn. For B2B sales, it's pipeline volume, conversion rates, and average deal size. For ecommerce, it's traffic, conversion rate, and average order value.
Step 3: Set your assumptions. Each driver gets a monthly assumption. Be specific: "We'll add 15 new customers in Month 1 at $99/mo, growing 10% month-over-month." That's a testable, defensible number. "We'll capture 0.5% of a $10B TAM" is not. (If you need to sanity-check your market sizing, use an addressable market framework.)
When you're presenting to investors, build investor-facing outputs from the start - net income, EBIT, EBITDA, and operating margin - so they flow directly from your assumptions without manual rework.
Step 4: Build the formulas. Here's a worked example for a SaaS model:
- Month 1: 50 customers x $99/mo = $4,950 MRR
- Month 2: (50 + 15 new - 3 churned) x $99 = $6,138 MRR
- Month 3: (62 + 17 new - 4 churned) x $99 = $7,425 MRR
Each month's customer count feeds from the previous month. Revenue is always customers x price.
Step 5: Extend the timeline. Drag your formulas out to 12 months with monthly granularity, then switch to quarterly or annual for Years 2-3. Monthly detail matters for cash flow; annual is fine for long-range strategy.
Step 6: Add scenarios. Use Excel's Scenario Manager (Data tab > What-If Analysis > Scenario Manager) to build best, base, and worst cases. Change 2-3 key assumptions per scenario - growth rate, churn rate, and average deal size are the usual levers.
Your revenue projection is only as accurate as the pipeline feeding it. Prospeo gives B2B sales teams 300M+ verified contacts with 98% email accuracy - so your weighted forecasts reflect real opportunities, not dead leads.
Stop projecting revenue from a pipeline full of bad data.
Revenue Models by Business Type
SaaS: MRR/ARR Roll-Forward
The standard SaaS revenue model is an ARR roll-forward: Starting ARR + New ARR + Expansion ARR - Downgrade ARR - Churn ARR = Ending ARR. Ending ARR becomes next month's starting figure. New ARR is modeled as deals acquired x ARPU.
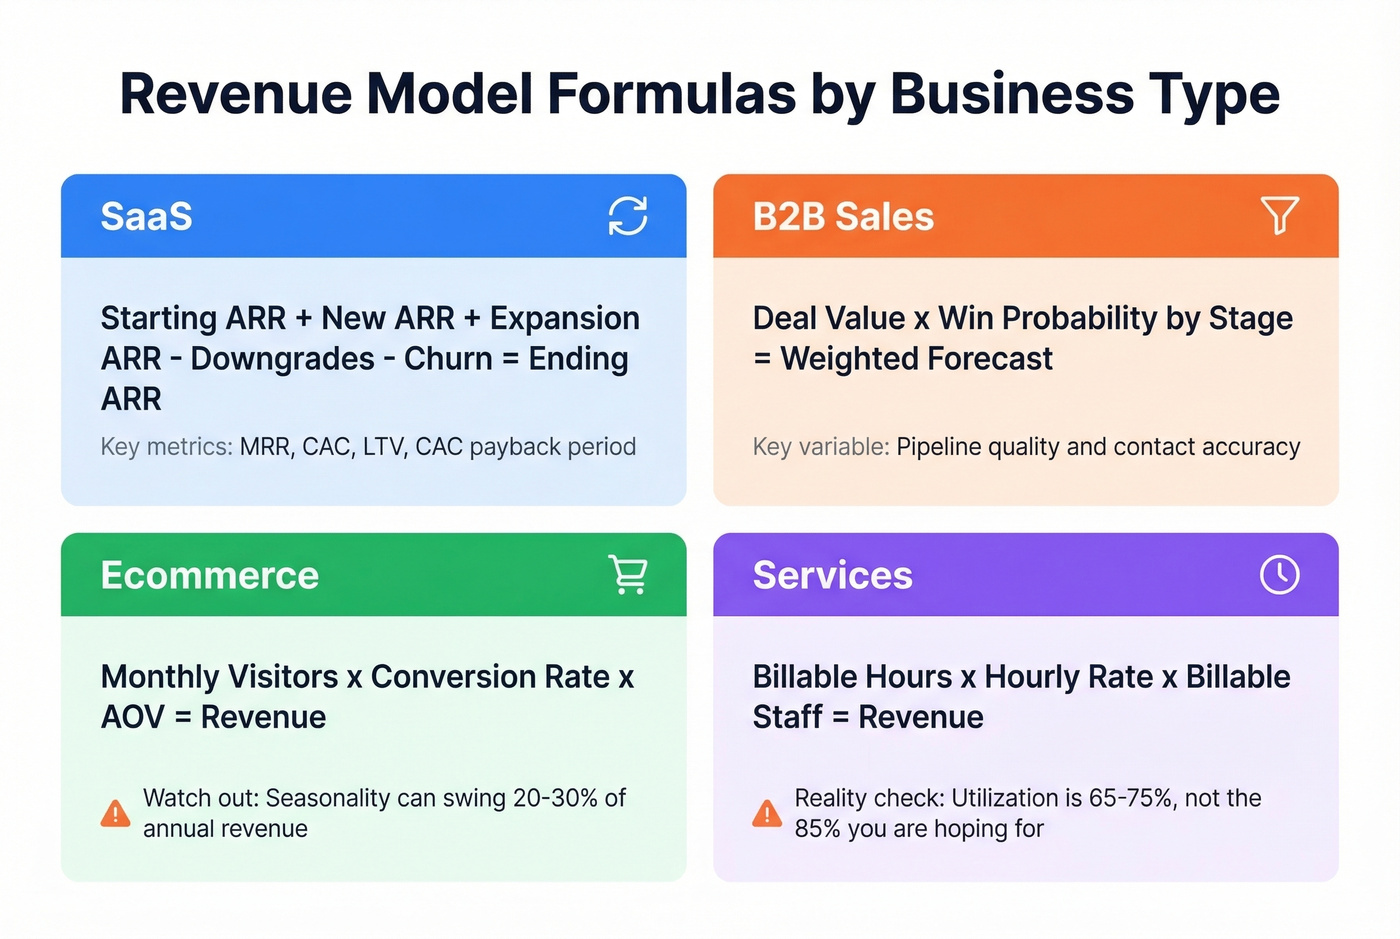
Customer counts roll forward the same way - add new, subtract churned. Track unit economics alongside revenue: CAC, LTV, and CAC payback period. Investors will ask for all three. (If you need a tighter churn section, use a dedicated churn analysis workflow.)
B2B Sales: Weighted Pipeline
Weighted pipeline forecasting is the most reliable method for B2B teams. Deal value x win probability at each stage. Simple math, but only if the inputs are real.

Here's the thing: your projection is only as good as the pipeline feeding it. We've seen teams build gorgeous 5-year models on top of CRMs full of stale emails and disconnected phone numbers. That's not a forecast - it's creative writing. When half your contacts are unreachable, your "weighted pipeline" is fiction dressed up in a spreadsheet. Tools like Prospeo, with 98% email accuracy and a 7-day data refresh cycle, close that gap between what your CRM says and what's actually reachable.
That Gong forecast template needs real pipeline to work. Prospeo's 30+ search filters - buyer intent, headcount growth, funding, technographics - let you build the exact pipeline your revenue model demands, at $0.01 per email.
Fill your pipeline coverage gap with contacts that actually convert.
Ecommerce: Traffic x Conversion x AOV
Monthly Visitors x Conversion Rate x Average Order Value = Revenue. Model each variable separately - traffic from paid vs. organic, conversion by channel, AOV by product category.
Seasonality matters here more than in any other model. Black Friday alone can account for 20-30% of annual revenue for some DTC brands, so use monthly granularity year-round and don't average your way into a false sense of security.
Services: Utilization x Rate x Headcount
Most agencies overestimate utilization at 85%+. In reality, industry benchmarks typically land at 65-75%. That gap will blow up your financial projection.
The formula: Billable Hours per Person x Hourly Rate x Number of Billable Staff = Revenue. The key variable is utilization rate - the percentage of available hours that are actually billable. Model hiring plans alongside revenue to keep the two in sync.
Excel Formulas Cheat Sheet
| Function | Syntax | Use Case |
|---|---|---|
| FORECAST.LINEAR | FORECAST(x, y's, x's) |
Simple linear trend |
| FORECAST.ETS | FORECAST.ETS(date, y's, dates) |
Exponential smoothing with seasonality |
| FORECAST.ETS.CONFINT | Same + confidence level | Confidence bands |
Common errors: mismatched array lengths throw #N/A, non-numeric x values throw #VALUE!, and zero variance in your x data throws #DIV/0!. Check your data ranges first.
For automated forecasting, select your historical date and value columns, go to Data > Forecast Sheet, set your end date, and click Create. Excel builds a new worksheet with a forecast table and chart using the AAA version of Exponential Smoothing. Turn on "Include Forecast Statistics" to see error metrics like MASE and SMAPE.
Five Mistakes That Kill Credibility
1. Top-down fantasy math. "The market is $10B, we'll capture 0.5%" is the fastest way to lose an investor's attention. TAM x market share is garbage. Use bottom-up, driver-based modeling instead.
2. Ignoring churn. A 5% monthly churn rate means you lose over half your customer base in a year. If your projection shows only new revenue without modeling losses, it's fiction.
3. Linear cost assumptions. Costs don't scale linearly with revenue. Hiring happens in steps, server costs have thresholds, and customer support needs spike at certain volumes. Model costs in tiers, not percentages.
4. No scenario planning. A single-line projection tells investors you haven't thought about what could go wrong. Always present best, base, and worst cases with clearly labeled assumption changes.
5. Confusing revenue with cash. A startup can be profitable on paper but bankrupt in reality if cash timing doesn't cover expenses. Your projection needs a cash flow component, not just an income statement. Pair it with a revenue report template that tracks actual vs. forecasted numbers so you can spot divergence early.
Sanity-Check Your Assumptions
Before you present your projection to anyone, benchmark it against reality. A Chief Executive Research survey of 1,030 companies found average expected revenue growth of 7.9% in 2026. If your base case shows 40% growth and you're not in hypergrowth SaaS, you need to justify the gap.
Let's be honest: most startups don't need more sophisticated models. They need more honest assumptions. A beautifully formatted 5-year projection built on fantasy growth rates is worth less than a napkin sketch with defensible numbers. Start with what you can prove, then extend.
Over one-third of companies reforecasted revenues mid-year in 2025 due to market volatility. Your projection isn't a one-time exercise. Update it quarterly at minimum, and target 12-18 months of runway in your cash flow model. If your projection shows you running out of cash in 8 months, that's not a spreadsheet problem - it's a fundraising emergency.
Excel vs. Google Sheets
| Feature | Excel | Google Sheets |
|---|---|---|
| Power Query / Pivot | Yes | No |
| VBA Automation | Yes | No |
| Forecast Sheet | Yes | No |
| Large Datasets | Strong | Struggles |
| Real-Time Collab | Limited | Excellent |
| Price | Paid (or M365) | Free |
For simple models and team collaboration, Google Sheets works fine. But for serious financial modeling - anything involving Power Query, VBA macros, the Forecast Sheet, or datasets over 50K rows - Excel is still the better tool, and it's not close. Build your revenue projection template in the Excel desktop app, then share a view-only Sheets version if your team needs to comment.
If you're building projections for a sales-led motion, it also helps to track pipeline health and align your model to real sales pipeline benchmarks.
FAQ
How far out should a revenue projection go?
Twelve months for cash management, three years for investors, five years for strategic planning. Match the horizon to your audience - a VC expects 3-5 years with scenario analysis, while your CFO needs monthly cash flow visibility for the next 12 months.
What's the difference between a forecast and a projection?
A forecast predicts the single most likely outcome based on current trends. A projection models multiple scenarios with different assumptions driving each. Investors want projections because they show you've stress-tested your numbers against downside risk.
Can I use Google Sheets instead of Excel?
For simple 12-month models with basic formulas, yes. For anything involving Power Query, VBA automation, the Forecast Sheet, or datasets over 50K rows, Excel is significantly better for financial modeling.
How often should I update my projection?
Quarterly at minimum. Over a third of companies reforecasted mid-year in 2025 due to market shifts. If you're pre-revenue or in a volatile market, monthly updates aren't overkill - they're survival.
How do I fill a B2B pipeline to make projections realistic?
Start with verified contact data. Your weighted pipeline forecast is meaningless if half the contacts bounce. Prospeo provides 98%-accurate emails refreshed every 7 days, with 125M+ verified mobile numbers, so your pipeline numbers reflect actual reachable prospects rather than wishful thinking.
Build driver-based, update quarterly, use real data. That's the whole game.