Sales Analytics: Benchmarks, Tools, and Mistakes Nobody Talks About
69% of B2B reps fell short of quota in the most recent Ebsta/Pavilion benchmark study. Win rates have dropped 18% compared to 2022. 57% of sales professionals say the sales cycle is getting longer. And yet 73% of sales organizations still can't extract insights fast enough to impact live deals. If your sales analytics still amount to gut feel and end-of-quarter pipeline reviews, you're flying blind into a headwind.
The teams pulling ahead aren't working harder - they're measuring different things, faster. More analysts are moving into revenue operations roles, and "Sales Data Analyst" has become a standard title on RevOps org charts. The reason is simple: reps spend roughly 60% of their time on non-selling tasks, and the organizations that use data to reclaim even a fraction of that time are separating from the pack.
The Short Version
Five metrics that actually matter: win rate, pipeline velocity, quota attainment, average deal size, and sales cycle length. Everything else is a derivative or a vanity metric until these five are solid.
The stack that works:
- CRM (Salesforce, HubSpot, or Pipedrive) as your system of record
- Sales BI / visualization (Tableau or Power BI) as your reporting layer
- Revenue intelligence (Gong, Clari, or Salesloft) for coaching and forecasting
- Data enrichment as your data quality layer
The prerequisite most teams skip: fix your CRM data before you build a single dashboard. If 19% of your company data is inaccessible and your contact records are stale, no amount of AI or visualization will save you.
What Sales Analytics Actually Is
Sales analytics is the practice of collecting, analyzing, and acting on sales data to improve performance, forecast revenue, and identify what's working across your pipeline. It's not the same as sales intelligence, which focuses on gathering external data about prospects and markets. Analytics looks inward at your own sales motion. Intelligence looks outward at your buyers.
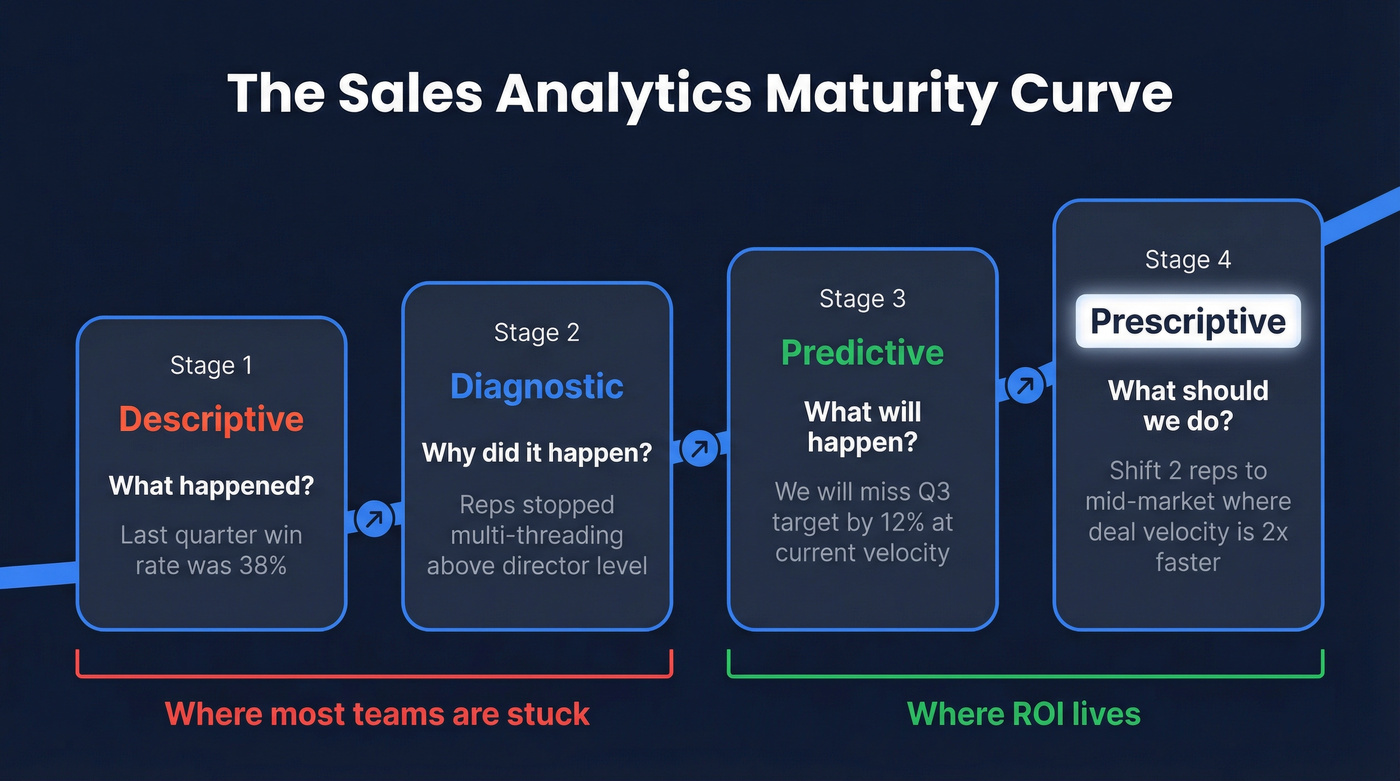
There are four types, and they form a maturity curve:
Descriptive answers "what happened?" - last quarter's win rate was 38%. Diagnostic answers "why?" - win rates dropped because reps stopped multi-threading above the director level. Predictive answers "what will happen?" - based on current pipeline velocity, we'll miss Q3 by 12%. It also includes negative forecasting: modeling risk scenarios like losing your two biggest deals or a key segment tanking. Prescriptive answers "what should we do?" - shift two reps to the mid-market segment where deal velocity is 2x faster.
Most teams are stuck at descriptive. The ones generating real ROI have pushed into predictive and prescriptive territory, and that's where the tooling conversation gets interesting.
Fix Your Data First
Here's the thing: 84% of data and analytics leaders agree that AI outputs are only as good as the data inputs. Yet sales leaders estimate 19% of their company data is completely inaccessible. Only 55% of sales teams standardize metrics across business units, regions, and teams. A third of companies still move some or all of their data manually between systems.
This is the gap nobody wants to talk about. Teams buy Gong, spin up Tableau dashboards, and invest in AI forecasting - then wonder why the numbers don't match reality. The answer is almost always the same: the CRM data feeding those tools is incomplete, outdated, or flat-out wrong.
Before you build a single dashboard, audit your CRM for three things: bounce rates on email addresses, missing fields like direct dials and job titles and company size, and duplicate records. If your email bounce rate is above 5%, your contact data is a liability, not an asset.
Metrics That Matter (With Benchmarks)
Here's what to actually measure, organized by funnel stage. The benchmarks come from RAIN Group, RepVue, Outreach, and Ebsta/Pavilion, so you can calibrate where your team sits.
Top of Funnel
Lead volume, MQL-to-SQL conversion rate, and speed-to-lead are your leading indicators. They tell you what's coming before it hits the pipeline.
Most teams track lead volume but ignore response time, which is a costly mistake. Leads contacted within five minutes are 21x more likely to qualify than those left for 30 minutes. The average MQL-to-SQL conversion rate across B2B sits between 13% and 27% depending on industry - if you're below that range, the problem is upstream of your sales team.
Mid-Funnel
Pipeline velocity is the metric that ties everything together at this stage:
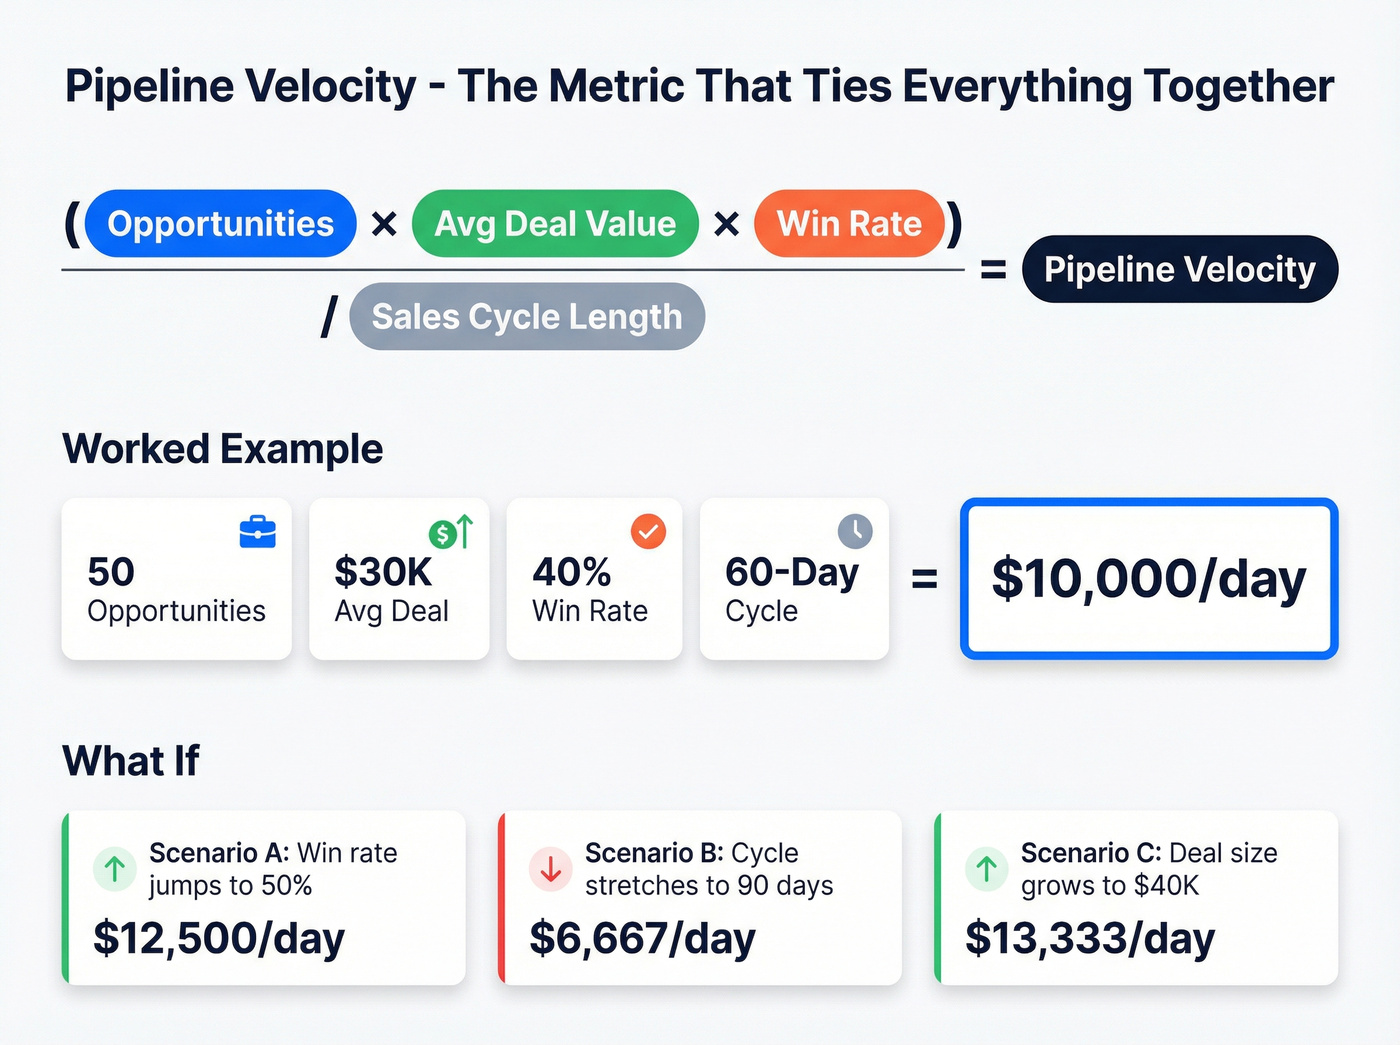
Pipeline Velocity = (# of Opportunities x Average Deal Value x Win Rate) / Sales Cycle Length
Worked example: 50 opportunities at $30K average deal value, a 40% win rate, and a 60-day sales cycle gives you $10,000/day in pipeline velocity. Change any one variable and the number shifts dramatically, which is exactly why this metric is so useful for diagnosing bottlenecks.
Deal age is the silent killer. Outreach's data shows deals closed within 50 days have a 47% win rate versus 20% for deals that drag beyond 50 days. If your average deal is aging past your historical close window, it's probably already dead - your reps just haven't admitted it yet.
Bottom of Funnel
Win rate, quota attainment, average contract value, and customer lifetime value. These are your lagging indicators - they tell you what already happened. The danger is managing exclusively on lagging indicators, which is like driving by looking in the rearview mirror.
Benchmark Reference Table
| Metric | Benchmark | Source |
|---|---|---|
| Avg win rate | 47% | RAIN Group (472 orgs) |
| Elite win rate (top 7%) | 74% | RAIN Group |
| Top 20% win rate | 62% | RAIN Group |
| Everyone else | 40% | RAIN Group |
| Quota attainment | 43.5% | RepVue |
| Reps missing quota | 69% | Ebsta/Pavilion |
| Win rate on deals under 50 days | 47% | Outreach |
| Win rate on deals over 50 days | 20% | Outreach |
| Revenue from top 17% of reps | 81% | Ebsta/Pavilion |
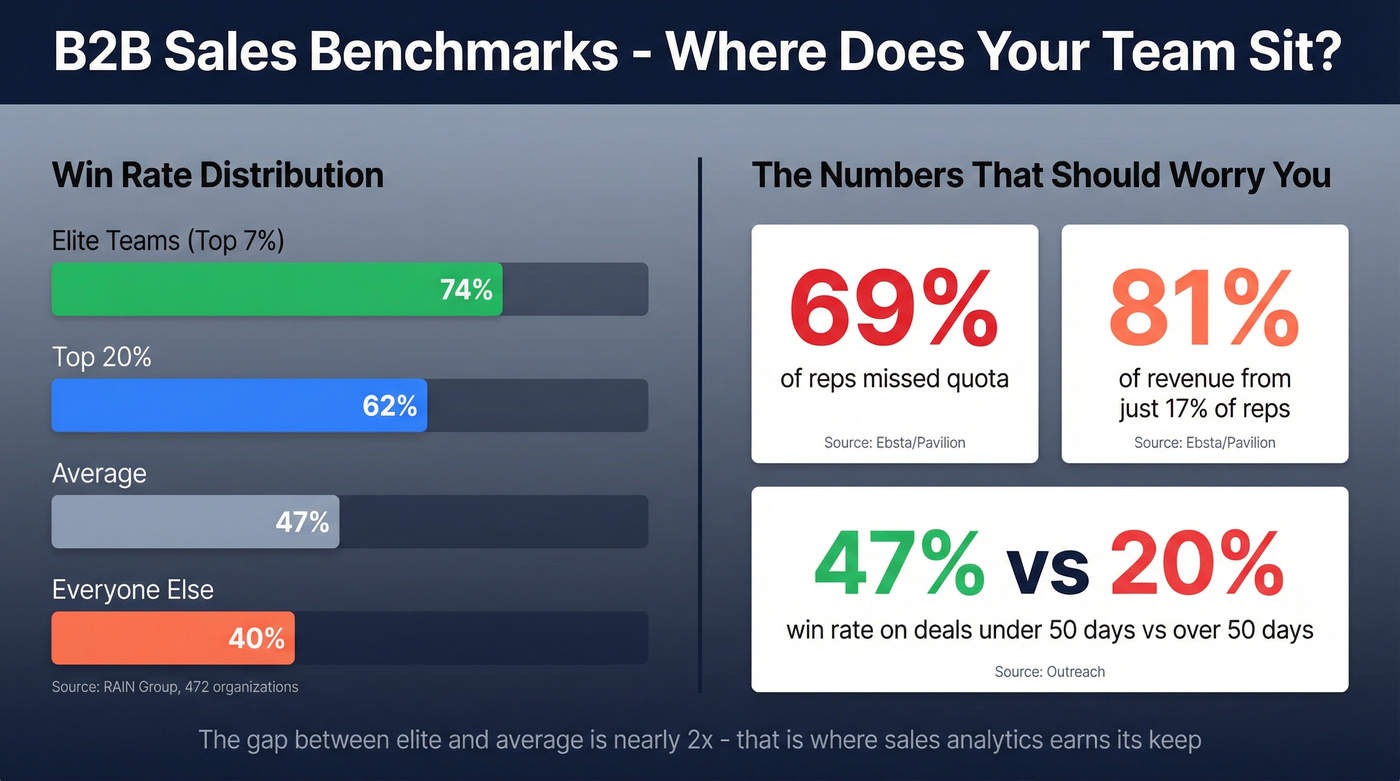
The spread between elite and average is enormous. A 74% win rate versus 40% isn't a marginal difference - it's nearly 2x. That gap is where sales analytics earns its keep: identifying what top performers do differently and systematizing it across the team.
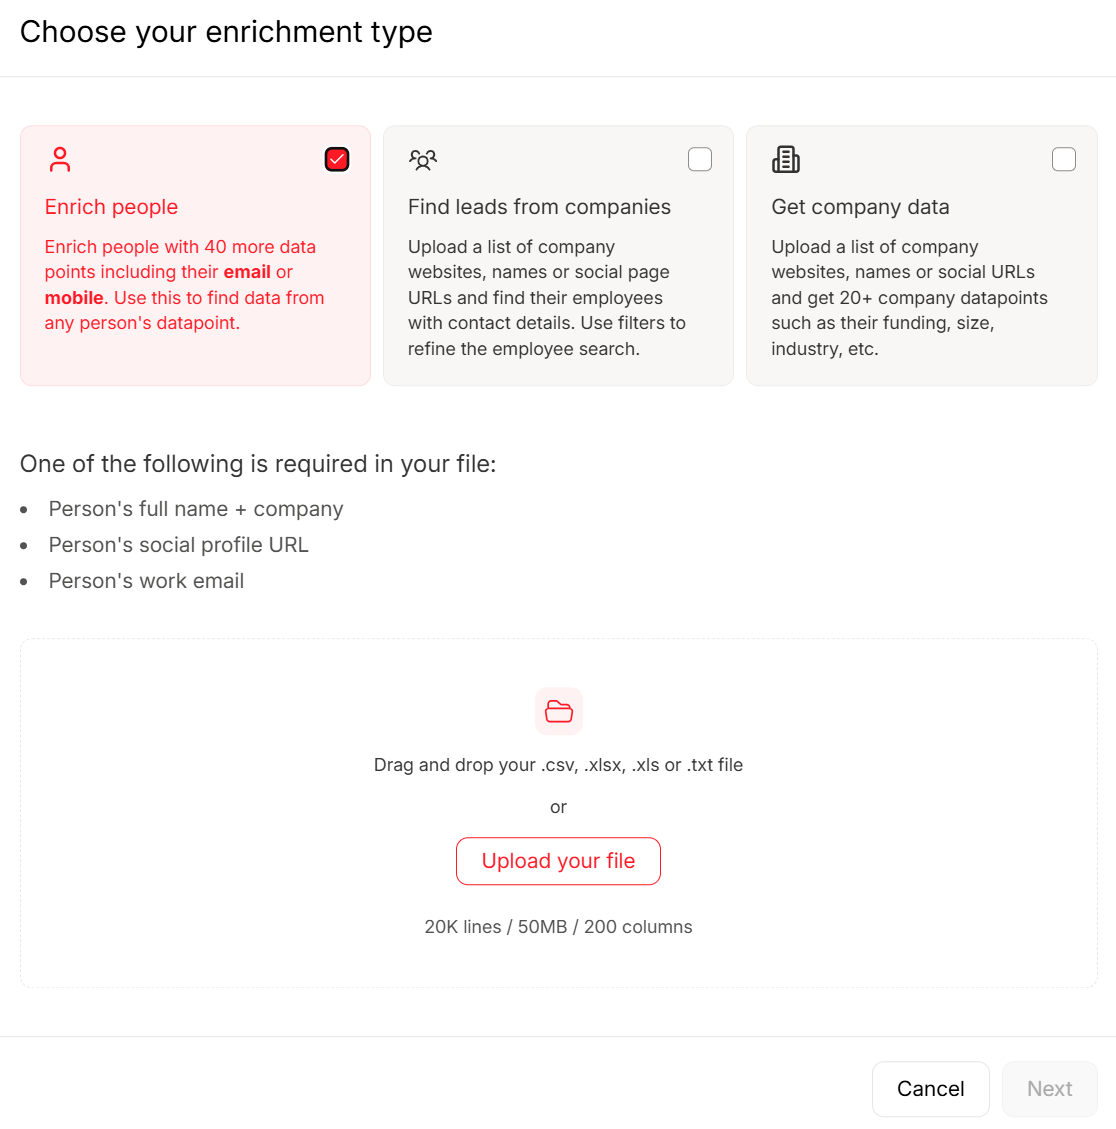
You just read it: 19% of company data is inaccessible and bad CRM data kills every dashboard downstream. Prospeo's enrichment engine fills missing emails, direct dials, and job titles across your entire CRM - 92% match rate, 50+ data points per contact, refreshed every 7 days.
Fix the data layer before you build another dashboard.
Sales Analytics in Practice
A practitioner on r/analytics described their core deliverables: sales scorecards for manager performance evaluation, a weekly pipeline dashboard, and a lead management system that tags leads as high, medium, or low priority based on conversion likelihood. That maps to what we see working across most B2B orgs. The title on the org chart might say "Sales Data Analyst," "Revenue Analyst," or "Sales Ops Manager" - the deliverables are the same regardless.
Cadence matters as much as content. Weekly pipeline reviews catch deals going stale. Monthly scorecards surface coaching opportunities. Quarterly deep-dives reveal structural issues like territory imbalance, segment underperformance, and pricing problems.
The "hero rep" problem is the most underappreciated crisis in B2B sales. When 17% of your reps generate 81% of revenue, your analytics need to answer a specific question: what are those reps doing that the other 83% aren't? Is it deal selection? Multi-threading? Faster follow-up? Without data, you're guessing. With it, you can build playbooks. McKinsey's research backs this up - organizations that refine strategies based on sales-behavior insights see roughly 20% improvements in sales productivity.
Analytics as Coaching, Not Surveillance
Let's be honest: the fastest way to kill an analytics initiative is to make reps feel like they're being watched. We've seen teams roll out beautiful dashboards that reps actively avoid because the data is used to punish rather than coach.
The fix is straightforward - share the same dashboards with reps and managers. When a rep can see their own pipeline velocity compared to the team median, they self-correct. When only the manager sees it, it becomes a gotcha tool. Frame analytics as "here's how to hit your number" and adoption follows. Frame it as "here's how we'll know you're slacking" and you'll get sandbagged CRM data that makes every downstream metric worthless.
Rippling's analytics team offers a useful case study here. By creating canonical metric definitions and standardizing data transformation, they saw a 10x increase in employees using their analytics platform and a 50% decrease in time-to-insight. The lesson: don't just build dashboards. Build shared definitions first. If "pipeline" means something different to marketing and sales, your dashboards are lying to both teams.
How AI Changes Sales Data Analysis
AI in sales has more vendor hype than verified results. Here's what the numbers actually say.
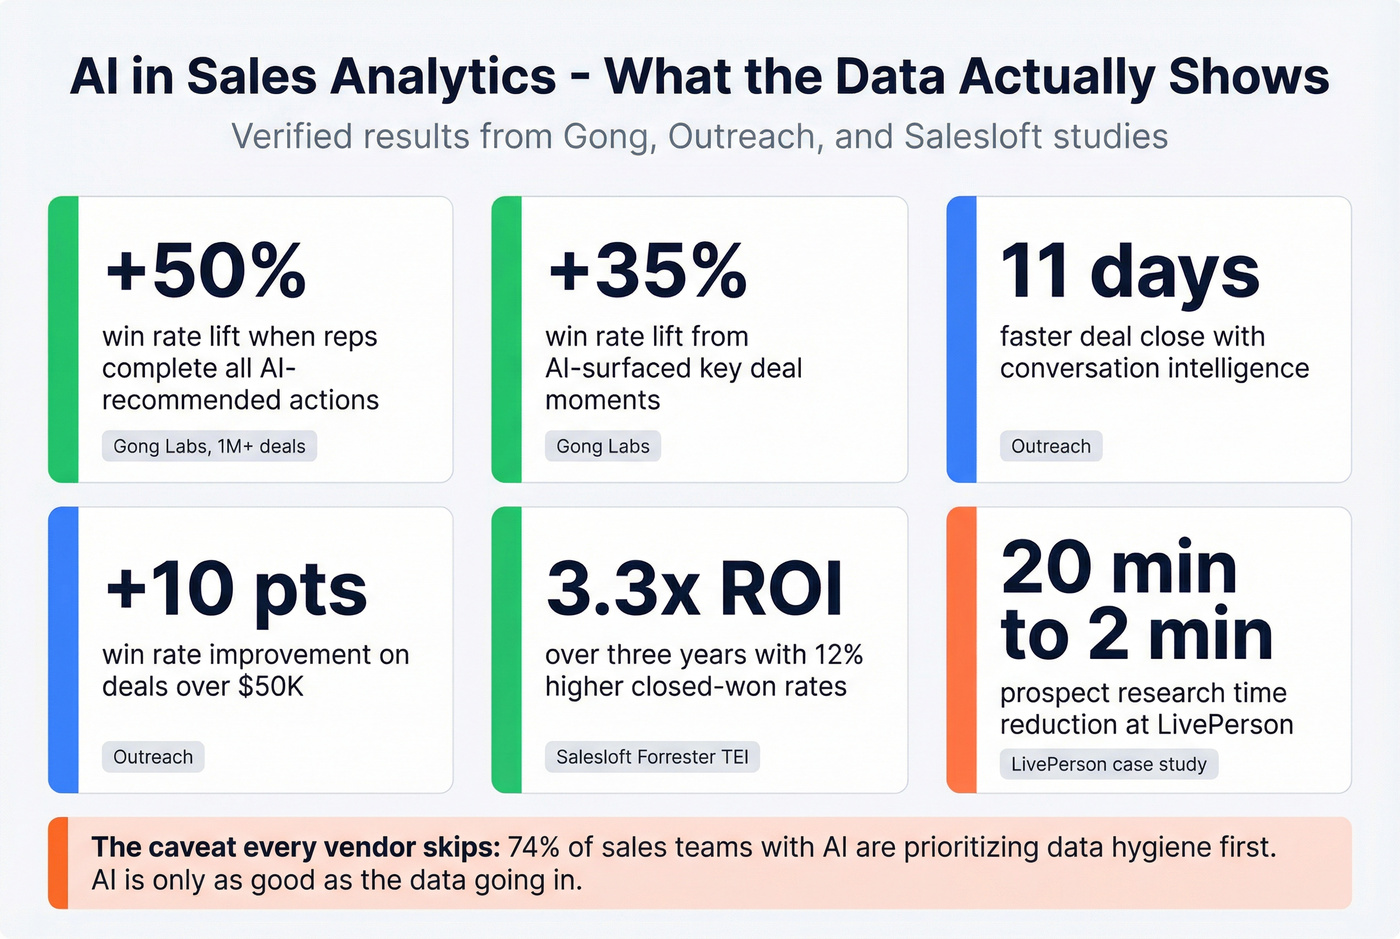
Gong Labs analyzed over 1 million sales opportunities across 1,418 organizations. Deals where reps completed all AI-recommended to-dos saw win rates increase by 50%. Using AI to surface key deal moments correlated with a 35% win-rate lift. And when reps used Gong's "Ask Anything" feature on a deal, win rates jumped 26%.
Outreach's data tells a similar story. Teams using conversation intelligence close deals 11 days faster on average, with a 10 percentage-point win-rate improvement on deals over $50K. Among teams using AI SDR tools, 100% report saving time on prospecting, and 40% save 4-7 hours per week. LivePerson cut prospect research time from 20 minutes to 2 minutes per prospect and saw a 35% lift in engagement rates.
Salesloft's Forrester TEI study reported 3.3x ROI over three years, with 12% higher closed-won rates, 50% higher conversion from engagement to opportunity, and a 40% increase in selling activity without adding headcount.
But here's the caveat every vendor conveniently omits: every one of those numbers comes from teams with clean, structured data feeding the AI. The stat that should sober you up - 74% of sales teams with AI are prioritizing data hygiene specifically to support it. They know the AI is only as good as what goes in. We've seen teams deploy AI forecasting tools on top of CRMs where 30% of contacts have bounced emails and half the opportunity stages are mislabeled. The AI dutifully produces forecasts. They're just wrong.
AI amplifies the quality of your data, for better or worse.
7 Mistakes That Kill Analytics ROI
1. Incomplete or inaccurate data. If your CRM is full of stale contacts and missing fields, every metric you calculate is built on sand. This is mistake number one for a reason.
2. Ignoring leading indicators. How many teams do you know that obsess over closed-won revenue but can't tell you their average speed-to-lead? Response rates, demo bookings, and follow-up cadence tell you what's coming. Win rate and revenue tell you what already happened.
3. Not segmenting. A blended win rate across all segments hides the real story. Break it down by industry, deal size, geography, and customer type. The insights live in the segments.
4. Dashboard overload. A common thread on r/salesops: teams build 15 dashboards that nobody checks. That's worse than having three that everyone uses. Adoption is the only KPI that counts at launch.
5. No clear KPIs before building. Starting with "let's build a dashboard" instead of "what question are we trying to answer?" produces pretty charts and zero decisions. Define the question first.
6. Skipping periodic audits. Data decays faster than most teams realize. People change jobs, companies get acquired, phone numbers go stale. If you aren't auditing and re-enriching quarterly at minimum, your analytics are degrading in real time. One-time cleanups don't stick.
7. Overreliance on historical data. Past performance doesn't predict future results when markets shift. Layer in forward-looking signals - intent data, pipeline creation trends, leading indicators - to avoid driving by the rearview mirror.
Skip mistake #4 if you want: build 15 dashboards. But I promise you'll end up consolidating to five within two quarters. Every team does.
Sales Analytics Tools (With Pricing)
The right tool stack depends on your team size and existing infrastructure, but the selection criteria are universal: bidirectional CRM sync, ease of adoption, and integration depth. If a tool doesn't plug into your stack, it's dead on arrival.
CRM-native analytics are your starting point. Salesforce Sales Cloud dominates enterprise orgs with deep customization and its AppExchange ecosystem. HubSpot Sales Hub wins for SMBs that want reporting without a dedicated admin. Pipedrive is the best option for small teams that think pipeline-first and want to skip the complexity. For teams under 20 reps, HubSpot's free tier is genuinely good enough to start - don't let anyone upsell you before you've outgrown it.
BI and visualization tools handle anything the CRM can't do natively. Tableau is the power-user choice for complex, multi-source data. Power BI is the obvious pick if you're already a Microsoft shop. Zoho Analytics punches above its weight for budget-conscious teams.
Revenue intelligence platforms are where coaching and forecasting live. Gong owns conversation intelligence - if you want to know what's happening on calls, it's the gold standard. Clari is the strongest pure forecasting tool. Salesloft covers the full cycle from engagement through close.
| Category | Tool | Starting Price | Best For |
|---|---|---|---|
| CRM-Native | Salesforce Sales Cloud | From $25/user/mo | Enterprise ecosystems |
| CRM-Native | HubSpot Sales Hub | Free; paid from $20/user/mo | SMB simplicity |
| CRM-Native | Pipedrive | From $14/user/mo | Small teams, pipeline-first |
| BI / Visualization | Tableau | From $15/user/mo | Power users, complex data |
| BI / Visualization | Power BI | Free desktop; Pro $10/user/mo | Microsoft shops |
| BI / Visualization | Zoho Analytics | From $24/mo | Budget-conscious teams |
| Revenue Intelligence | Gong | ~$100-150/user/mo | Conversation intelligence |
| Revenue Intelligence | Clari | Custom pricing | Forecasting-first teams |
| Revenue Intelligence | Salesloft | ~$100-150/user/mo | Full-cycle orchestration |
| Data Enrichment | Prospeo | Free (75 emails/mo); ~$0.01/email | CRM enrichment, verification |
| Data Enrichment / Prep | Alteryx | Custom pricing | Enterprise data prep |
If your average deal is under $15K, you probably don't need Gong-level conversation intelligence. Start with your CRM's native reporting, add a BI tool when you outgrow it, and invest in lead enrichment from day one. The most expensive analytics mistake isn't buying the wrong tool - it's building dashboards on dirty data.
How to Start (Without Drowning)
Define the questions. Not "what dashboards should we build?" but "what decisions do we need to make, and what data would inform them?" Three to five questions max.
Audit your data. Check email bounce rates, field completeness, duplicate rates, and data freshness. Fix what's broken before you build anything.
Choose tools that fit your stack. CRM-native analytics for the basics, BI for custom reporting, revenue intelligence for coaching and forecasting, enrichment for data quality. Don't buy all four on day one.
Build 3-5 core dashboards. A pipeline health view, a rep scorecard, a win/loss analysis, a forecast tracker, and a leading-indicator dashboard. That's enough.
Iterate based on adoption. The dashboard nobody opens is the dashboard you should kill. Track usage, gather feedback, and refine. Organizations that commit to data-driven sales management typically see 5-10% revenue increases - but only if the team actually uses the tools.
Sales analytics isn't a one-time project. It's an operating discipline. The teams that win aren't the ones with the fanciest dashboards. They're the ones with clean data, clear questions, and the discipline to act on what the numbers say.
The gap between a 40% and 74% win rate starts with reaching the right buyers. Prospeo gives your reps 98% accurate emails and 125M+ verified mobiles so pipeline velocity isn't throttled by bad contact data. At $0.01 per email, the ROI math isn't even close.
Stop analyzing a pipeline built on stale data - start with contacts that connect.
FAQ
What's the difference between sales analytics and sales intelligence?
Sales analytics means analyzing your own historical and real-time sales data to find patterns, forecast revenue, and improve performance. Sales intelligence gathers external data about prospects, companies, and markets. They're complementary - analytics tells you how your team performs, intelligence tells you who to target next. Most mature revenue orgs use both.
Which metrics should I track first?
Start with five: win rate, pipeline velocity, quota attainment, average deal size, and sales cycle length. These give you a complete picture of funnel health without overwhelming your team. Once the foundation is solid, layer in leading indicators like speed-to-lead, demo bookings, and follow-up cadence.
How do I fix bad CRM data before building dashboards?
Audit for email bounce rates above 5%, missing fields, and duplicate records first. Then use an enrichment tool to fill gaps and verify contacts on a recurring cycle - stale data decays fast, so one-time cleanups don't stick. Clean data is the prerequisite for every analytics initiative; without it, your dashboards are just visualizing noise.
How does AI improve sales performance analysis?
AI's biggest impact is in forecasting accuracy, deal prioritization, and time savings. Gong's data shows AI-recommended actions can lift win rates by up to 50%, and teams using conversation intelligence close deals 11 days faster on average. The catch: AI amplifies data quality in both directions. Clean data produces accurate predictions. Dirty data produces confident-sounding garbage.