7 Sales Budget Examples You Can Copy in 2026
The board wants 25% growth. Your budget is due Friday. And every "sales budget guide" you pull up gives you a definition you already know, a vague process, and zero usable numbers.
That's not helpful when you need a spreadsheet you can defend in a forecast presentation. We've built and reviewed dozens of these across SaaS, services, and manufacturing orgs, so we put together seven sales budget examples with filled-in tables, real math, and enough context to adapt them to your business in an afternoon.
Quick-start: Pick the example closest to your business - simple product, seasonal retail, B2B services, manufacturing, SaaS, expense budget, or startup. Copy the table into Google Sheets or Excel (every table below is formatted for direct paste), swap the placeholder figures for your actuals, and build three scenarios using the step-by-step method in the calculation section below.
What Is a Sales Budget?
A sales budget is a financial plan that estimates how much revenue your team will generate over a specific period - broken down by units, price, and time. It's not a forecast. A budget is a fixed plan allocating resources; a forecast is a rolling prediction you update as reality unfolds. And it's not an expense budget either, though the two get confused constantly.
| Sales Budget | Sales Forecast | Sales Expense Budget | |
|---|---|---|---|
| Purpose | Set revenue targets | Predict actual results | Plan team spending |
| Timeframe | Annual or quarterly | Rolling (weekly/monthly) | Annual or quarterly |
| Updates | Set once, reviewed | Continuously updated | Set once, reviewed |
| Owner | Sales + Finance | Sales Ops / RevOps | Finance + Sales Mgmt |
The sales budget sits at the top of the master budget cascade. Your projected unit sales feed the production budget, which feeds direct materials and labor budgets, which roll into overhead and eventually the master budget. Get the sales budget wrong and every downstream number is fiction.
How to Calculate in 7 Steps
Step 1: Gather Historical Data
Pull 12-24 months of revenue data by product line, region, or segment. You need enough history to spot patterns. If you're pre-revenue, skip to the startup example - your budget will be expense-only for the first few months.
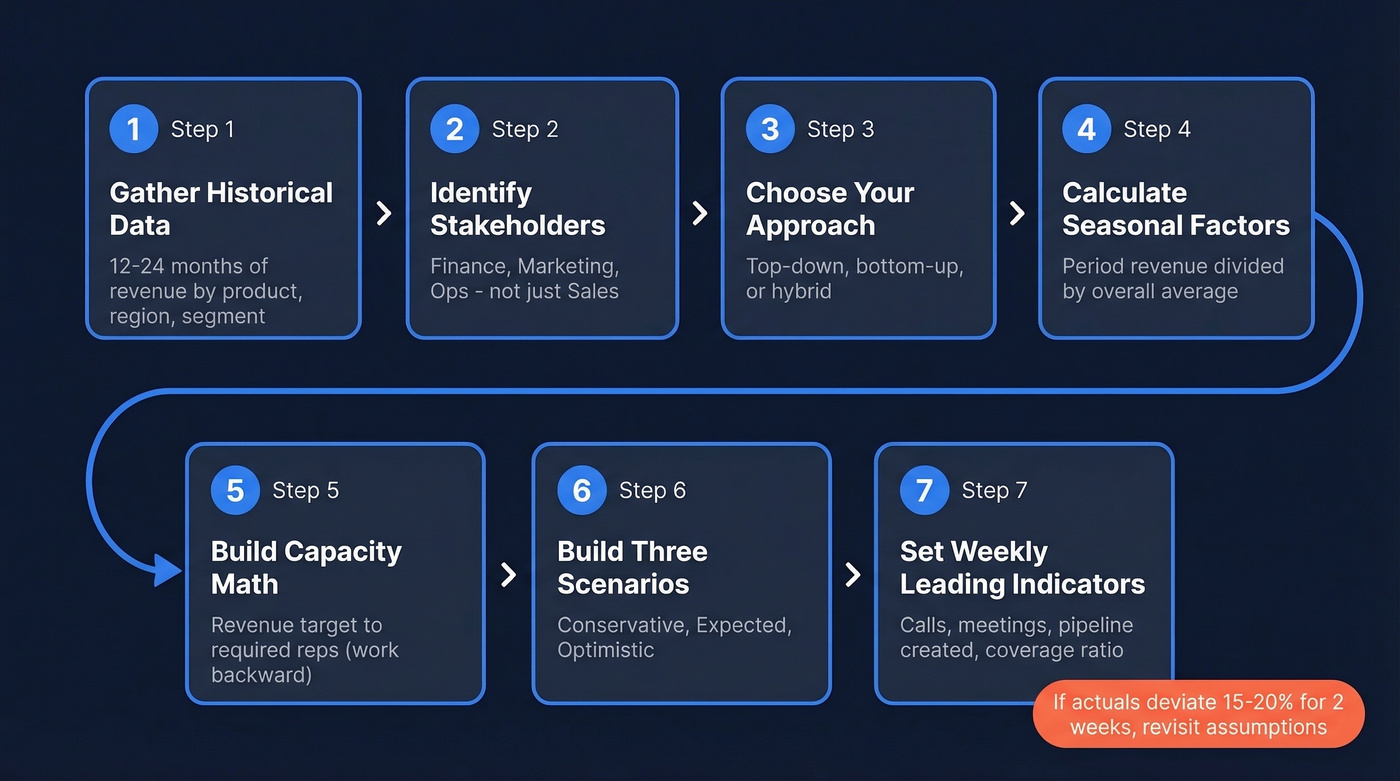
Step 2: Identify Stakeholders
Sales leadership can't build this alone. You need input from finance (margin targets, cost constraints), marketing (lead volume projections), and ops (capacity limits). Cross-functional alignment is the step most teams skip - and the one that causes the most rework later.
Step 3: Choose Your Approach
Top-down means leadership sets a revenue target and the team figures out how to hit it. Bottom-up means reps estimate what they can close and the numbers roll up. Both have problems. Top-down creates budgetary slack risk - reps sandbag because the target feels arbitrary. Bottom-up often misses the strategic picture.
A hybrid approach works best for most teams: leadership sets the target, reps validate it with pipeline math. If you have no reliable historical data, consider zero-based budgeting - justify every dollar from scratch rather than inflating last year's numbers by a growth percentage.
Step 4: Calculate Seasonal Factors
Use 2-3 years of monthly data. Divide each period's revenue by the overall average. If December revenue is 20% above average, your seasonal factor is 1.2. Retail teams should expect Q4 to run about 30-40% above average (seasonal factor ~1.3-1.4).
Step 5: Build Capacity Math
Work backward from your revenue target: Revenue target -> required closed deals -> required pipeline (at your win rate) -> required opportunities -> required outreach volume -> required reps.
This is where most budgets quietly break. Your pipeline math depends on reaching real people. If 20-30% of your contact data bounces, your conversion assumptions are broken before you start - bad data doesn't just waste rep time, it inflates your pipeline coverage number and makes your budget look achievable when it isn't. (If you're tightening the top of funnel, see sales prospecting techniques and sales activities you can budget and track weekly.)
Also check for process bottlenecks. If you only have two sales engineers, your budget can't assume 50 concurrent implementations. The constraint isn't pipeline; it's delivery capacity.
Step 6: Build Three Scenarios
Conservative, expected, and optimistic. Conservative uses your lowest historical win rates and longest sales cycles. Expected uses trailing averages. Optimistic assumes favorable conditions - new product launch, expanded team, or market tailwind. Present all three to leadership. They'll pick expected, but having the range prevents the "just add 20%" conversation.
Step 7: Set Weekly Leading Indicators
An annual revenue target tells your team nothing about what to do on Monday. Break it into weekly leading indicators: calls made, meetings booked, pipeline created, pipeline coverage ratio. Review weekly. If actuals deviate more than 15-20% for two consecutive weeks, your assumptions need revisiting - don't wait until quarter-end. (If you want a tighter operating cadence, build this into your sales operations metrics and pipeline health reviews.)
Your budget's pipeline math only works if reps actually reach decision-makers. When 20-30% of contact data bounces, your capacity assumptions collapse and that $2.4M target becomes fiction. Prospeo delivers 98% verified email accuracy on a 7-day refresh cycle - so the outreach volume in your budget translates to real conversations, not bounced emails.
Stop budgeting on broken data. Build pipeline that converts.
7 Templates You Can Copy
Monthly Budget (Simple Product)
The simplest format. One product, twelve months, seasonal variation baked in. This works for any business selling a single SKU or a narrow product line at a consistent price point.
| Month | Units | Price | Gross Revenue | Returns (3%) | Net Revenue |
|---|---|---|---|---|---|
| Jan | 450 | $50 | $22,500 | $675 | $21,825 |
| Feb | 470 | $50 | $23,500 | $705 | $22,795 |
| Mar | 520 | $50 | $26,000 | $780 | $25,220 |
| Apr | 550 | $50 | $27,500 | $825 | $26,675 |
| May | 580 | $50 | $29,000 | $870 | $28,130 |
| Jun | 500 | $50 | $25,000 | $750 | $24,250 |
| Jul | 480 | $50 | $24,000 | $720 | $23,280 |
| Aug | 490 | $50 | $24,500 | $735 | $23,765 |
| Sep | 530 | $50 | $26,500 | $795 | $25,705 |
| Oct | 560 | $50 | $28,000 | $840 | $27,160 |
| Nov | 620 | $50 | $31,000 | $930 | $30,070 |
| Dec | 680 | $50 | $34,000 | $1,020 | $32,980 |
| Total | 6,430 | $321,500 | $9,645 | $311,855 |
Swap in your actual unit price and baseline volume. The 3% returns rate is conservative for physical products - adjust upward for e-commerce (5-8% is more typical).
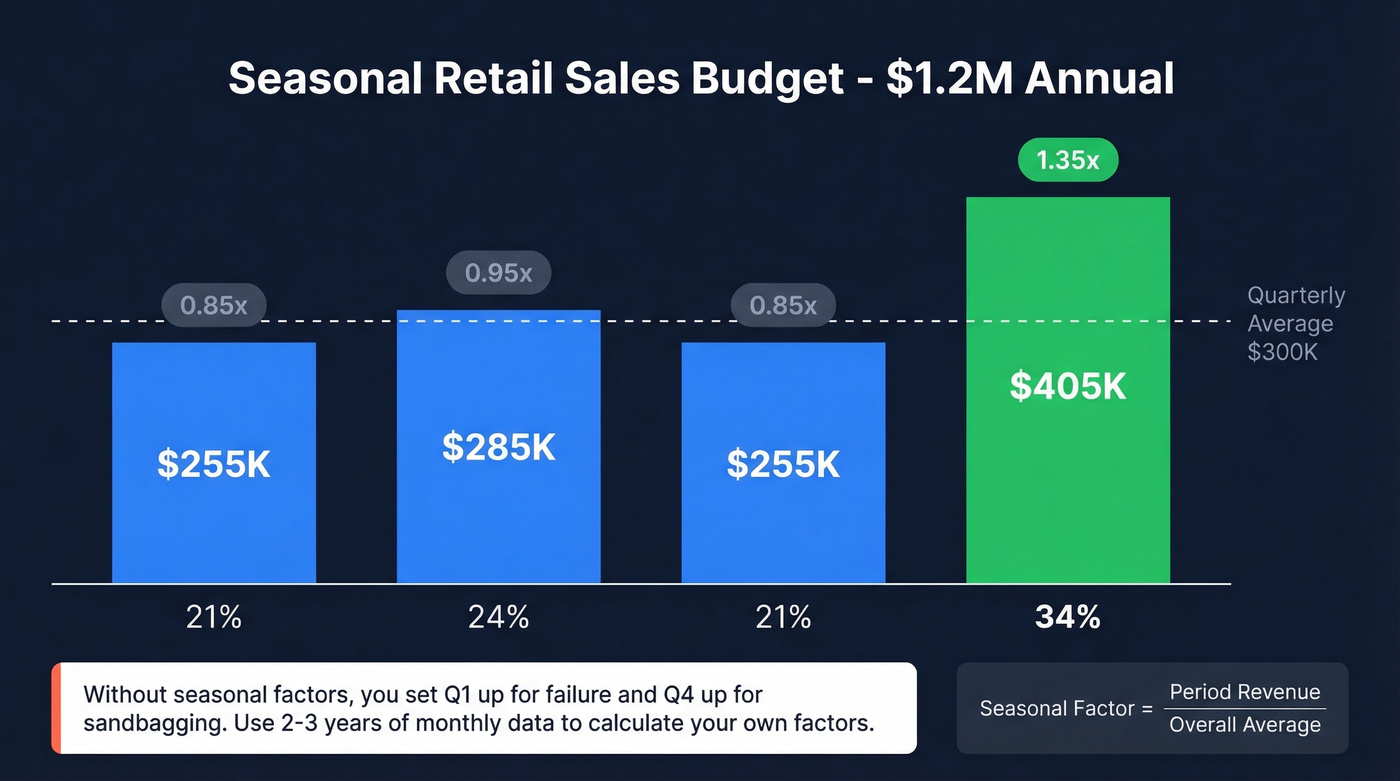
Quarterly Budget (Seasonal Retail)
Retail businesses live and die by seasonality. This example uses a $1.2M annual baseline and a Q4 uplift consistent with standard retail patterns.
| Quarter | Seasonal Factor | Adjusted Revenue | % of Annual |
|---|---|---|---|
| Q1 | 0.85 | $255,000 | 21% |
| Q2 | 0.95 | $285,000 | 24% |
| Q3 | 0.85 | $255,000 | 21% |
| Q4 | 1.35 | $405,000 | 34% |
| Annual | $1,200,000 | 100% |
Take each quarter's historical revenue and divide by the quarterly average. Q4 at 1.35 means that quarter historically runs 35% above the mean. If you're budgeting without seasonal factors, you're setting your Q1 team up for failure and your Q4 team up for sandbagging.
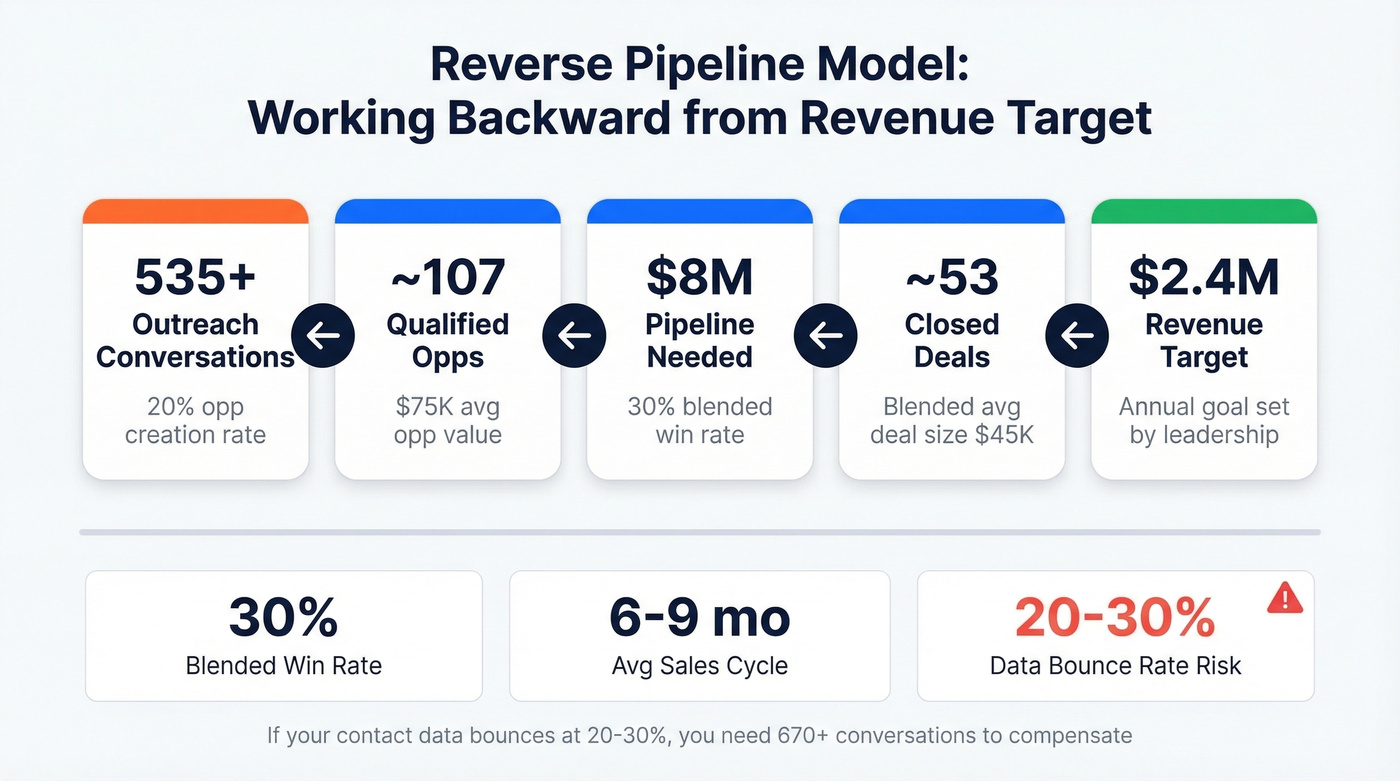
Annual B2B Services Budget
B2B services firms sell multiple service lines at different deal sizes. This example validates a $2.4M top-down target with bottom-up capacity math across three offerings - making it a useful template you can adapt to any professional services org. (If you need to sanity-check win rates and funnel assumptions, use these sales pipeline benchmarks and sales conversion rate references.)
| Service Line | Avg Deal Size | Win Rate | Q1 | Q2 | Q3 | Q4 | Annual |
|---|---|---|---|---|---|---|---|
| Consulting | $45,000 | 30% | $180K | $225K | $180K | $270K | $855K |
| Implementation | $75,000 | 25% | $225K | $300K | $225K | $300K | $1,050K |
| Managed Services | $8,000/mo | 40% | $120K | $120K | $128K | $136K | $504K |
| Total | $525K | $645K | $533K | $706K | $2,409K |
Use this when leadership hands you a number and you need to show whether your team can actually hit it. Work backward: $2.4M at a blended 30% win rate means you need ~$8M in pipeline. Divide by average deal size and sales cycle length to get required monthly opportunity creation. If the pipeline math doesn't work, you have a defensible reason to push back - not an opinion, a spreadsheet.
Manufacturing Budget
This example mirrors the Lumen Learning textbook case - 100,000 units at $40, with quarterly seasonality. The critical addition: how the revenue plan feeds the production budget.
| Quarter | Unit Sales | Price | Sales Revenue |
|---|---|---|---|
| Q1 | 15,000 | $40 | $600,000 |
| Q2 | 40,000 | $40 | $1,600,000 |
| Q3 | 20,000 | $40 | $800,000 |
| Q4 | 25,000 | $40 | $1,000,000 |
| Annual | 100,000 | $4,000,000 |
The production linkage matters here. If your inventory policy requires ending inventory equal to 40% of next quarter's sales, Q1 production isn't just 15,000 units. It's 15,000 + (40% x 40,000) - beginning inventory. Using the textbook's example beginning inventory of 12,000 units, that's 15,000 + 16,000 - 12,000 = 19,000 units produced. Your revenue plan drives production planning, purchasing, and labor budgets downstream - get the quarterly split wrong and you're either sitting on excess inventory or scrambling to fulfill orders.
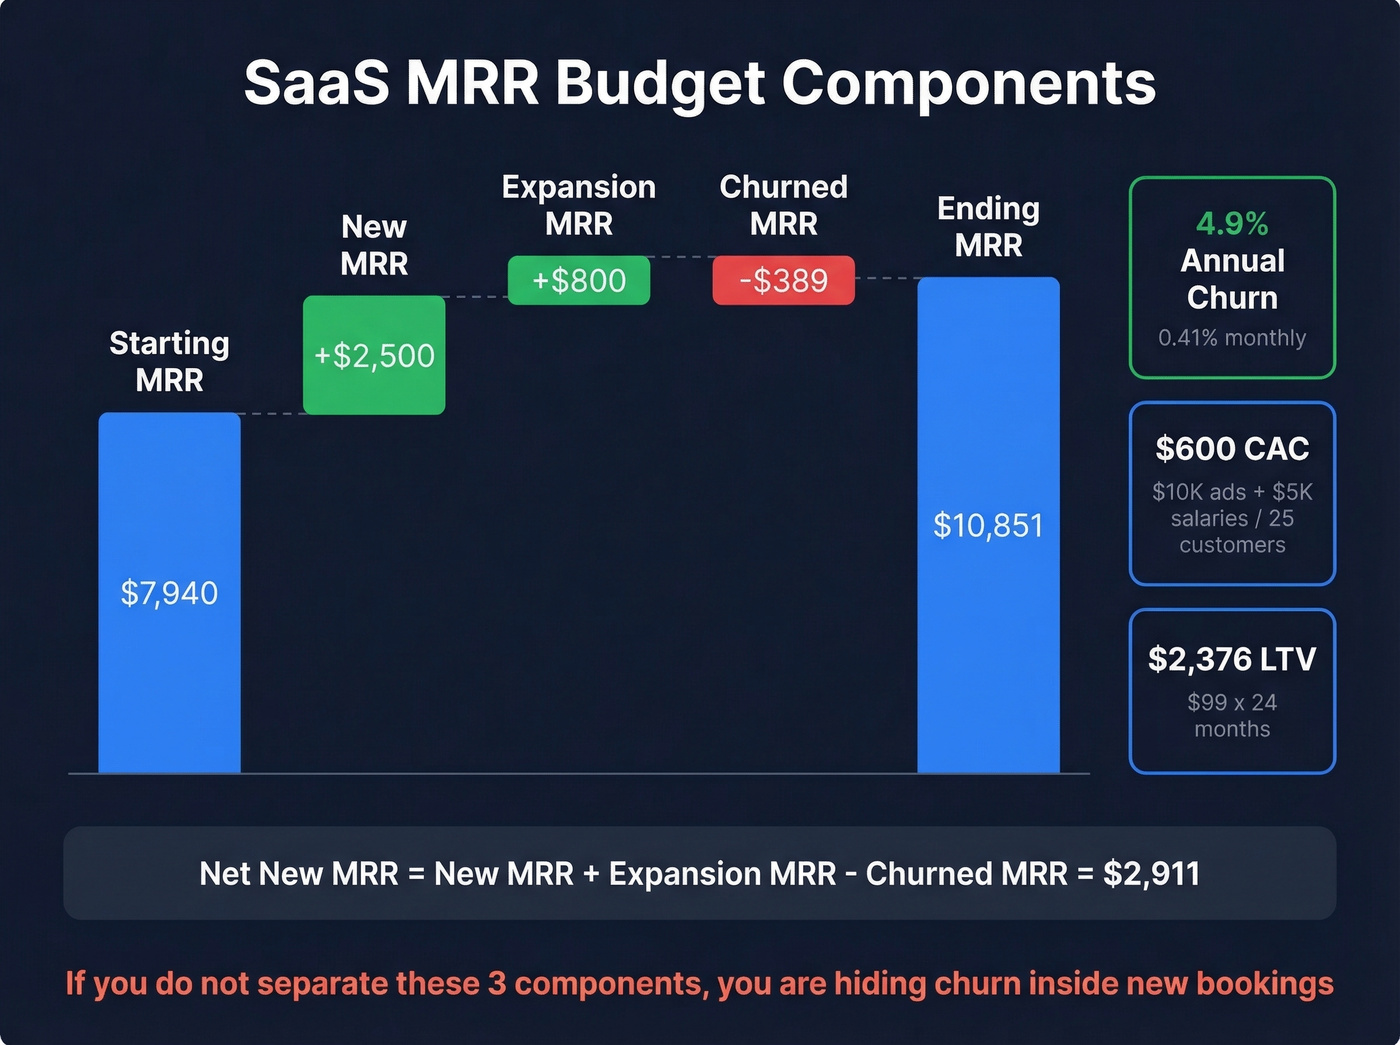
SaaS Revenue Budget
SaaS budgets are different in kind because revenue compounds monthly. You're not budgeting discrete transactions - you're budgeting MRR layers. (If you're building a SaaS model, pair this with a churn analysis so churn assumptions don't get hand-waved.)
| MRR Component | Monthly | Quarterly (x3) | Annual (x12) |
|---|---|---|---|
| Starting MRR | $7,940 | $23,820 | $95,280 |
| New MRR | +$2,500 | +$7,500 | +$30,000 |
| Expansion MRR | +$800 | +$2,400 | +$9,600 |
| Churned MRR | -$389 | -$1,167 | -$4,668 |
| Net New MRR | $2,911 | $8,733 | $34,932 |
Assumptions:
- Starting MRR: 50 x $99 + 10 x $299 = $7,940
- Annual churn: 4.9% for B2B SaaS -> ~0.41%/month
- CAC: $600 (($10K ads + $5K salaries) / 25 new customers)
- LTV: $99 x 24 months = $2,376
- CAC payback: $600 / ($99 x 0.80) = 7.6 months
The formula that matters: Net New MRR = New MRR + Expansion MRR - Churned MRR. If your budget doesn't separate these three components, you're hiding churn inside new bookings - and you're lying to your board about growth efficiency.
Department Expense Budget
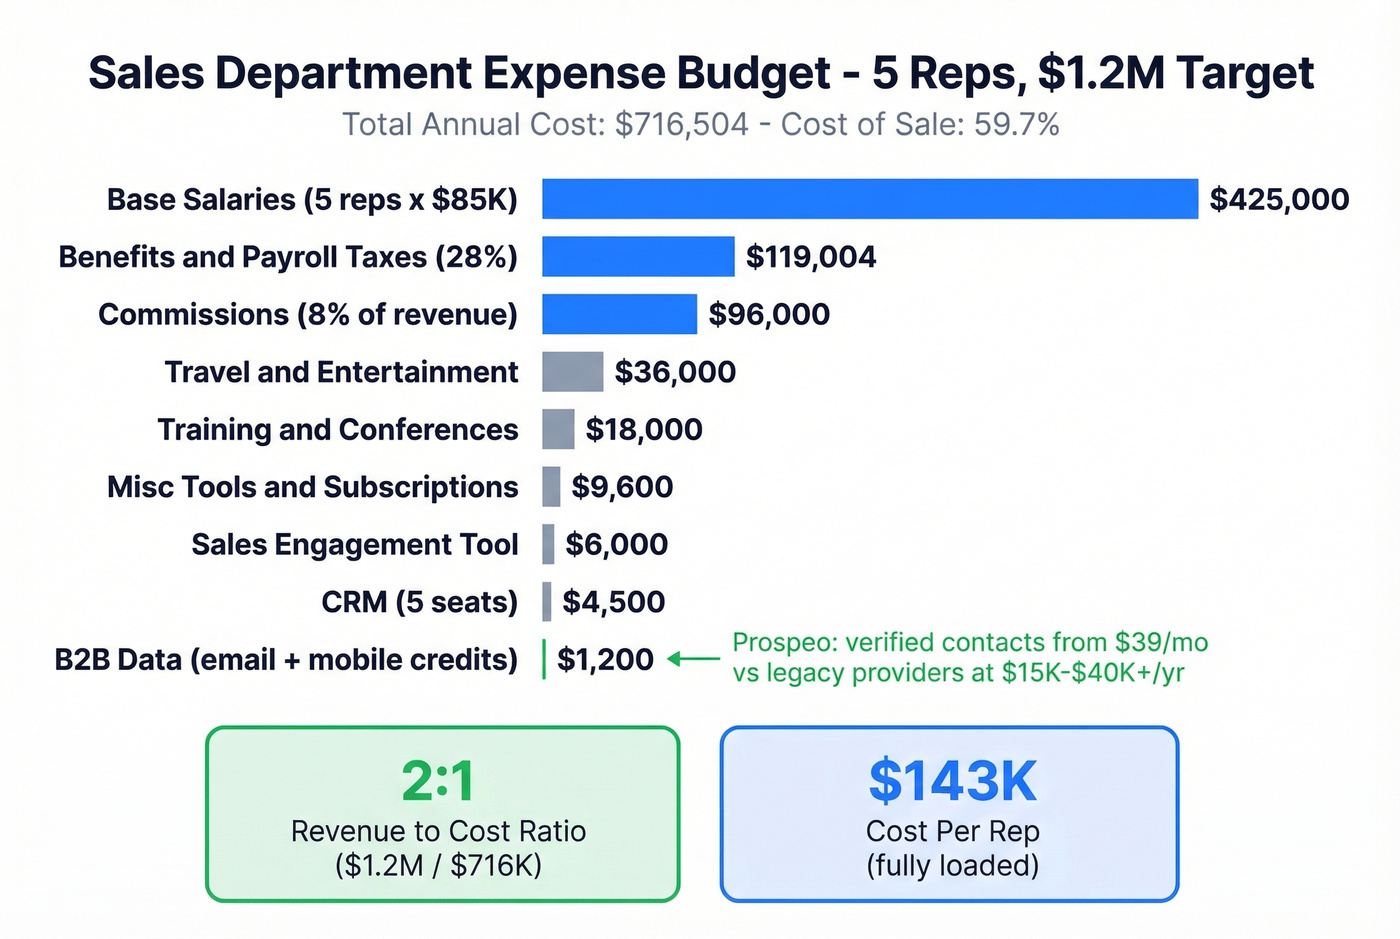
This is the cost side - not what your team will sell, but what it costs to run them. Here's a realistic expense budget for a 5-person team targeting $1.2M in annual revenue. (If you're evaluating tooling, start with a shortlist of SDR tools and sales forecasting solutions so your budget matches your workflow.)
| Line Item | Monthly | Annual |
|---|---|---|
| Base salaries (5 reps x $85K) | $35,417 | $425,000 |
| Benefits & payroll taxes (28%) | $9,917 | $119,004 |
| Commissions (8% of $1.2M revenue) | $8,000 | $96,000 |
| CRM (HubSpot, 5 seats) | $375 | $4,500 |
| B2B data (email + mobile credits) | $100 | $1,200 |
| Sales engagement tool | $500 | $6,000 |
| Travel & entertainment | $3,000 | $36,000 |
| Training & conferences | $1,500 | $18,000 |
| Misc. tools & subscriptions | $800 | $9,600 |
| Total | $59,609 | $716,504 |
That B2B data line is worth a closer look. Legacy providers charge $15,000-$40,000+/year for contact data. We've seen teams routinely blow 5-8% of their entire expense budget on a data platform they use primarily for email lookup. With tools like Prospeo at ~$0.01/lead and 98% email accuracy, that line item difference alone can fund an extra half-rep.
Here's the thing: if your average deal size is under $15K, you almost certainly don't need a $30K/year data platform. Spend the savings on another SDR or better sales enablement content. The ROI math on expensive data tools only works when your deal sizes justify the per-lead cost.
Startup Template (Pre-Revenue)
Pre-revenue startups don't have a revenue budget - they have a burn budget with a revenue ramp hypothesis. This six-month view shows expense-only months followed by early revenue, and it doubles as one of the most practical forecasting templates for startups raising their first round.
| Month | Expenses | Revenue | Net Burn |
|---|---|---|---|
| Month 1 | $18,000 | $0 | -$18,000 |
| Month 2 | $18,000 | $0 | -$18,000 |
| Month 3 | $20,000 | $0 | -$20,000 |
| Month 4 | $22,000 | $4,000 | -$18,000 |
| Month 5 | $22,000 | $9,000 | -$13,000 |
| Month 6 | $24,000 | $16,000 | -$8,000 |
| Total | $124,000 | $29,000 | -$95,000 |
Plan for salesperson ramp-up time - most reps take 3-6 months to hit full productivity. Your budget should reflect zero or minimal revenue in months 1-3 unless you have existing pipeline from founder-led sales. Budgeting revenue from day one is the fastest way to burn through runway and credibility simultaneously.
Benchmarks by Industry
How do you know if your budget is in the right ballpark? SaaS Capital's survey of 1,000+ private B2B SaaS companies provides the strongest benchmark data available.
| Metric | Median (All) | $3M-$5M ARR |
|---|---|---|
| Selling costs (% of ARR) | 13% | 15% |
| Marketing (% of ARR) | 8% | 7% |
| R&D (% of ARR) | 22% | 20% |
| G&A (% of ARR) | 14% | 15% |
| Total spend (bootstrapped) | 95% of ARR | - |
| Total spend (equity-backed) | 107% of ARR | - |
Outside SaaS, benchmarks are harder to pin down. Manufacturing companies typically allocate 5-10% of revenue to sales costs. Professional services firms run 8-15%. Retail is all over the map depending on whether you're counting store labor as a sales cost. The Gartner Sales Budget and Efficiency Benchmark offers more granular data if you need industry-specific comparisons, though it sits behind a paywall.
If your selling costs are above 15% of revenue and you're not in hypergrowth mode, something's off - either your team is too large for your pipeline, your tools are too expensive, or your win rates need work.
Mistakes That Kill Your Budget
Validate top-down targets with bottom-up capacity math. Don't just accept a 20% growth target because the CEO said so. A common complaint on r/FPandA is executives pushing aggressive growth targets despite missing the prior year. If the math doesn't work, push back with numbers - present all three scenarios and show exactly what pipeline coverage, win rate, and rep count the optimistic case requires.
Budget monthly or quarterly, not annually. "$1.2M annual target" tells your team nothing about January. Break it into monthly targets with seasonal adjustments so reps know what "on track" looks like every week.
Apply seasonal factors from 2-3 years of data. Even B2B companies have seasonality - Q4 budget flush, summer slowdowns, fiscal year-end buying cycles. Spreading revenue evenly across 12 months means you'll panic in Q1 and coast in Q4.
Account for churn separately in SaaS budgets. If your budget shows $50K in new MRR but doesn't break out the $5K you're losing to churn each month, you're presenting a number that's 10% more optimistic than reality. Your board will notice.
Connect your budget to live pipeline data. Skip this if you want your budget to become fiction by February. For 2026, invest in planning tools that pull CRM pipeline data directly into your budget model - a standalone spreadsheet that nobody updates after January helps no one.
You just built three scenarios - conservative, expected, and optimistic. The variable that separates them isn't market conditions. It's whether your reps can fill pipeline fast enough. Prospeo gives your team 300M+ profiles with 30+ filters, so the weekly leading indicators you set actually get hit.
Turn your expected scenario into your conservative one.
FAQ
What's the difference between a sales budget and a forecast?
A sales budget is a fixed plan that sets revenue targets for a defined period - typically a quarter or fiscal year. A forecast is a rolling prediction updated weekly or monthly based on actual pipeline data and close rates. Use the budget as your goal and the forecast to track whether you'll hit it. They work together, not interchangeably.
How often should you update your budget?
Set it annually or quarterly, but review weekly against your forecast and leading indicators. If actuals deviate more than 15-20% for two consecutive weeks, revisit your assumptions - especially pipeline coverage ratios and win rates. Don't blow up the whole budget; adjust the inputs that changed and re-run your three scenarios.
Can I use a template instead of building from scratch?
Yes, and you should. Every table in this article is designed to paste directly into Google Sheets or Excel. Copy the example closest to your business, replace the placeholder numbers with your actuals, and adjust the time periods to match your fiscal year. A template gets you 80% of the way there; the remaining 20% is plugging in your historical data and seasonal factors.
What tools do you need to build one?
A spreadsheet handles 90% of the work - Google Sheets or Excel is fine. Add a CRM like HubSpot or Salesforce for pipeline data and historical close rates. For contact data feeding your pipeline assumptions, a provider with high email accuracy ensures your capacity math reflects reality, not inflated contact lists. That's the full stack for most teams under 20 reps.
How do you budget for a new product line?
Start with market sizing and work down. Estimate your total addressable market, apply a realistic penetration rate (1-3% in year one for most B2B products), and validate with bottom-up capacity math from Step 5 above. The same burn-then-ramp pattern from the startup template applies to new product lines inside established companies, not just startups.