The 7 Sales Cycle Metrics That Actually Matter in 2026
Your VP just asked why Q2 deals took 30% longer to close, and your dashboard has 20 widgets that don't answer the question. You're not alone - 58% of B2B professionals report longer sales cycles, quota attainment sits at 43.5%, and reps spend roughly 30% of their time actually selling. The problem isn't a lack of data. It's tracking the wrong sales cycle metrics.
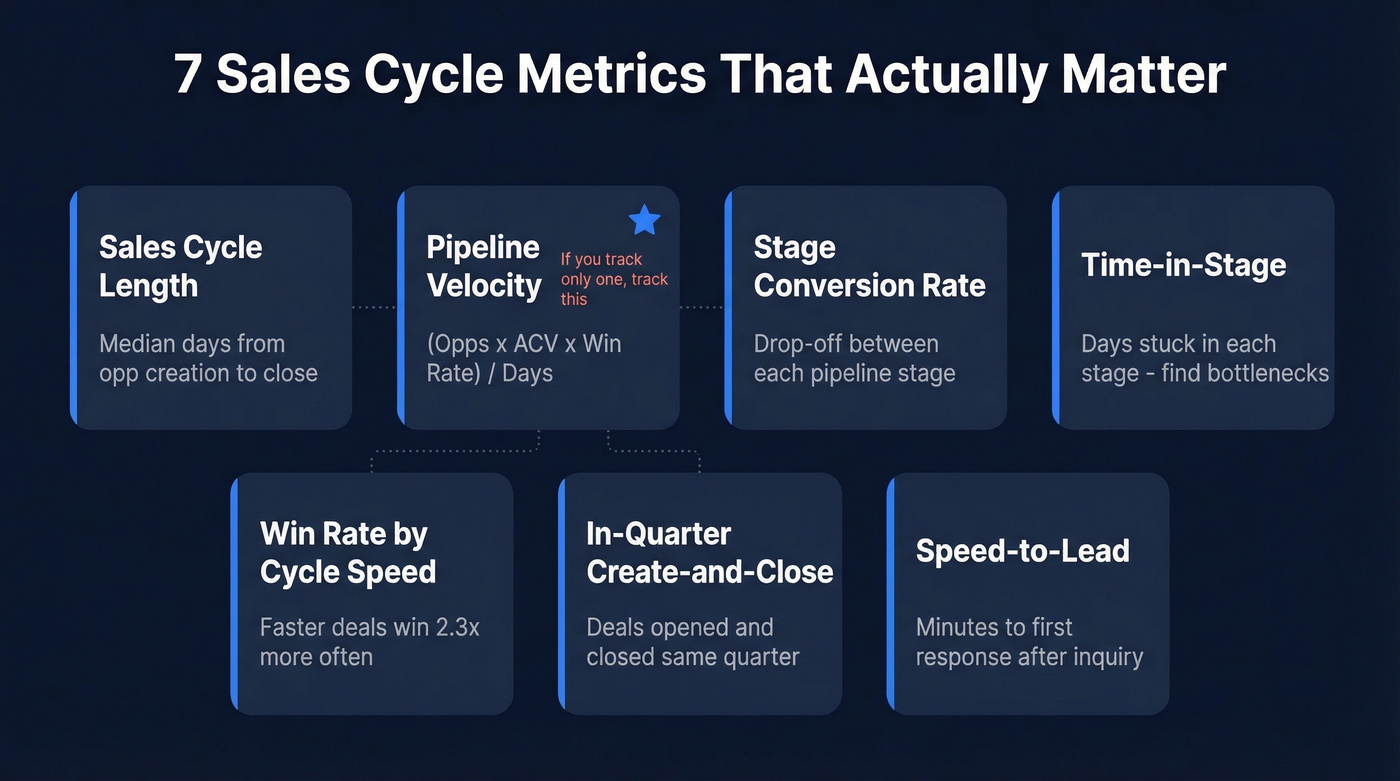
If you track only three, make them pipeline velocity, stage conversion rate, and time-in-stage. Everything else is either an input to these or a vanity number. Below: formulas, benchmarks by industry and deal size, and the operating cadence that turns dashboards into decisions.
7 Core Cycle Metrics
Sales Cycle Length
Formula: Sum of days from opportunity creation to close across closed deals / number of closed deals.
Use median, not mean. A single 400-day enterprise deal will skew your average and make every other deal look slow. Report P75 and P90 to surface outliers - that's where the real story lives.
Pipeline Velocity
Formula: (Qualified Opps x Avg Deal Value x Win Rate) / Cycle Length in Days
Worked example: (200 x $50,000 x 0.25) / 60 = $41,667 per day. There's a 10.8x delta in velocity between top and average performers. If you're only tracking one metric, this is the one.
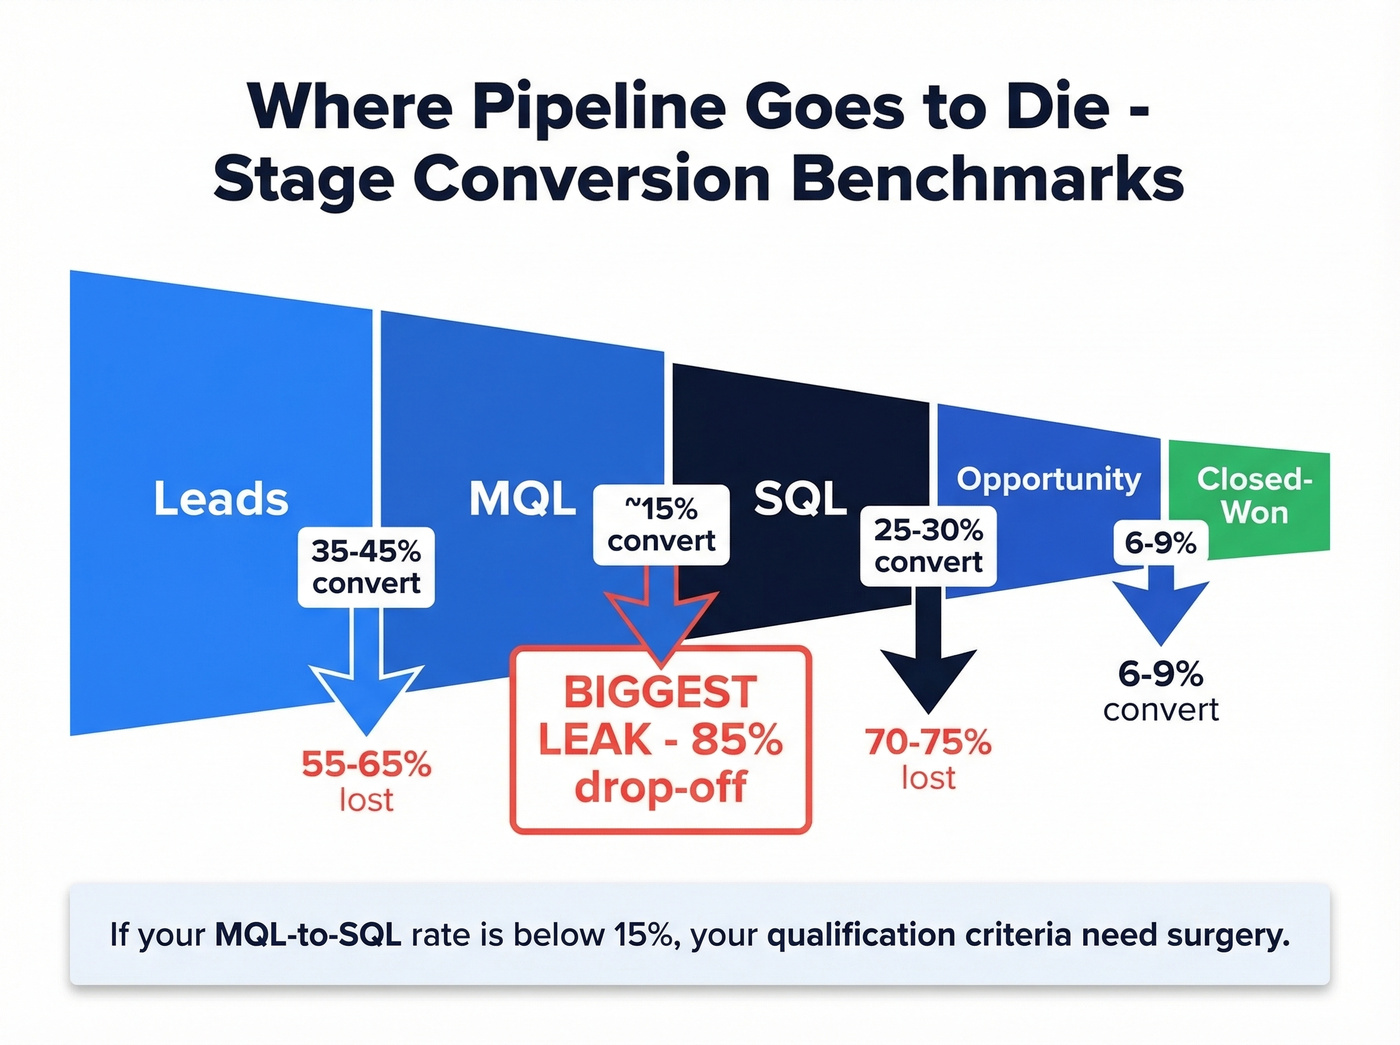
Stage Conversion Rate
This is where most teams find their biggest leak. Benchmark ranges:
| Stage Transition | Benchmark |
|---|---|
| Lead to MQL | 35-45% |
| MQL to SQL | ~15% |
| SQL to Opportunity | 25-30% |
| Opp to Closed-Won | 6-9% |
That MQL-to-SQL drop is where pipeline goes to die. If yours is below 15%, your qualification criteria need surgery (and your lead scoring probably does too).
Time-in-Stage
No formula here - just the number of days an opportunity sits in each pipeline stage. When Discovery averages 8 days but Proposal averages 22, you've found your bottleneck. Set stage-specific SLAs and flag deals that exceed them. Simple, but we've seen teams ignore this for years while wondering why forecasts keep slipping.
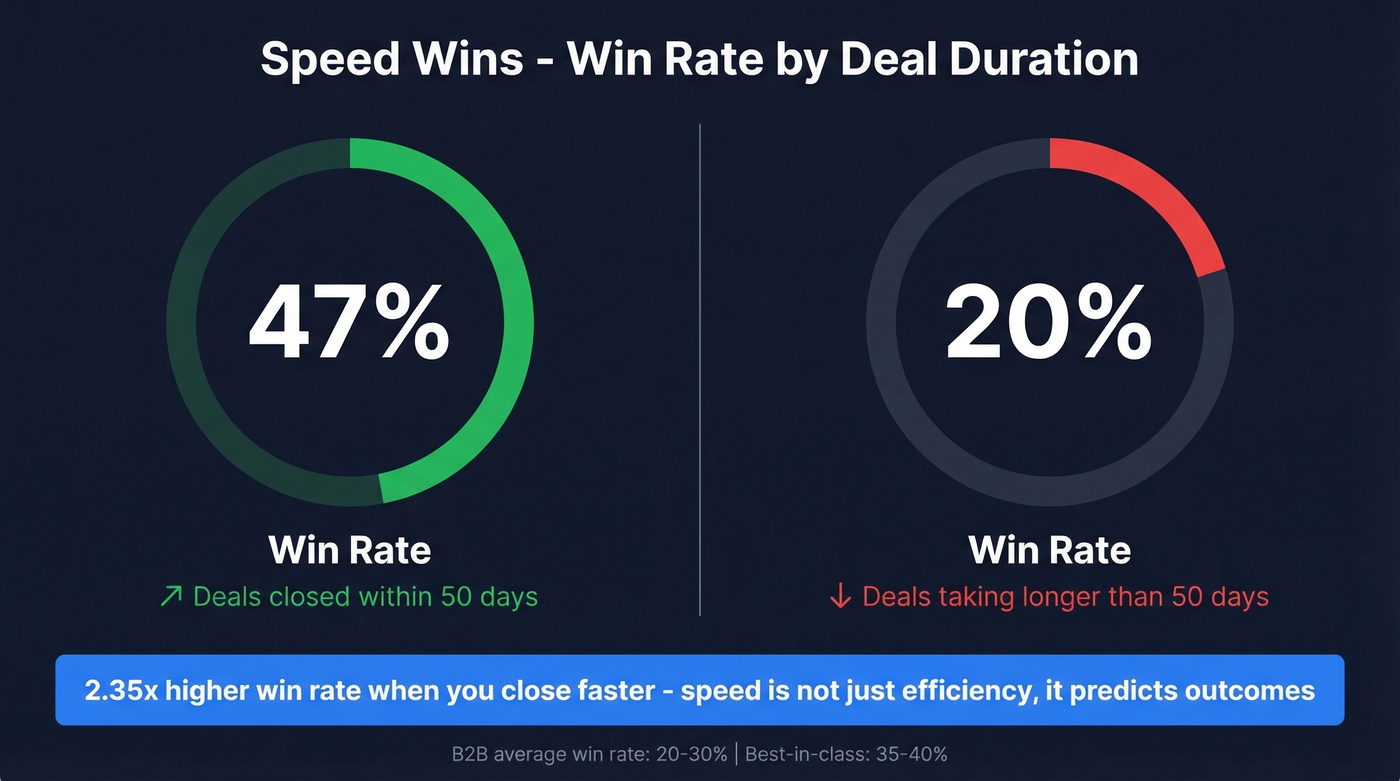
Win Rate by Cycle Speed
Here's a stat that should change how your team thinks about "complex" deals: opportunities closed within 50 days show a 47% win rate. Beyond 50 days? Just 20%. For context, average win rates across B2B sit at 20-30%, with best-in-class teams hitting 35-40%. Speed doesn't just correlate with winning - it's a strong predictor of deal outcomes.
In-Quarter Create-and-Close
Borrowed from Battery Ventures' operating framework, IQCC tracks deals created and closed within the same quarter. For teams with sub-90-day cycles, it's the purest measure of sales engine responsiveness. Low IQCC relative to your cycle length? Your pipeline generation is lagging.
Speed-to-Lead
Conversion rates are 8-21x higher when you respond within 5 minutes, and 35-50% of deals go to the first responder. If your average response time is measured in hours, you're handing revenue to competitors.
Here's the thing: most teams obsess over lead volume when their real problem is stage leakage and response time. We've watched teams double velocity without adding a single new lead - just by fixing the MQL-to-SQL handoff and cutting response time from 4 hours to 10 minutes.
Benchmarks by Industry and Deal Size
Stop averaging cycle length across all deals. A blended number mixing $5k SMB deals with $200k enterprise deals tells you nothing useful. Segment by ACV first, then layer in industry and company size.
One macro trend worth noting: a 6Sense benchmark roundup shows average B2B buying cycles compressed from 11.3 to 10.1 months recently, alongside buyers engaging sellers earlier in their research process. The cycle isn't getting longer everywhere - it's shifting.
By Industry
| Industry | Avg Days |
|---|---|
| Retail | 70 |
| Software | 90 |
| Financial Services | 98 |
| Technology | 121 |
| Healthcare | 125 |
| Manufacturing | 130 |
| Pharmaceuticals | 153 |
| Energy | 155 |
By Deal Size (ACV)
| ACV Range | Avg Days |
|---|---|
| < $1K | 25 |
| $1K-$5K | 40 |
| $5K-$10K | 55 |
| $10K-$50K | 75 |
| $50K-$100K | 120 |
| $100K-$250K | 170 |
| $250K-$500K | 220 |
| > $500K | 270 |
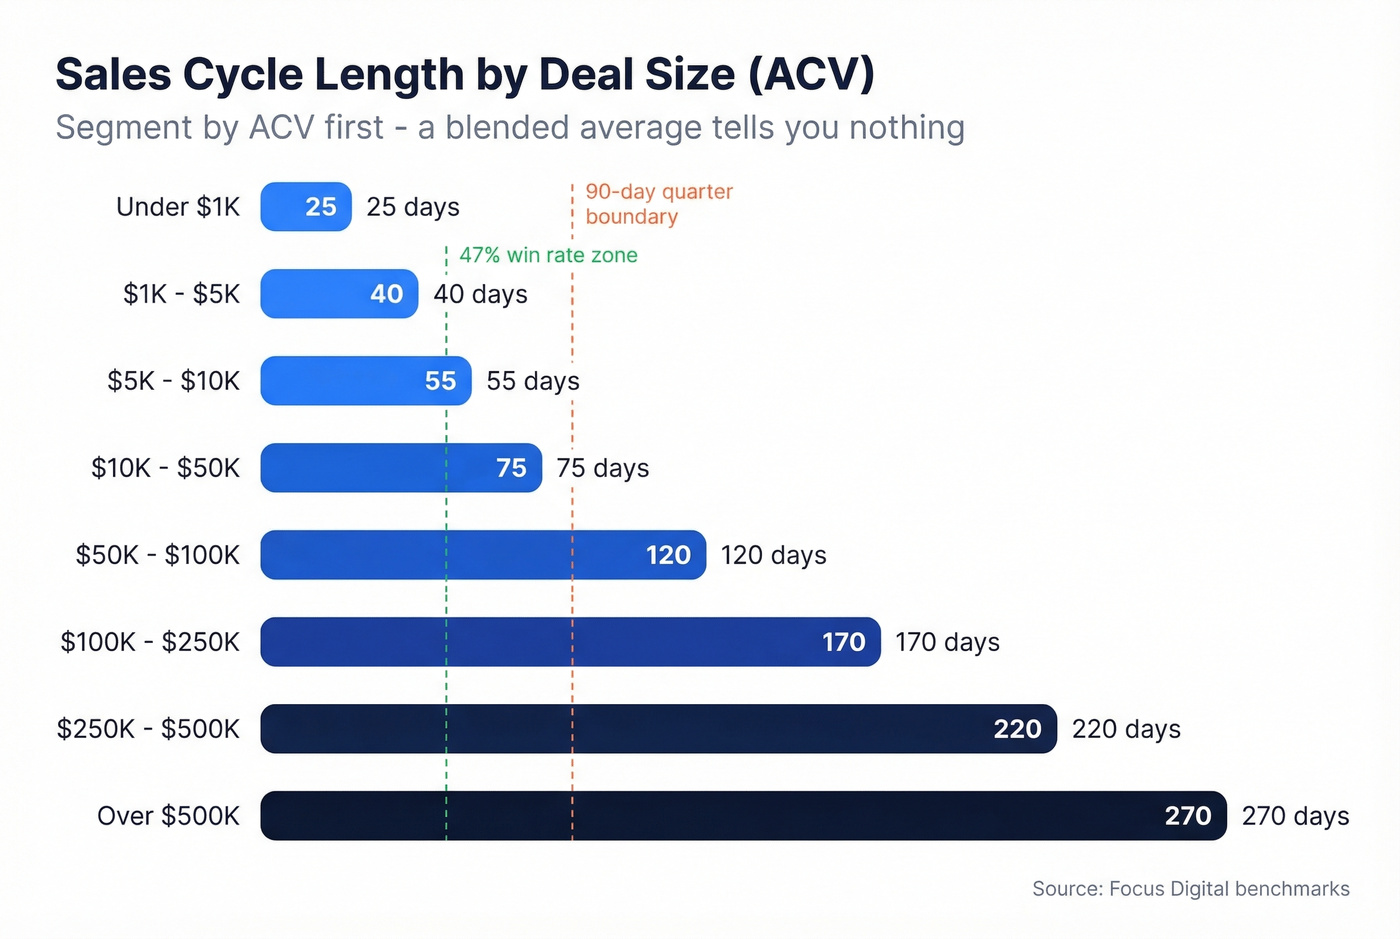
Data from Focus Digital, latest available benchmarks.
By Channel
| Channel | Avg Days |
|---|---|
| Referrals | 20 |
| SEO / Inbound | 28 |
| Cold Outbound | 60 |
| Trade Shows | 80 |
Referrals move through the pipeline at 3.8x the speed of outbound. These numbers reflect low-complexity deals; for higher-complexity sales, cycle times stretch significantly - Focus Digital's benchmarks show referrals at 20/35/60 days for low/medium/high complexity, versus cold calling at 60/85/110.
Your outbound cycle averages 60 days - and dirty contact data is adding weeks of bounced emails, ghosted dials, and stalled multi-threading. Prospeo gives you 98% verified emails and 125M+ direct mobiles so reps reach every stakeholder in the buying committee on day one, not day forty.
Cut the data drag out of your pipeline velocity.
How to Measure These Metrics
Your CRM's default stage probabilities are wrong. We've audited dozens of Salesforce instances, and win rates by stage almost never match the defaults. Compare them. Recalibrate quarterly.
Beyond that, clean measurement comes down to five principles:
- Use median for cycle length and mean only for capacity planning.
- Cohort by completed quarters. Analyze the last 2-4 quarters of closed deals rather than a rolling window that mixes vintages.
- Right-censor in-flight deals. Exclude open opportunities from cycle length calculations - they'll artificially compress your numbers.
- Value-weight your conversion rates because a $500k deal advancing matters more than a $5k deal.
- Segment everything by source, deal size, product line, and geo. An unsegmented metric is a useless metric.
Shortening Deals With Cycle Analysis
43% of sales leaders report increased cycle times. Most of that drag is operational, not strategic. Five levers that compress timelines without sacrificing deal quality:
Prioritize high-quality leads. Intent data and lead scoring keep reps focused on buyers who are actually in-market, not prospects who'll ghost after the demo. Prospeo tracks 15,000 intent topics via Bombora, so you can layer buying signals with job role and company growth filters before a rep ever picks up the phone.
Multi-thread early. Buying committees often involve 6-13 stakeholders. Reach them all in the first two weeks, not the last two. Single-threaded deals stall the moment your champion goes on vacation - and that stall adds weeks you can't get back. (If you need a system for this, start with account-based selling.)
Automate non-selling tasks. Reps spend ~70% of their time on activities that aren't selling. Conversation intelligence alone closes deals 11 days faster and lifts win rates 10 points on deals over $50k.
Clean your contact data. Every bounced email or disconnected number adds days before a deal even enters the pipeline. Tools like Prospeo verify emails and mobile numbers in real time - 98% accuracy on a 7-day refresh cycle versus the 6-week industry average - so reps spend hours selling instead of researching contacts (and your email bounce rate stays under control).
Coach on stage-specific skills. Generic pipeline reviews don't move deals. We've seen teams cut time-in-stage by 20-30% just by running stage-specific coaching sessions, teaching reps what "good" looks like in Discovery versus Negotiation, instead of blanket deal reviews.

Intent data is the fastest lever to compress time-in-stage. Prospeo tracks 15,000 Bombora topics layered with 30+ filters - job changes, headcount growth, technographics - so your reps only work deals that are already in-market. All refreshed every 7 days, not the 6-week industry average.
Stop chasing cold leads while in-market buyers sign with competitors.
Operating Cadence
Metrics without a review rhythm are decoration. Here's the cadence we recommend:
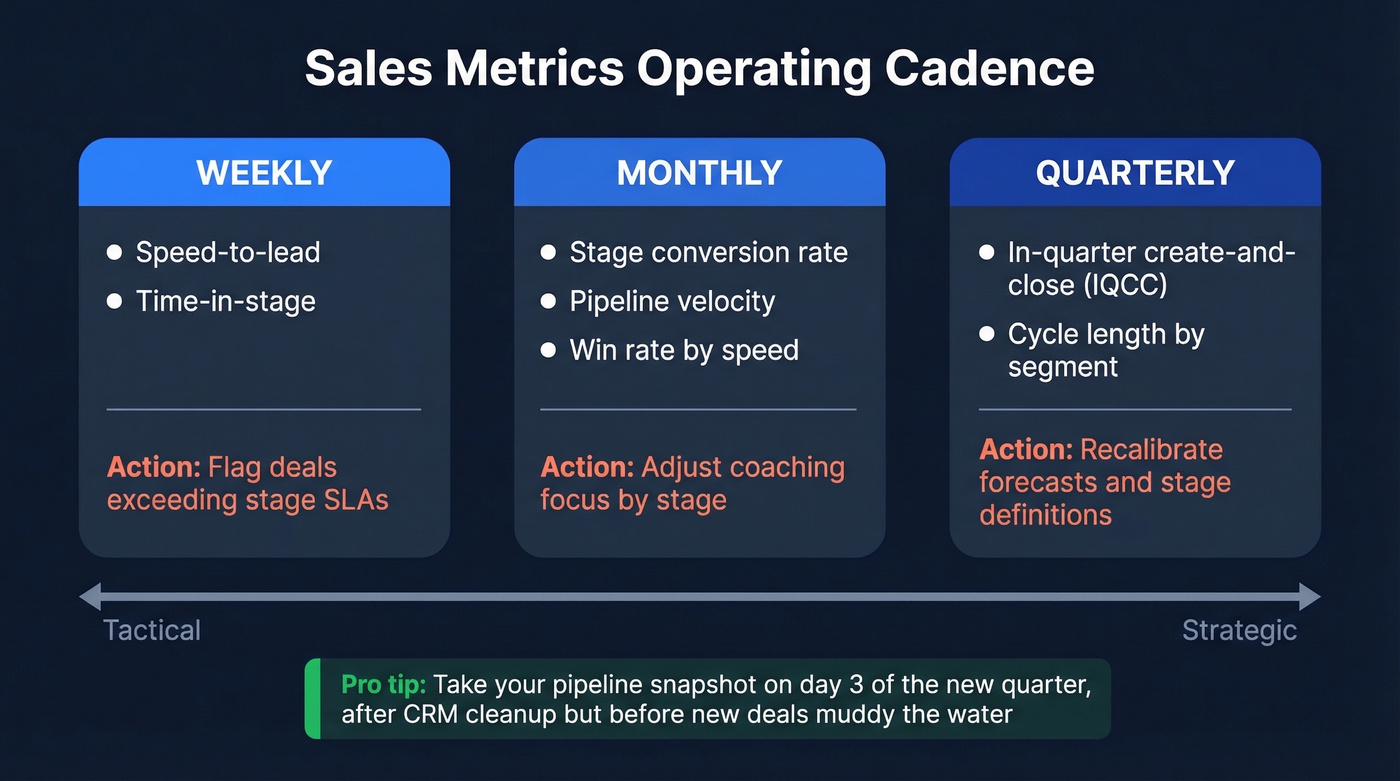
| Frequency | Metrics | Action Trigger |
|---|---|---|
| Weekly | Speed-to-lead, time-in-stage | Flag deals exceeding SLA |
| Monthly | Stage conversion, velocity, win rate | Adjust coaching focus |
| Quarterly | IQCC, cycle length by segment | Recalibrate forecasts |
Take your pipeline snapshot on day 3 of the new quarter - after CRM cleanup but before new deals muddy the water. That snapshot becomes your baseline for the entire quarter's forecast. Pair it with insights from the previous quarter's cohort data to identify whether trends are improving or deteriorating before you commit to a number (especially if you're running formal QBRs).
Let's be honest: most teams skip the quarterly recalibration because it feels tedious. Don't. The teams that actually shorten their sales cycles are the ones reviewing cohort data every 90 days and adjusting stage definitions, SLAs, and coaching priorities based on what the numbers say - not what they assumed last year.
FAQ
What's a good sales cycle length?
Benchmark against your ACV tier: deals under $5k close in ~40 days, $50k-$100k deals average 120 days, and contracts over $500k run about 270 days. A blended average across deal sizes is meaningless - always segment first.
How do you calculate pipeline velocity?
Multiply qualified opportunities by average deal value by win rate, then divide by cycle length in days. The result is daily revenue throughput - the single best composite measure of pipeline health.
Which sales cycle metrics should I review weekly?
Track speed-to-lead and time-in-stage every week. These two surface stalled deals and slow response times before they compound into missed-quarter problems. Monthly, layer in stage conversion and win rate for coaching adjustments.
How does bad contact data affect cycle length?
Every bounced email or wrong number adds 2-5 days of wasted follow-up per prospect. Verifying contacts in real time - 98% email accuracy, 30% mobile pickup rate - eliminates this drag so reps sell instead of chasing dead leads.