Sales Efficiency Metrics: Formulas, Benchmarks, and Mistakes Nobody Covers
A 10-person sales team burning $3.5M a year in fully loaded S&M costs needs sales efficiency metrics that actually tell them something. Most teams track quota attainment, call it a day, and wonder why the board keeps asking harder questions. Here's every formula, benchmark, and calculation mistake that matters - segmented by stage and deal size, not flattened into useless averages.
What These Metrics Actually Measure
Sales efficiency answers one question: how effectively does your team convert spend into revenue? But the answer changes depending on which costs you include, and most teams don't realize they're calculating two different things.
The sales-only version: take $5M in new quarterly revenue, divide by $2.5M in direct sales expenses, and you get a 2.0 ratio. That tells you how productive your sales team is in isolation. The full go-to-market version folds in marketing. Same $5M in revenue, but now you're dividing by $3.5M in combined sales and marketing spend, which gives you 1.43 - a more honest picture of what it actually costs to acquire that revenue. Both are useful. The first helps you evaluate your sales org; the second helps you evaluate your GTM engine. The mistake is treating them as interchangeable.
A common ops gap we see constantly: dashboards report quota attainment but don't connect efficiency ratios to headcount planning, capacity modeling, or quota setting. The formulas below fix that.
Three Metrics That Matter Most
If you only track three things, make it these. Everything else is supporting detail.
Net Sales Efficiency - the real Magic Number. It accounts for churn, which means it reflects what you're actually keeping, not just what you're closing. Gross efficiency flatters teams that churn what they sell.
Pipeline Velocity - companies that focus on this metric see 28% higher revenue growth, yet only 24% of sales teams track it. That gap is staggering.
CAC Payback Period (gross-margin-adjusted) - not the blended version most teams calculate wrong. If you're using total company gross margin instead of subscription-specific margin, your payback number is fiction.
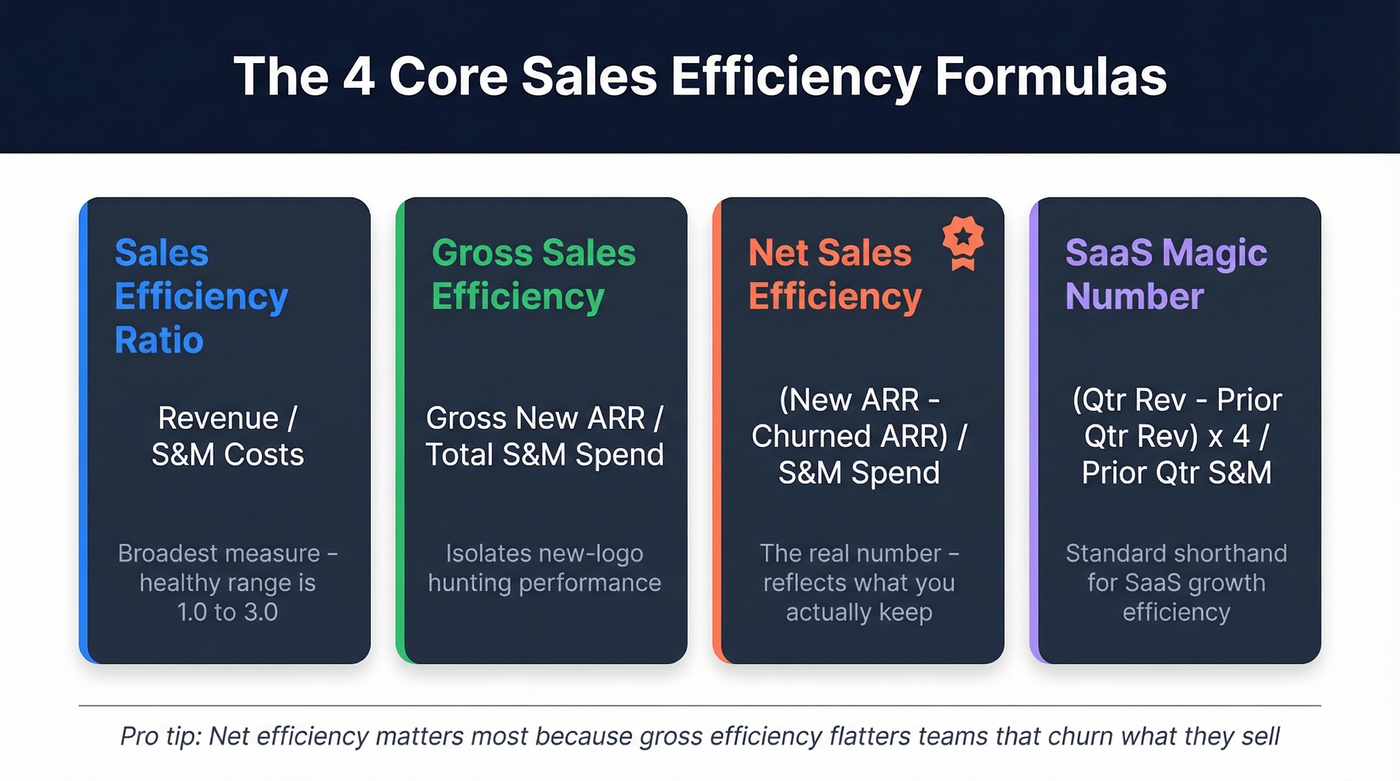
Core Formulas Explained
Sales Efficiency Ratio
Formula: Revenue / Sales & Marketing Costs
This is the broadest measure and the most commonly referenced. If your team generated $4M in revenue last quarter and spent $2.5M on S&M, your ratio is 1.6.
| Ratio | Interpretation |
|---|---|
| < 1.0 | Losing money per sale |
| 1.0-3.0 | Healthy range |
| > 3.0 | Exceptional (or underinvesting) |
A ratio above 3.0 sounds great, but it often means you're leaving growth on the table. You could be spending more and still generating efficient returns.
Gross Sales Efficiency
Formula: Gross New ARR / Total S&M Spend
This isolates new-logo performance. If you added $3M in new ARR on $2M in S&M spend, your gross efficiency is 1.5. Use this when you want to evaluate your hunting motion separately from expansion.
Net Sales Efficiency
Formula: Net New ARR (New ARR - Churned ARR) / Total S&M Spend
This is the one that matters most. If you added $3M in new ARR but churned $800K, your net new ARR is $2.2M. Divide by $2M in S&M spend and you get 1.1 - a very different story from the 1.5 gross number. Net efficiency is the "real" number because it reflects what your GTM engine actually retains.
SaaS Magic Number
Formula: (Current Quarter Revenue - Prior Quarter Revenue) x 4 / Prior Quarter S&M Spend
Originally developed by Scale Venture Partners, this has become the standard shorthand for SaaS growth efficiency.
If your revenue grew from $10.0M to $11.5M quarter-over-quarter, and you spent $4M on S&M last quarter: ($11.5M - $10.0M) x 4 / $4M = 1.5.
| Magic Number | Signal |
|---|---|
| < 0.5 | Spending isn't converting |
| 0.5-0.75 | Acceptable, room to improve |
| > 0.75 | Efficient growth |
One nuance most articles skip: you use prior quarter's S&M spend, not current quarter's. This quarter's revenue growth was driven by last quarter's investment. Getting this wrong is surprisingly common.
Benchmarks by Stage and Deal Size
Flat benchmarks are useless. A Seed-stage company and a Series C company have completely different cost structures, deal sizes, and team compositions. Let's break this down by the dimensions that actually matter.
Revenue per Rep by Stage and ACV
This data comes from Optifai's benchmark of 312 B2B SaaS companies and 2,400+ sales reps.
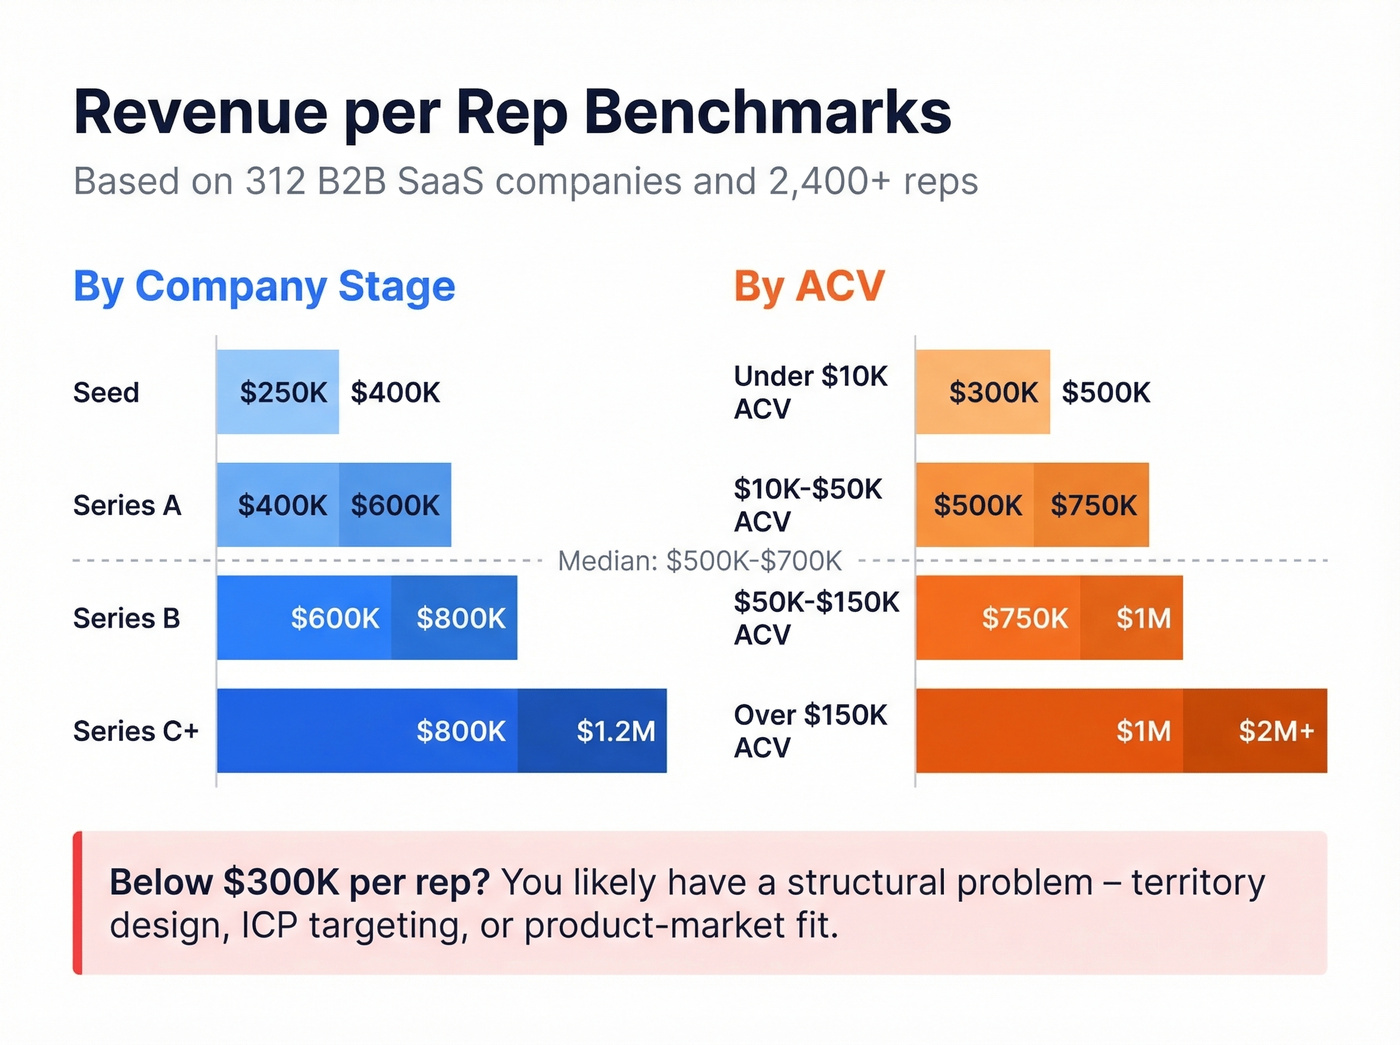
By company stage (annual):
| Stage | Revenue per Rep |
|---|---|
| Seed | $250-400K |
| Series A | $400-600K |
| Series B | $600-800K |
| Series C+ | $800K-$1.2M |
By ACV:
| ACV Range | Revenue per Rep |
|---|---|
| < $10K | $300-500K |
| $10-50K | $500-750K |
| $50-150K | $750K-$1M |
| > $150K | $1M-$2M+ |
The median across all stages sits at $500-700K, with top-quartile performers hitting $900K+. If your reps are below $300K, you've got a structural problem - territory design, ICP targeting, or product-market fit.
Sales Cycle Length by Deal Size
These benchmarks from Focus Digital are critical inputs for pipeline velocity calculations.
| ACV | Avg Cycle (Days) |
|---|---|
| < $1K | 25 |
| $1K-$5K | 40 |
| $5K-$10K | 55 |
| $10K-$50K | 75 |
| $50K-$100K | 120 |
| $100K-$250K | 170 |
| $250K-$500K | 220 |
| > $500K | 270 |
Industry matters too. Software companies average 90 days, financial services 98 days, retail 70 days, and energy 155 days. Company size is another axis entirely: selling to a 10-person startup averages 38 days, while a 10,000+ employee enterprise averages 185 days. If you're comparing your cycle length to a flat "industry average," you're comparing apples to aircraft carriers.
The Investor View
When PE firms and growth investors evaluate GTM efficiency, they look at three things beyond the Magic Number, per Sumeru Equity's framework.
Quota achievement: 80-90% is the healthy range on a trailing twelve-month basis. The catch is that your quota pool needs to reflect ramping reps at reduced quotas. If you're measuring new hires against full quota, your achievement number is artificially depressed.
S&M payback period: 1-2 years is generally good for B2B SaaS. Anything beyond 2 years means you're financing customer acquisition with a long runway - fine if you have the capital, dangerous if you don't.
S&M as % of revenue: Best used as a trend metric. The absolute number varies wildly by stage, but the direction tells you whether you're getting more efficient or less.
Your revenue-per-rep benchmark means nothing if reps burn 40% of their time chasing wrong emails and dead phone numbers. Prospeo delivers 98% verified emails and 125M+ direct dials - so every dollar of S&M spend converts into pipeline, not bounce reports.
Fix your efficiency ratio at the source: the data.
Diagnostic Metrics Beyond the Ratio
The core formulas tell you where you are. These tell you why.
Pipeline Velocity
Formula: (Number of Opportunities x Average Deal Value x Win Rate) / Sales Cycle Length
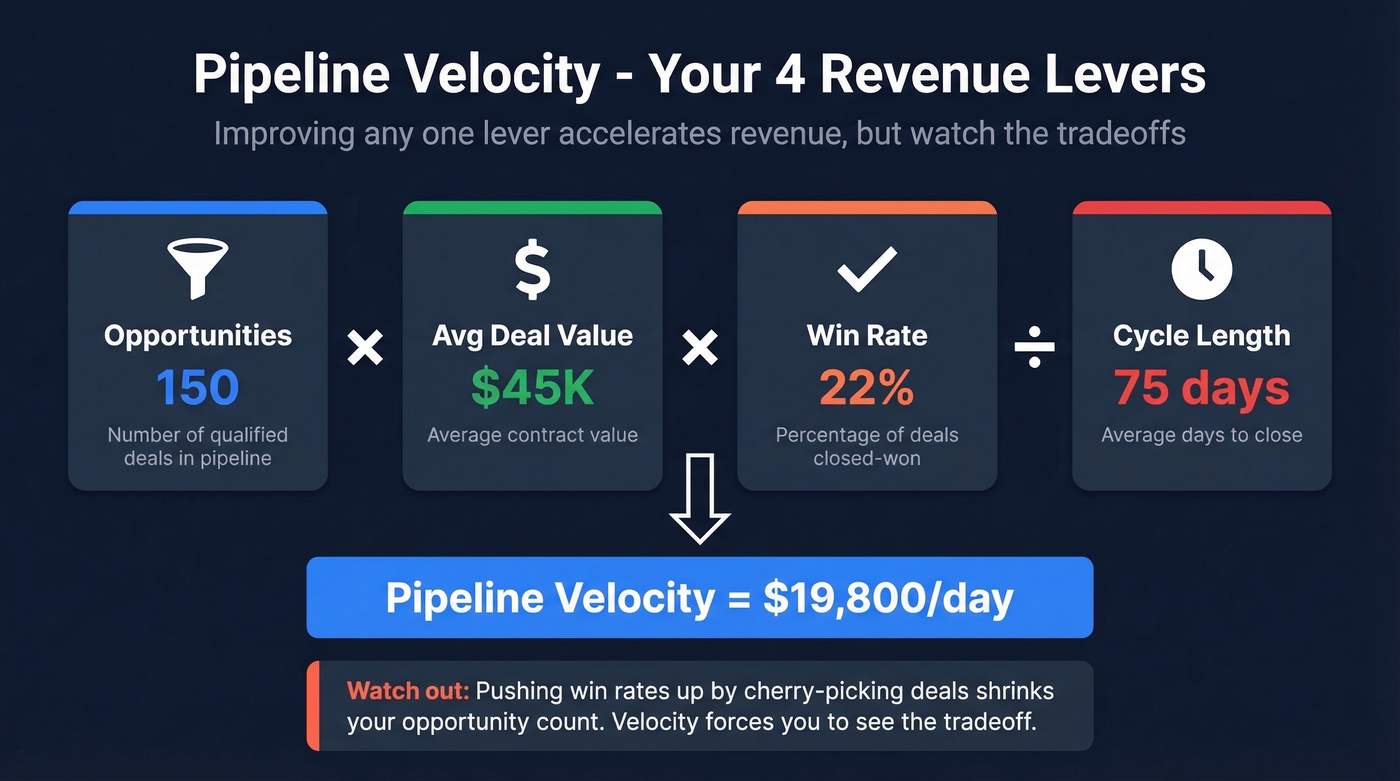
This is the single best diagnostic metric for revenue operations because it captures four levers simultaneously, and improving any one of them accelerates revenue. Here's the trap, though: optimizing one lever can hurt another. We've seen teams push win rates up by cherry-picking deals, which looks great until you realize they've also shrunk their opportunity count. Pipeline velocity forces you to see the tradeoff.
CAC Payback Period
Formula: CAC / (ARR per Customer x Subscription Gross Margin %)
If your average CAC is $25,000, your average new customer ACV is $30,000, and your subscription gross margin is 80%, your payback is: $25,000 / ($30,000 x 0.80) = 1.04 years. Solid.
I can't stress this enough: use subscription-specific gross margin, not blended company gross margin. If you sell software at 82% margin but also do implementation services at 30% margin, your blended number will make payback look worse than it is for your recurring revenue stream. The SaaS CFO has a good deep dive on this distinction.
LTV:CAC and Cost of Net New ARR
A 3:1 LTV:CAC ratio is the standard target. More actionable is the Cost of Net New ARR, which KeyBanc Capital Markets tracks across their SaaS portfolio. The benchmark: it costs $1.15 to generate $1 of new-logo ARR, but only $0.57 to generate $1 of expansion ARR. That 2x difference is why the best efficiency-focused teams invest heavily in expansion motions.
Five Metrics That Destroy Performance
Not every metric makes your team better. Some actively make them worse. Skip these as team KPIs.
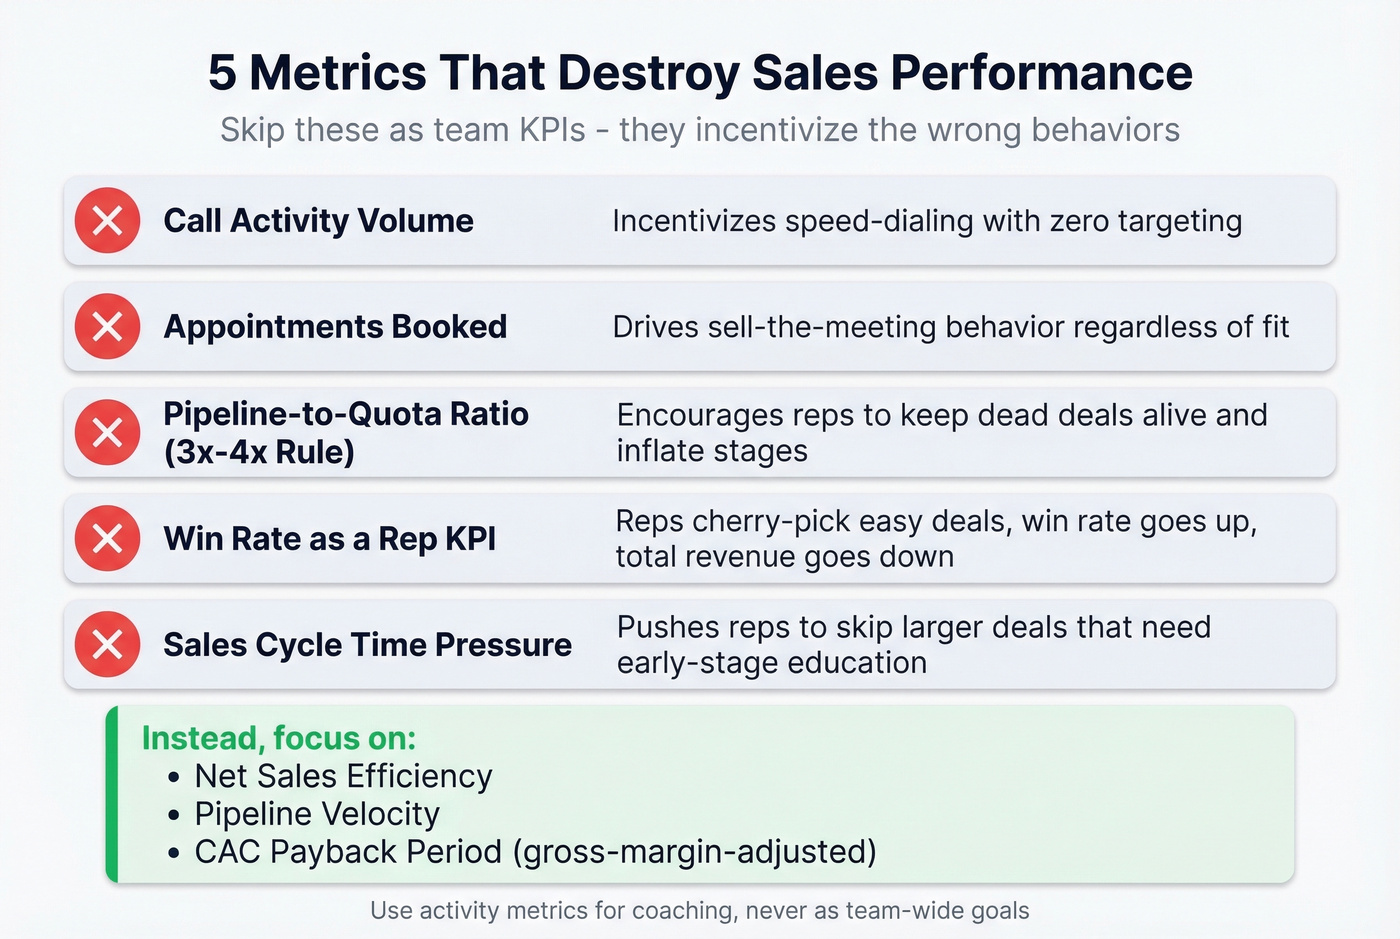
Call activity volume. Incentivizes speed-dialing through lists with no regard for targeting. Useful as a personal coaching baseline, never as a team-wide goal.
Appointments booked. Drives "sell the meeting" behavior where reps optimize for getting someone on a call regardless of fit. Every bad-fit appointment costs rep time, AE cycles, and pipeline credibility.
Pipeline-to-quota ratio (the 3x-4x rule). Encourages reps to keep dead deals alive and inflate stage estimates. The pipeline looks healthy on paper while the actual close rate craters.
Win rate as a rep KPI. When reps are measured on win rate, they avoid deals they might lose. They cherry-pick, delay entering opportunities, and push back on marketing leads. Win rate goes up. Total revenue goes down.
Sales cycle time pressure. Pushes reps to engage only with buyers already near a decision - missing larger deals that require early-stage education.
Common Calculation Mistakes
These errors are rampant, and they make your metrics unreliable.
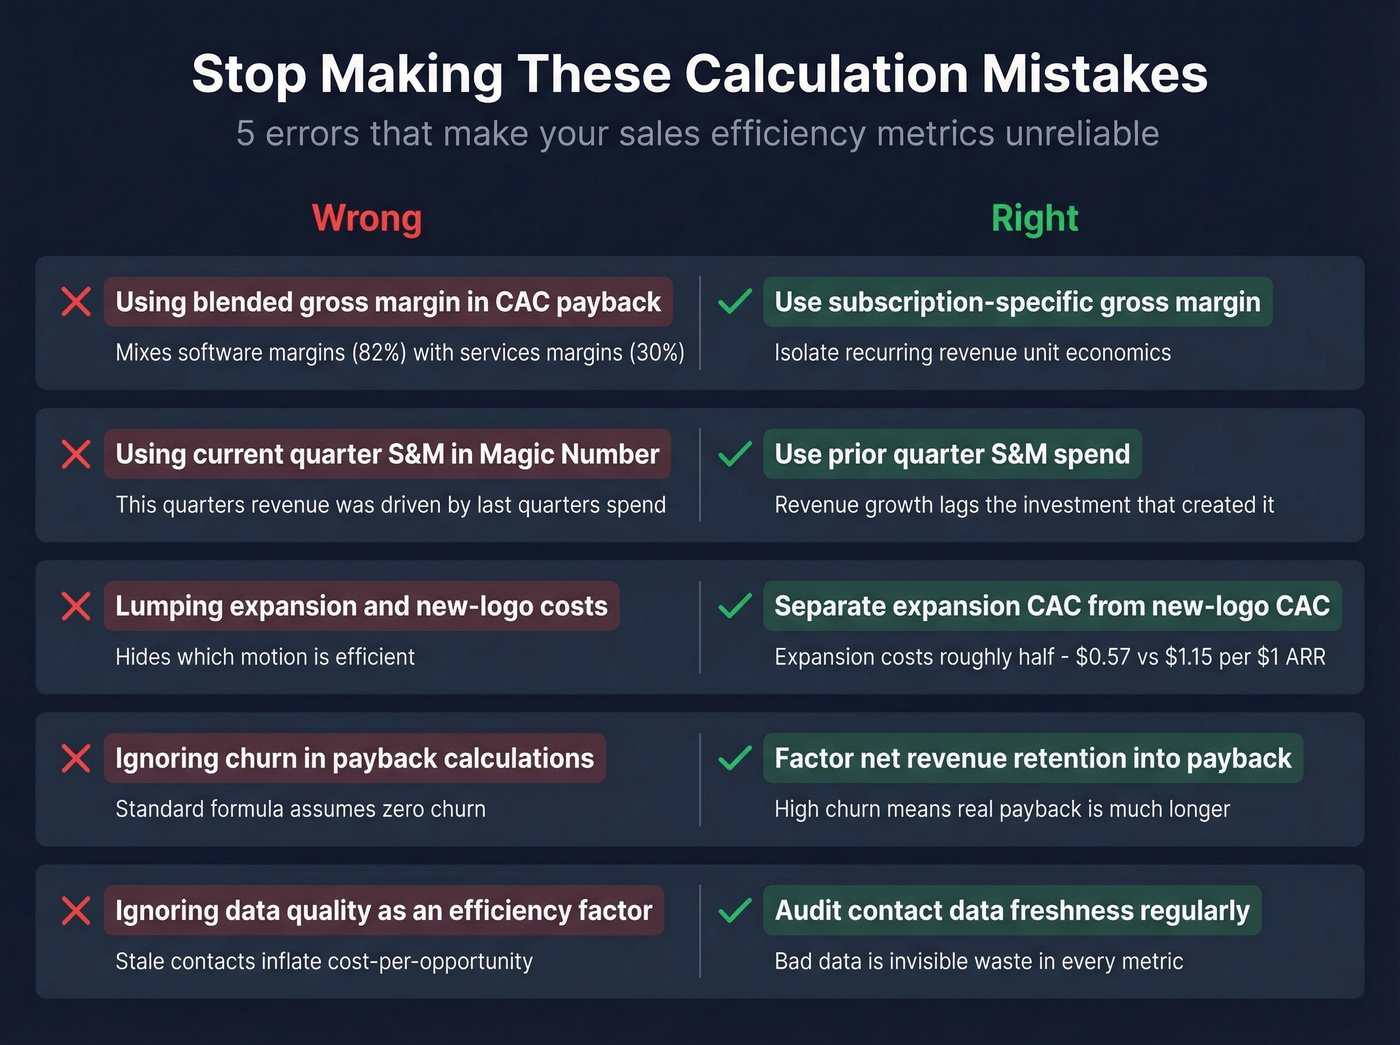
Using blended gross margin in CAC payback. If your company has multiple revenue streams, you must tie gross margin to the specific stream you're measuring. A blended number is meaningless for understanding subscription unit economics.
Wrong quarter's S&M in the Magic Number. The denominator should be prior quarter's S&M spend, not current quarter's. This quarter's revenue growth was seeded by last quarter's investment.
Lumping expansion and new-logo costs together. Expansion ARR costs roughly half what new-logo ARR costs. If you blend them into a single CAC, you can't tell whether your hunting motion or your farming motion is efficient.
Ignoring churn in payback calculations. The standard CAC payback formula doesn't factor churn. If churn is high, your real payback is longer than the formula suggests. (If you need a clean way to quantify it, start with a proper churn analysis.)
Overlooking data quality as an efficiency factor. Your metrics are only as good as your underlying data. If your contact database refreshes every six weeks, your cost-per-opportunity is inflated by outreach that never reaches a real person.
How to Improve Sales Efficiency
Knowing the formulas is step one. Here's what actually moves the numbers.
Fix your data before optimizing your process. This is the fastest lever and the most overlooked. Your team sends 10,000 emails in a quarter. 3,200 bounce. Another 2,000 go to people who've changed jobs. That's over half your outreach generating zero pipeline while still costing rep time, tool spend, and domain reputation. Every bounced email inflates the denominator of your efficiency ratio without adding a cent to the numerator. (If you're diagnosing this, start with email bounce rate and email deliverability.)
Prospeo's 98% email accuracy and 7-day data refresh cycle directly attack this problem. Snyk's 50-person AE team went from 35-40% bounce rates to under 5% after switching, and AE-sourced pipeline jumped 180%.
Reduce non-selling time. Bain & Company reports that sellers spend roughly 25% of their time actually selling. Even a 10-point improvement - from 25% to 35% - effectively adds 40% more selling capacity without hiring a single rep.
Tighten ICP targeting. Broad targeting feels like it maximizes opportunity count, but it tanks win rate and lengthens cycles. Narrow ruthlessly. (A simple way to operationalize this is a consistent lead scoring model.)
Redesign process before adding tools. New software on top of a broken process just produces broken results faster. If you're rebuilding the system, use a structured sales process optimization approach.
Pipeline velocity has four levers - and bad contact data quietly destroys all of them. Teams using Prospeo book 26% more meetings than ZoomInfo users, cut bounce rates under 4%, and shorten cycles by reaching real buyers on the first attempt. At $0.01 per email, your CAC payback period shrinks fast.
Stop financing bad data. Start compounding pipeline velocity.
How AI Drives Peak Efficiency in 2026
The Bain data is compelling: early AI deployments show 30%+ improvement in win rates and meaningful increases in time spent selling. If reps currently spend 25% of their time on actual selling, AI-driven automation of research, CRM entry, and follow-up scheduling could push that toward 35-40%. (If you're evaluating tools, start with generative AI sales tools and AI tools for automating sales follow-ups.)
Here's the thing, though: Bain's own research emphasizes that meaningful gains require process redesign, not just tool adoption. The teams seeing real results rethought their pipeline stages, qualification criteria, and handoff processes before layering in AI. The metric to watch isn't "did we buy an AI tool" - it's whether pipeline velocity and CAC payback actually improved after implementation.
For teams with average deals under $15K, you probably don't need a complex efficiency dashboard. Track net sales efficiency and pipeline velocity. That's it. The teams drowning in metrics are almost always the ones avoiding the harder work of fixing their ICP, their data, or their process.
FAQ
What is a good sales efficiency ratio?
Above 1.0 means you're generating more revenue than you spend on S&M; the 1.0-3.0 range is healthy for most B2B SaaS companies. For the Magic Number specifically, above 0.75 signals efficient growth. Thresholds shift by stage - a Seed company at 0.6 is fine, while a Series C at 0.6 has a structural problem needing immediate attention.
What's the difference between gross and net sales efficiency?
Gross efficiency measures new ARR generated per dollar of S&M spend, ignoring churn entirely. Net efficiency subtracts churned ARR before dividing, showing what your GTM engine actually retains. A team can look great on gross while hemorrhaging customers - the net number exposes that gap.
How do you calculate the SaaS Magic Number?
Take the difference between current and prior quarter revenue, multiply by 4 to annualize, then divide by the prior quarter's S&M spend. The prior-quarter denominator is the part most people get wrong - this quarter's growth was driven by last quarter's investment.
How does data quality affect sales efficiency metrics?
Stale or inaccurate contact data inflates your S&M costs without generating pipeline, dragging every efficiency ratio down. Teams using weekly-refresh data with 98% email accuracy typically cut bounce rates from 30-40% to under 5%, directly improving cost-per-opportunity and the overall efficiency ratio.