How to Analyze a Sales Forecast (Not Just Build One)
Four in five sales and finance leaders missed a quarterly forecast in the past year. The problem isn't building a forecast - it's that nobody runs a proper sales forecast analysis afterward. Every guide out there teaches forecasting methods: weighted pipeline, stage-based, top-down. Almost none teach you how to grade the result, find the failure points, and make the next cycle better.
This one does.
Three things to track after every forecast period: forecast bias, WMAPE, and deal-level win rate by stage.
What Sales Forecast Analysis Actually Means
Forecasting predicts future revenue. Forecast analysis is everything that happens after the number lands - measuring accuracy, identifying directional bias, decomposing variance into root causes, and feeding insights back into the next cycle. Different disciplines. Most teams only do the first.
A forecast is a living hypothesis, not a fixed target. It encodes assumptions about pipeline health, rep behavior, and market conditions, all of which shift week to week. 97% of professionals agree the right data would make accurate forecasts easier. The gap isn't awareness - it's process.
How to Measure Forecast Accuracy
Not all accuracy metrics tell you the same thing:
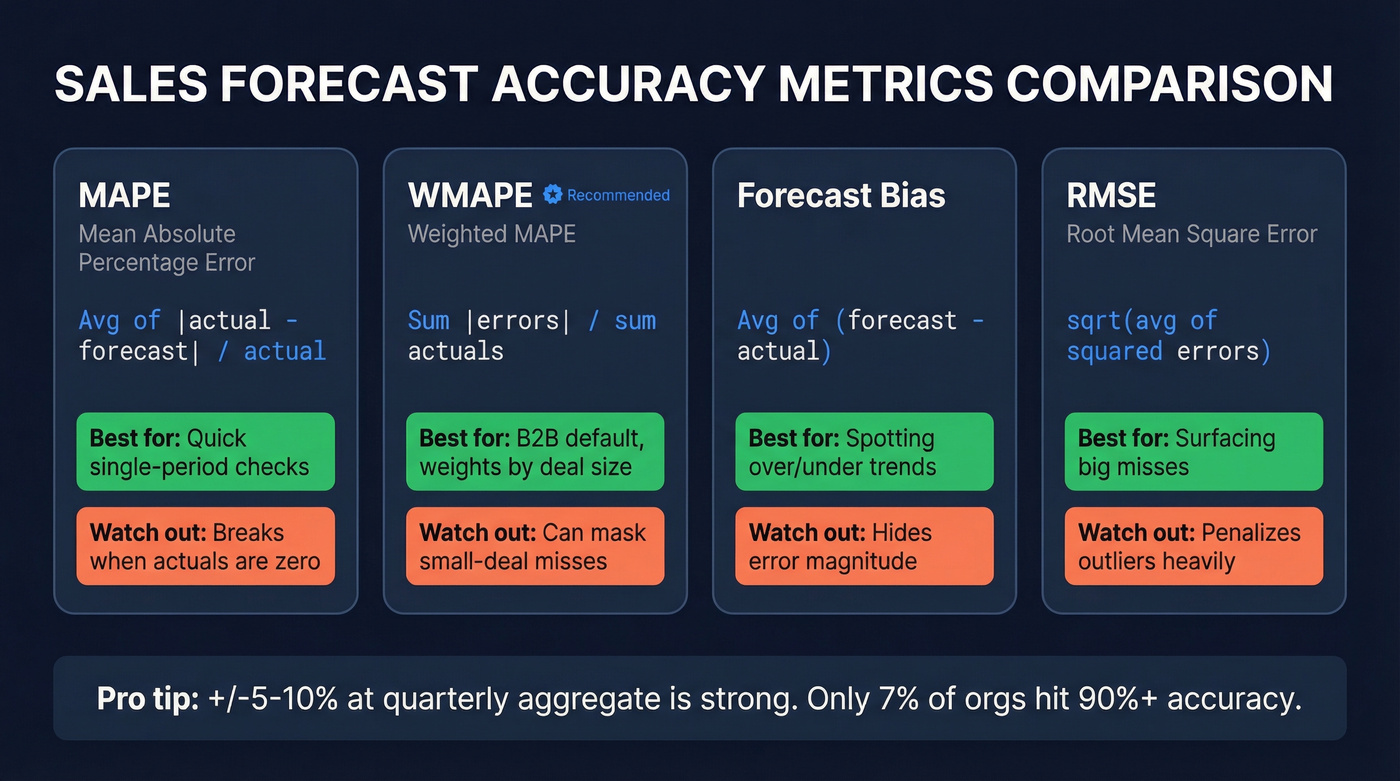
| Metric | Formula | When to Use | Limitation |
|---|---|---|---|
| MAPE | Avg of |actual - forecast| / actual | Quick single-period check | Breaks with zero actuals |
| WMAPE | Sum |errors| / sum actuals | Default for B2B (weighted) | Masks small-deal misses |
| Forecast Bias | Avg of (forecast - actual) | Detecting over/under trend | Doesn't show magnitude |
| RMSE | sqrt(avg of squared errors) | Surfacing big misses | Penalizes outliers hard |
We recommend WMAPE as your default. It weights errors by deal value, so a $500K miss counts more than a $5K miss - which is exactly how your CFO thinks about forecast quality.
One nuance that trips people up: accuracy expectations change by aggregation level. At the quarterly company-wide number, +/-5-10% is strong. At the individual deal level, +/-20-30% is normal. Only about 7% of sales organizations hit forecast accuracy of 90% or higher, so if you're in the +/-10% range at aggregate, you're ahead of most teams out there.
How to Run a Variance Analysis
Variance analysis asks "where did the forecast break?" Here's the step-by-step:
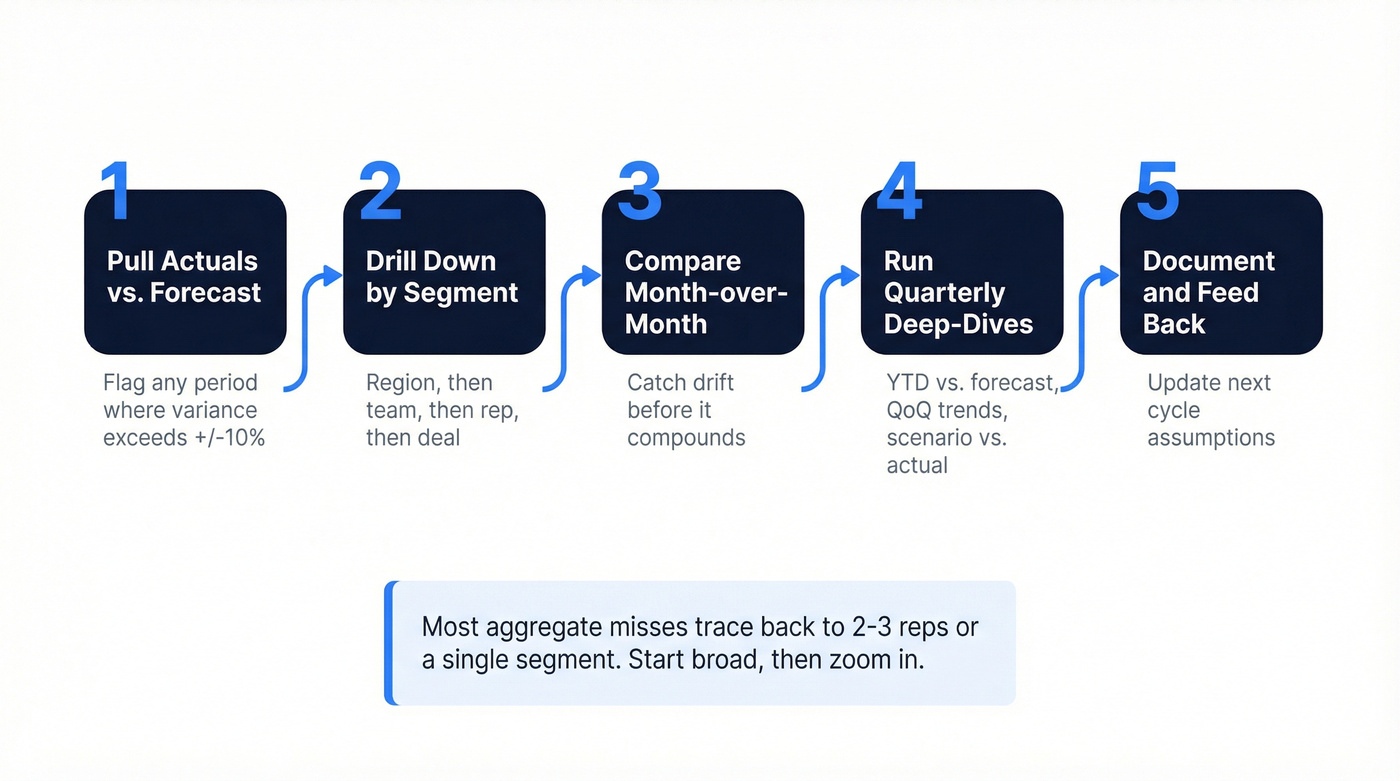
- Pull actuals vs. forecast at the company level. Flag any period where variance exceeds +/-10%.
- Drill down through region, then team, then rep, then deal. Most aggregate misses trace back to 2-3 reps or a single segment.
- Compare month-over-month trends to catch drift before it compounds.
- Run quarterly deep-dives - YTD vs. forecast, QoQ trends, scenario vs. actual. This is where root-cause work happens.
- Document findings and feed them into the next forecast cycle's assumptions.
A well-structured spreadsheet beats a poorly configured BI dashboard every time. Don't overthink the tooling. The forecasted sales report from each period becomes your baseline for future calibration - but only if someone actually reads it and acts on it.
If you want to pressure-test the assumptions behind your model, start with pipeline health and the most common sales pipeline challenges that quietly inflate commit.
Most forecast misses start upstream - with stale contacts inflating your pipeline. Prospeo's 7-day data refresh and 98% email accuracy ensure every deal in your CRM is built on real, reachable buyers. Snyk cut bounce rates from 35% to under 5% and grew AE-sourced pipeline 180%.
Fix your pipeline data and your forecast fixes itself.
Root-Cause Decomposition: Price, Volume, and Mix
Most forecasting guides stop at "you missed." Price-Volume-Mix decomposition tells you how you missed - and what to do about it.
Say you beat your quarterly target by EUR500K. The drivers matter more than the headline:
- +EUR200K from volume - 3% more deals closed than planned. Pipeline generation is working.
- +EUR250K from price - average selling prices came in higher, meaning discounting discipline improved or you moved upmarket.
- +EUR50K from mix - more revenue came from higher-margin product lines.
Each driver demands a different response. Volume wins validate demand gen. Price wins suggest you underestimated willingness to pay. Mix shifts signal a product-market fit change worth doubling down on.
Without decomposition, you just see "+EUR500K" and learn nothing.
Detecting and Calibrating Rep Bias
Here's the thing: the consensus on r/sales and related forecasting threads is blunt - over-relying on rep commit is "almost always influenced by optimism, quota pressure, and ownership bias." In our experience, reps who over-commit by 15-20% do so consistently. It's a pattern, not a one-off. Use that historical data to calibrate their future forecasts.
This is also where a clean sales operations metrics scorecard helps you separate rep behavior from process issues.
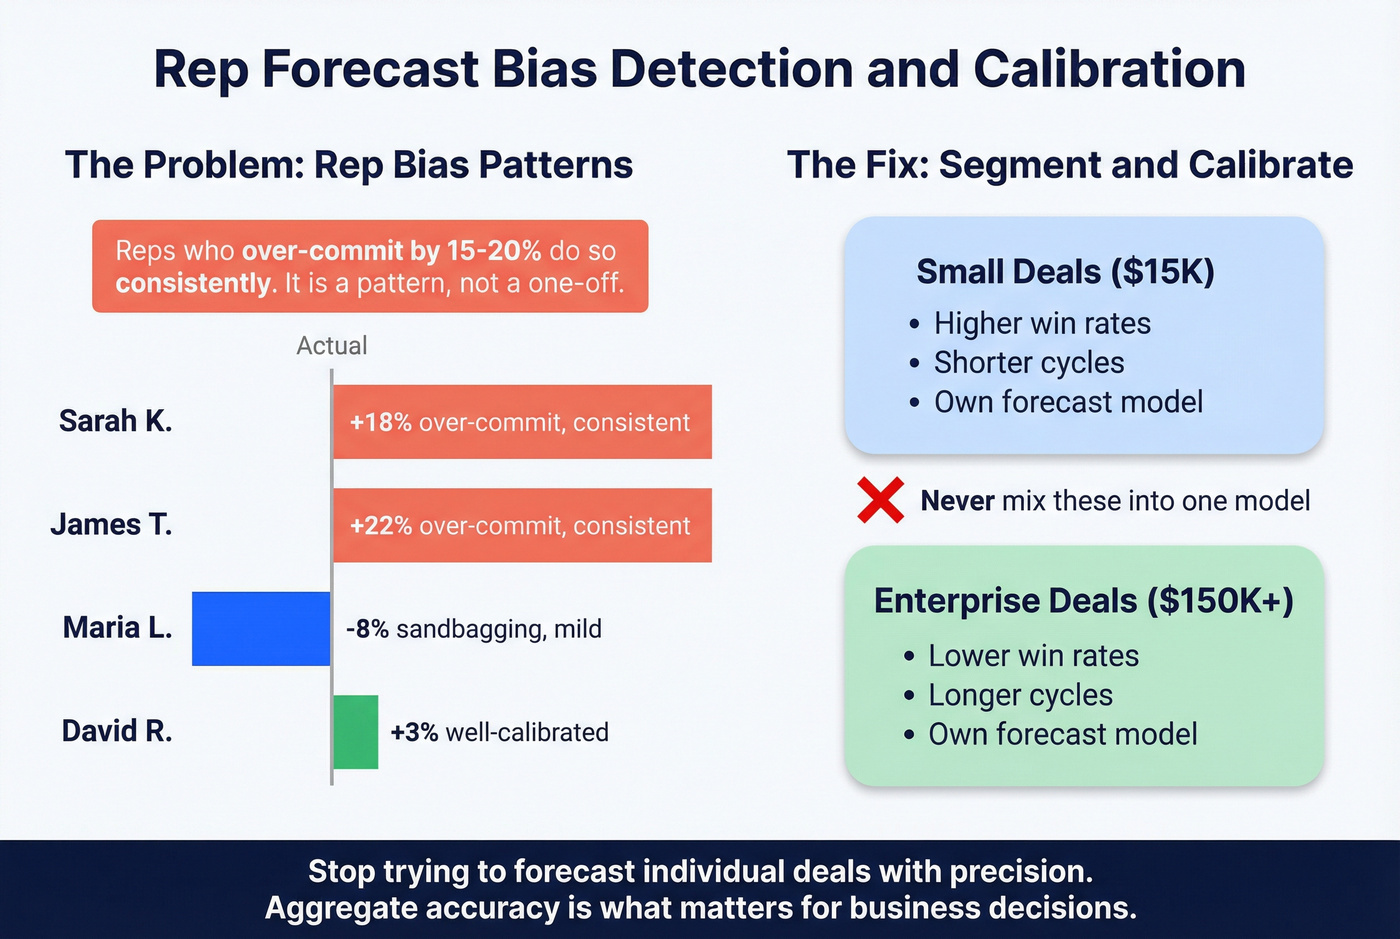
Segmentation matters too. Mixing $15K and $150K deals into one model distorts everything - different win rates, cycle lengths, and stage-conversion patterns. New business and renewals need separate forecast models for the same reason.
Let's be honest about something most forecast articles won't say: stop trying to forecast individual deals with precision. You can't. Aggregate accuracy is what matters for business decisions. Obsessing over whether Deal #4,217 closes in March or April is a waste of RevOps cycles. Put that energy into calibrating your model at the segment level instead.
If you need a clearer line between targets and predictions, align stakeholders on sales forecast vs sales goal before the next cycle starts.
Tools and Signals That Sharpen Forecast Analysis
Salesforce + Excel is how most teams actually forecast. As one RevOps leader put it on r/SalesOperations, even teams running Salesforce and Gong still default back to spreadsheets for the detail they need. That's pragmatic, not a failure.
If you're evaluating platforms, compare sales forecasting solutions and the broader landscape of best sales forecasting tools before you rebuild your process around a dashboard.
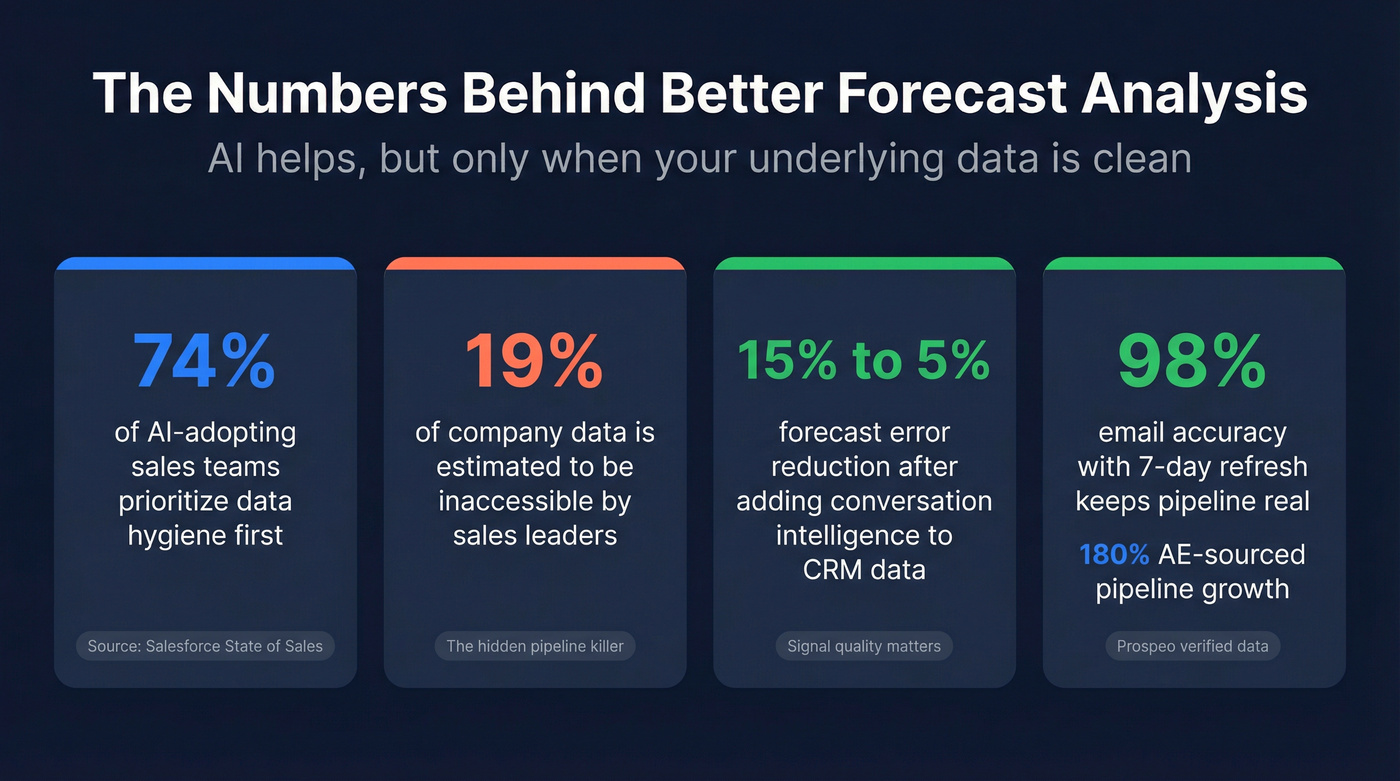
Where technology moves the needle is signal quality. We've seen teams cut forecast error from ~15% to 5% after layering conversation intelligence on top of CRM data. 74% of AI-adopting sales teams prioritize data hygiene first - the right instinct. AI on dirty data just gives you confident wrong answers faster.
Upstream data quality is a forecasting issue most teams ignore entirely. Sales leaders estimate 19% of company data is inaccessible, and if a third of your contacts bounce, your pipeline is inflated with deals that were never real. Prospeo's 98% email accuracy and 7-day data refresh cycle clean the pipeline before analysis begins - Snyk saw bounce rates drop from 35-40% to under 5%, and AE-sourced pipeline jumped 180%.
If you're diagnosing bounces specifically, start with email bounce rate and then work backward into email deliverability root causes.
Skip the data quality step if you want, but don't be surprised when your Q3 forecast misses by 20% because half your "pipeline" was built on stale contacts who left their companies six months ago.
You just learned that volume, price, and mix drive forecast variance. But none of that analysis matters if 19% of your contact data is stale. Prospeo enriches your CRM with 50+ data points per contact at a 92% match rate - so your pipeline reflects reality, not ghosts.
Accurate forecasts start at $0.01 per verified email.
Sales Forecast Analysis FAQ
How often should you analyze your forecast?
Monthly variance reviews at minimum, with quarterly deep-dives that include root-cause decomposition and rep bias calibration. Teams that treat forecasting and reporting as a continuous loop - not a one-time event - consistently outperform those that only revisit numbers at quarter-end.
What's a good forecast accuracy rate?
+/-5-10% at the quarterly aggregate level is strong. Only ~7% of sales organizations achieve 90%+ accuracy. At the individual deal level, +/-20-30% variance is normal - don't benchmark rep-level precision against company-level targets.
What's the difference between sales analysis and forecasting?
Sales analysis examines historical performance: win rates, deal velocity, revenue by segment. Forecasting projects that data forward into future periods. Sales forecast analysis bridges the two by grading predictions against actuals, so each cycle gets more accurate.
How does data quality affect forecast accuracy?
Directly and measurably. Unverified contacts and stale records inflate your pipeline, which inflates your forecast. A 7-day data refresh cycle and verified emails remove phantom pipeline before it distorts your numbers - the kind of gap that turns a "solid Q2 outlook" into a missed quarter.