Sales Forecasting Methodology: How to Choose, Measure, and Get It Right
Your VP commits $2.4M on Monday's pipeline call. The CRM says $2.8M weighted. The quarter closes at $1.9M. Three "committed" deals vanished - one contact had left the company, one was a duplicate that never should've been in the pipeline, and one went dark after the demo. The forecast looked solid on paper. It always does.
The problem isn't that teams lack a sales forecasting methodology - it's that they forecast badly and have no framework to diagnose why. A 400-person Xactly benchmark study found that four in five sales and finance leaders missed a quarterly forecast in the past year. Over half missed two or more.
What You Actually Need
Most forecasting guides list 8-12 methods like a restaurant menu. That's useless. You need one primary method and one accuracy metric. Get disciplined about those two before adding complexity.
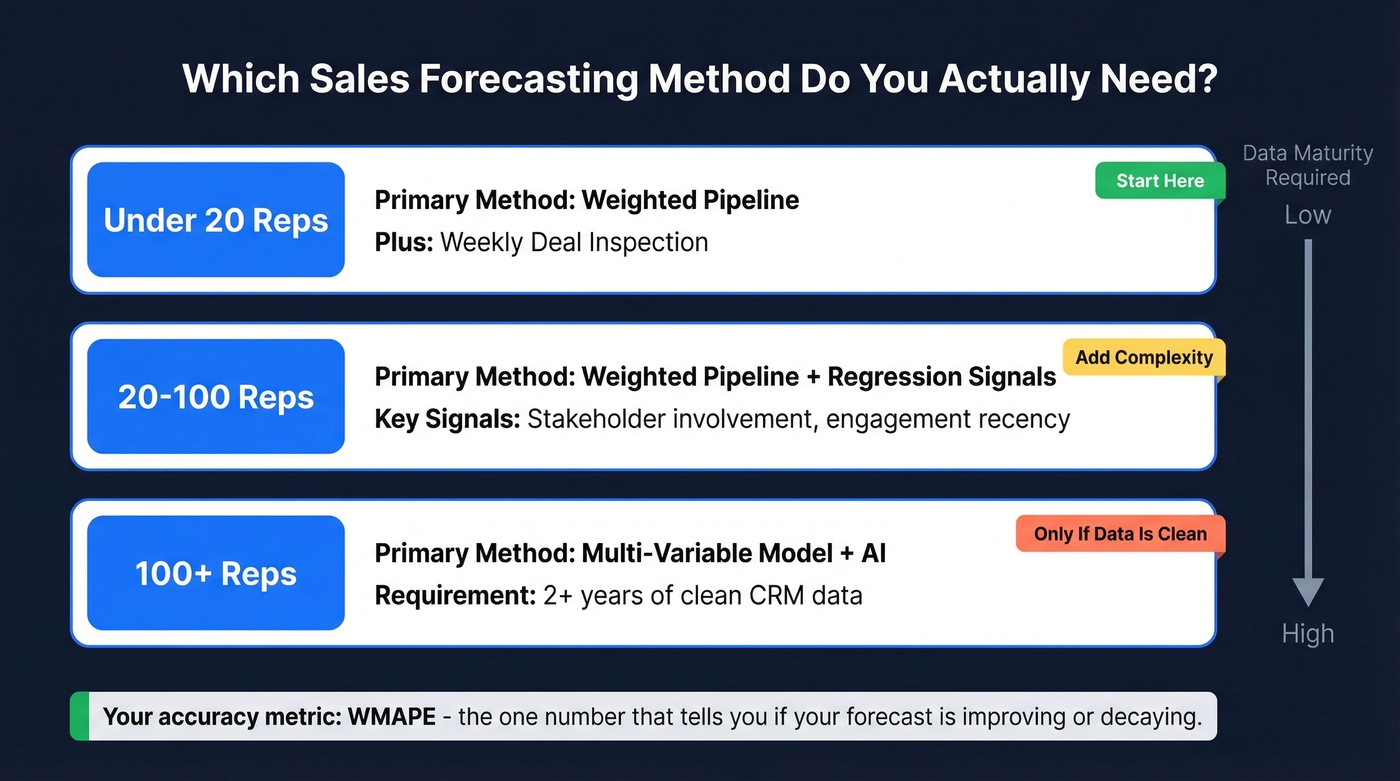
- Under 20 reps: Weighted pipeline + weekly deal inspection. Keep it simple.
- 20-100 reps: Weighted pipeline + regression signals like stakeholder involvement and engagement recency.
- 100+ reps: Multi-variable model + AI, but only if you've got 2+ years of clean CRM data.
Your accuracy metric should be WMAPE. We'll cover the formula below, but it's the one number that tells you whether your forecast is improving or decaying over time.
Forecast Accuracy in 2026
The data on forecast accuracy is grim.
That Xactly benchmark found 66% of teams cite reporting systems that can't access historical CRM or performance data as the top roadblock to accurate forecasting. Meanwhile, 97% agree that having the right data would make accurate forecasts easier. Everyone knows the problem. Almost nobody's solved it.
A 2019 survey of 296 sales leaders found that only 45% had high confidence in their organization's forecast accuracy. More recently, a 2026 Gartner survey of 243 senior sales leaders revealed that 49% say sales' definition of a qualified lead differs significantly from marketing's. When your pipeline inputs are misaligned before a deal even enters the funnel, no forecast method saves you.
Here's the thing: the methodology matters less than most people think. A mediocre approach applied consistently with clean data will beat a sophisticated model fed garbage every single time. Pick one method, measure it, and fix the data that feeds it.
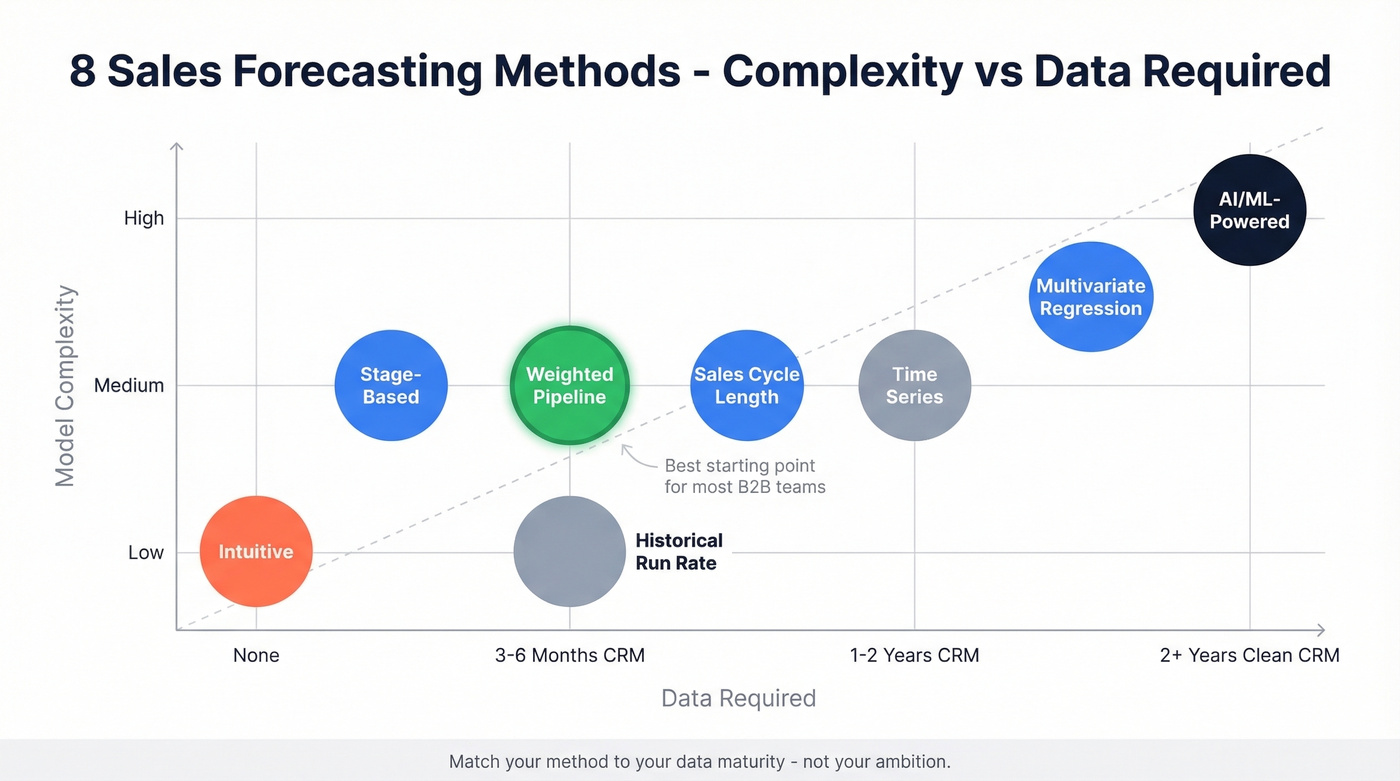
8 Forecasting Methods (With Formulas)
Understanding the different types of forecasting techniques helps you match complexity to your team's data maturity.
| Method | Complexity | Data Needed | Best For |
|---|---|---|---|
| Intuitive | Low | None | <10 deals, founder-led |
| Historical Run Rate | Low | 3+ quarters revenue | Stable recurring revenue |
| Stage-Based | Medium | Defined sales stages | 50+ active deals |
| Weighted Pipeline | Medium | 6+ months CRM history | Most B2B teams |
| Sales Cycle Length | Medium | Cycle time data | Long enterprise cycles |
| Multivariate Regression | High | 2+ years CRM | 20-100 reps with RevOps |
| Time Series | Medium | High transaction volume | Seasonal / demand forecasting |
| AI/ML-Powered | High | 2+ years clean CRM | 100+ reps, mature data |
Intuitive (Rep Judgment)
No formula - just a rep's gut feeling about whether a deal will close and when. This is where every team starts, and it's where "happy ears" live. A rep who had a great demo call will forecast that deal at 80% when the real probability is closer to 30%.
Works for early-stage startups with fewer than 10 active deals where the founder knows every prospect personally. Breaks the moment your team exceeds five reps, because you can't calibrate five different people's intuition against each other. Skip this if you've got more than a handful of active deals.
Historical Run Rate
Formula: Last period revenue x growth factor = forecast
If you closed $500K last quarter and you're growing ~15% QoQ, your run-rate forecast is $575K. Simple, fast, and surprisingly useful for stable businesses. Breaks when market conditions shift, you launch a new product, or your sales team size changes significantly - a team that doubled headcount last quarter can't use last quarter's revenue as a baseline.
Stage-Based (Opportunity Stage)
Formula: Sum of (deal value x stage probability) = forecast
Assign a close probability to each pipeline stage, multiply each deal's value by its stage probability, and sum the results:
| Stage | Probability |
|---|---|
| Discovery | 10% |
| Demo completed | 35% |
| Proposal sent | 75% |
| Legal/contract | 90% |
A $100K deal in Discovery contributes $10K to the forecast. The same deal at Proposal contributes $75K. Works for teams with 50+ active deals and a consistent sales process where stages actually mean something. Breaks when reps skip stages or park deals in "Demo completed" for months without any buyer activity.
Weighted Pipeline
This is the most popular method and the most misunderstood. The formula is identical to stage-based forecasting, but the weights are calibrated against your actual historical conversion rates rather than arbitrary percentages.
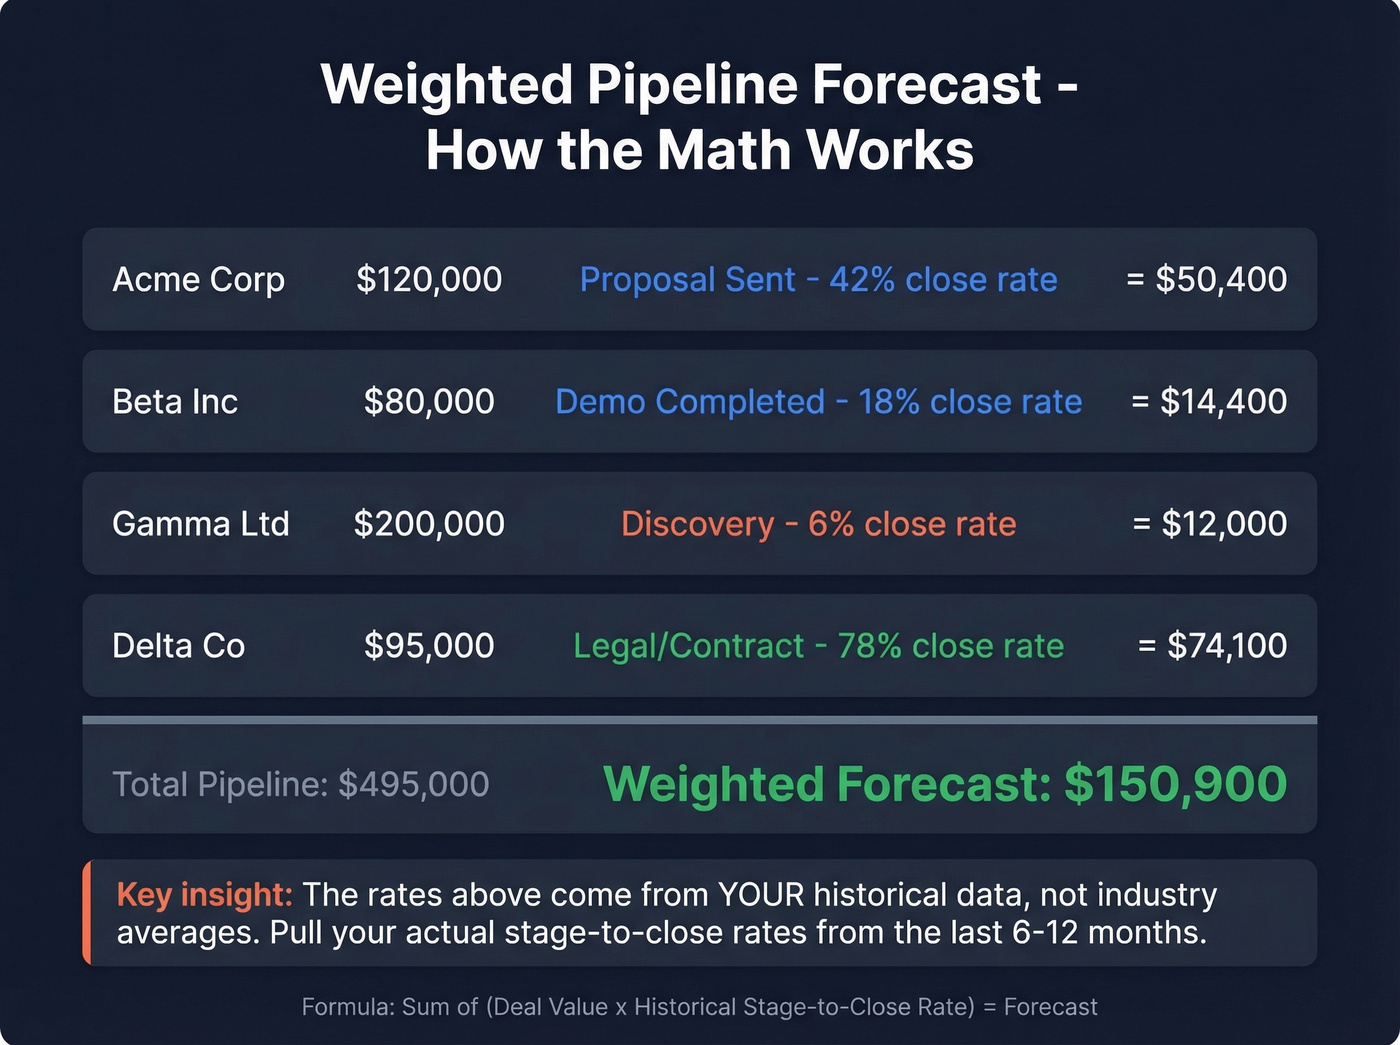
Formula: Sum of (deal value x historical stage-to-close rate) = forecast
We've asked dozens of sales leaders whether they trust their weighted pipeline number. None of them do - and they're right to be skeptical. Large deals skew the total, reps sandbag or inflate, stages get shortcutted, and CRM data is rarely current. Standardized qualification frameworks like MEDDIC or BANT improve the inputs by forcing reps to validate deal health before assigning a stage. For most B2B teams between 10 and 100 reps, this is still the best starting point because it balances simplicity with data-driven calibration.
Sales Cycle Length
Formula: Average cycle length -> expected close date -> probability curve
If your average enterprise deal takes 90 days from first meeting to close, a deal active for 75 days has a higher probability than one at day 15. You're mapping deals onto a time-based probability curve. Breaks when cycle lengths vary wildly by segment - if SMB closes in 30 days and Enterprise takes 120, you need separate models.
Multivariate Regression
Instead of relying on a single variable like stage or time, you combine behavioral signals: stakeholder involvement, meeting frequency, email engagement, and dark funnel signals like content consumption and intent data that never show up in your CRM.
The classic example: if a VP-level executive is involved by the second meeting, close rates hit 80%. Without VP involvement, that same deal type closes at 20%. That's a 4x difference from a single variable that most stage-based models completely ignore.
Works for teams with 2+ years of CRM data and a RevOps team that can build and maintain the model. Of all the forecasting techniques available, regression delivers the best balance of accuracy and interpretability for mid-size teams - it's where we'd point most growing organizations before they jump to AI.
Time Series (Moving Average)
Formula: Forecast = (Revenue1 + Revenue2 + ... + Revenuen) / n
Take the last 3-6 periods of revenue and average them. Exponential smoothing weights recent periods more heavily. Works for seasonal businesses with high transaction volume - you need hundreds of data points per period for the math to work. Not useful for deal-level B2B forecasting.
AI/ML-Powered Forecasting
AI tools detect patterns across hundreds of variables - email sentiment, meeting cadence, stakeholder changes, deal velocity, calendar patterns - and generate probability scores that update in real time.
Let's be honest: AI needs 2+ years of clean CRM data to outperform a well-calibrated weighted pipeline. Without that foundation, you're training a model on garbage. The consensus on r/sales and r/salesops is that historical sales data is often "contaminated" by prior optimization decisions like discounting, territory changes, and rep reassignments, so the model learns to predict what happened, not what should happen. If your CRM hygiene isn't already strong, save your money and nail the fundamentals first.
Choosing the Right Approach
The HBR classic from 1971 still holds: match your forecasting approach to your decision type, available data, and time horizon. The tools have changed. The principle hasn't.
| Criteria | Under 20 Reps | 20-100 Reps | 100+ Reps |
|---|---|---|---|
| Primary method | Weighted pipeline | Weighted + regression | Multi-variable + AI |
| Data needed | 6+ months CRM | 1-2 years CRM | 2+ years clean CRM |
| Cadence | Weekly deal review | Weekly + monthly | Continuous + quarterly |
| Complexity | Low | Medium | High |
For teams under 20 reps, don't overthink this. Weighted pipeline plus rigorous weekly deal inspection will outperform any AI tool you don't have the data to feed. The biggest accuracy gains at this stage come from deal qualification discipline, not model sophistication.
For mid-size teams, start incorporating regression signals. Which deals have executive sponsors? Which ones have gone quiet for two weeks? These signals improve your stage-based probabilities without requiring a data science team.
For large organizations, the AI stack starts earning its keep - but only if you've already got the fundamentals right. We've seen teams buy Clari or Gong's forecasting features and get worse results because their underlying CRM data was a mess. The model is only as good as what you feed it.
Implementation Checklist
If you're starting from scratch or resetting a broken process, do these five things before touching any tool:
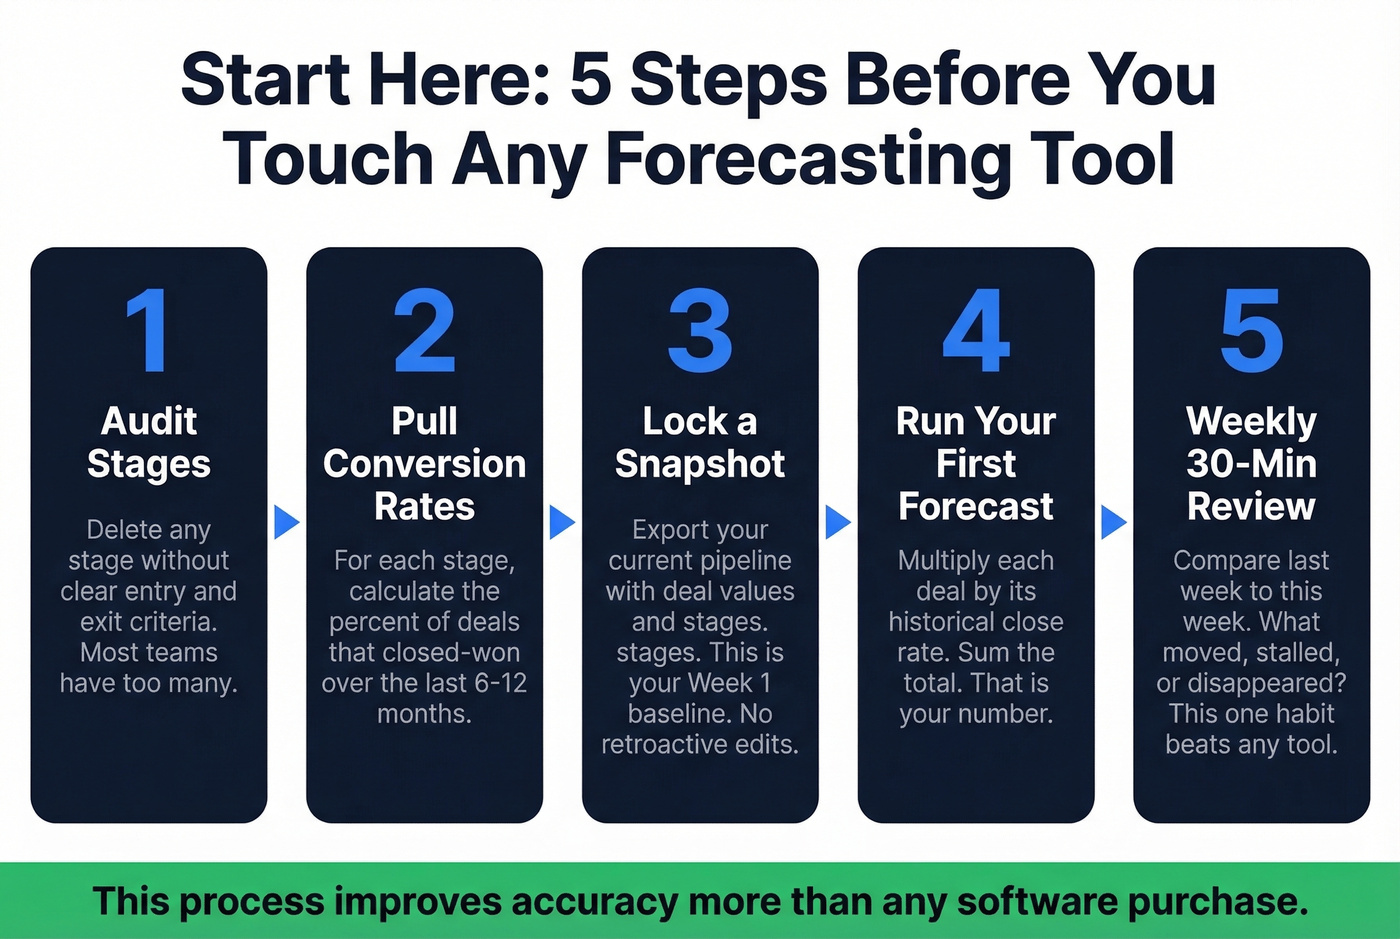
- Audit your pipeline stages. Delete any stage that doesn't have clear entry and exit criteria. Most teams have too many.
- Pull historical conversion rates. For each stage, calculate the percentage of deals that ultimately closed-won over the last 6-12 months. These are your weights.
- Lock a snapshot. Export your current pipeline with deal values and stages. This is your Week 1 baseline. Nobody touches it retroactively.
- Run your first weighted forecast. Multiply each deal by its historical stage-to-close rate. Sum the total. That's your number.
- Schedule a 30-minute weekly review. Compare last week's snapshot to this week's reality. Which deals moved? Which stalled? Which disappeared? This single habit improves accuracy more than any tool purchase.
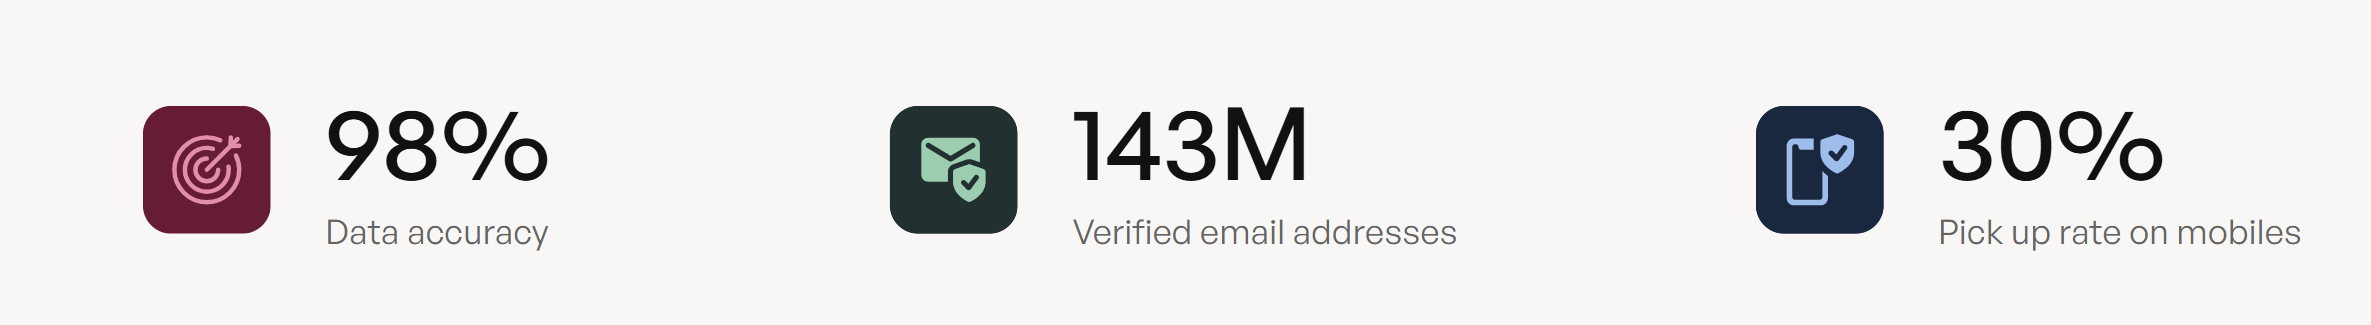
Three "committed" deals vanished because one contact left, one was a duplicate, and one went dark. Prospeo's 7-day data refresh catches job changes before they wreck your forecast, and automatic deduplication keeps your pipeline clean. 98% email accuracy means the contacts in your CRM are real.
Stop forecasting on top of stale, duplicate, and dead data.
Measuring Forecast Accuracy
You can't improve what you don't measure. Most teams don't measure forecast accuracy at all - they just remember whether they "hit the number" and move on. That's not measurement. That's vibes.
WMAPE Formula
Formula: WMAPE = Sum of |Actual - Forecast| / Sum of Actual
This is the metric for executive reporting. It weights errors by deal size, so a $500K miss matters more than a $5K miss. Standard MAPE treats them equally, which makes no sense in B2B.
Worked example: You forecast three segments - Enterprise ($800K forecast, $700K actual), Mid-Market ($400K forecast, $450K actual), SMB ($200K forecast, $180K actual). WMAPE = (|700-800| + |450-400| + |180-200|) / (700+450+180) = $170K / $1,330K = 12.8%.
MAE and Bias %
MAE (Mean Absolute Error) gives you the average dollar miss per segment or deal. In the example above, MAE = $170K / 3 = ~$56.7K average miss per segment. Use it for segment-level diagnostics.
Bias % = Sum of (Actual - Forecast) / Sum of Actual. Positive bias means you're consistently under-forecasting; negative means you're over-forecasting. This is how you detect systematic problems - if your team always forecasts 10% high, that's a calibration issue you can fix with a simple adjustment factor.
Which Metric, When
Use WMAPE for board-level reporting and quarter-over-quarter improvement tracking. Use MAE for diagnosing which segments or reps are driving the miss. Use Bias % to detect systematic over- or under-forecasting.
Practical thresholds: +/-5% WMAPE on a 30-day forecast is strong for B2B. +/-10-15% on a 90-day forecast is realistic. If you're consistently above 20%, the problem isn't your method - it's your data or your deal qualification.
Lock Your Snapshot
You cannot measure accuracy without a locked forecast snapshot. At the start of each period, freeze the number. Don't let anyone revise it retroactively. Compare actuals against that frozen number. Without this discipline, you're measuring nothing.
One more warning: watch for the aggregation fallacy. Your top-line forecast can be 100% accurate while hiding massive segment-level misses. Enterprise under-forecasts by $200K, SMB over-forecasts by $200K - net error is zero, but your resource allocation was wrong in both directions.
Mistakes That Kill Accuracy
These are the patterns we see repeatedly. Most teams are making at least three simultaneously.
Happy ears and rep gut feel. This is the #1 forecast killer. A rep who just had a "great call" will forecast a deal at 80% that hasn't passed any qualification gate. Fix: require MEDDIC or BANT completion before a deal can be forecasted above 50%.
Messy CRM data. If a meaningful chunk of your pipeline contacts have outdated information, your stage-based probabilities are built on fiction. Enforce data hygiene standards and verify contact data regularly - this isn't optional, it's the foundation everything else sits on.
Treating all deals in a stage as equal. A $500K deal at Proposal with an executive champion is fundamentally different from a $500K deal at Proposal where the champion just left the company. Add deal health scores on top of stage probabilities.
The next cluster of mistakes is subtler but equally damaging. Teams ignore dark funnel signals - email sentiment, meeting no-shows, delayed responses - that predict outcomes better than stage labels. They rely exclusively on lagging indicators like win/loss data instead of incorporating leading signals like stakeholder engagement and content consumption. And when 49% of organizations have misaligned lead definitions between sales and marketing, the pipeline feeding your forecast is already corrupted at the source.
Inconsistent methodology across teams. If EMEA uses weighted pipeline and North America uses rep judgment, you can't aggregate meaningfully. Standardize on one primary approach company-wide.
Two final mistakes that almost everyone makes: never running a forecast retrospective (30 minutes monthly - compare locked snapshot to actuals, identify patterns), and never connecting the forecast to action. A forecast that doesn't change behavior is just a spreadsheet. If the forecast says you'll miss by 15%, what are you doing about it this week?
The Data Quality Prerequisite
Every method above assumes your pipeline data reflects reality. For most teams, it doesn't.
Remember those three ghost deals from the intro? That scenario plays out every quarter at most companies. Pipeline contact data decays around 15-20% per quarter as people change jobs, companies restructure, and email addresses go stale. The 66% of teams that can't access historical performance data aren't just missing analytics - they're forecasting blind.

No sales forecasting methodology survives bad inputs. You can calibrate your stage probabilities perfectly and still miss by 20% if a fifth of your pipeline is phantom deals built on stale contacts.
Every forecasting method above depends on one thing: clean CRM data. Prospeo's enrichment API returns 50+ data points per contact at a 92% match rate - giving your regression models the stakeholder titles, engagement signals, and verified contacts they need to actually predict outcomes.
Feed your forecast real data starting at $0.01 per verified email.
Tools That Support Forecasting
Forecasting doesn't happen in a vacuum. The tool stack spans three categories.
CRM & Pipeline Management: Salesforce includes native forecasting at the Enterprise tier (~$165/user/mo). HubSpot's Sales Hub Professional (~$90/user/mo) covers basic pipeline forecasting. Both work fine for weighted pipeline and stage-based methods - the limiting factor is always data quality, not the tool.
Revenue Intelligence: Clari and Gong's forecasting features add AI on top of your CRM data to detect deal risk signals and generate probability scores. Clari typically runs $30-50K+/year for enterprise deployments. Outreach offers forecasting within its platform at roughly $100-130/user/mo depending on package. These tools earn their keep at the 100+ rep tier where manual deal inspection breaks down.
Data Quality: This is the category most teams skip - and it's the one that determines whether everything above actually works. Prospeo handles real-time email and phone verification, CRM enrichment, and intent data across 15,000 topics. Free tier available, roughly $0.01/email. For teams evaluating vendors, start with a shortlist of data enrichment services and sanity-check match rates against your CRM. For teams that want a free baseline, Excel and Google Sheets still work for small-scale forecast modeling - just don't expect them to fix your data.
FAQ
What's the best sales forecasting methodology?
For most B2B teams, weighted pipeline calibrated with deal-level signals - stakeholder involvement, engagement recency, qualification framework completion - outperforms intuitive or purely historical methods. Accuracy depends more on data quality and measurement discipline than on which specific technique you pick.
How do you calculate forecast accuracy?
Use WMAPE: sum of absolute differences between actual and forecast, divided by sum of actuals. A 30-day WMAPE under 5% is strong for B2B; under 15% for 90-day forecasts is realistic. Always compare against a locked snapshot, not a rolling number that gets revised.
How often should you update a sales forecast?
Weekly for operational decisions, monthly for strategic reviews, quarterly for board-level reporting. Lock a snapshot at the start of each period so you can measure accuracy against a fixed baseline rather than a moving target.
Why do sales forecasts miss so often?
Dirty CRM data, rep subjectivity inflating deal probability, and no measurement framework to diagnose errors. Most teams never freeze a forecast snapshot, so they can't even calculate how far off they were. The 66% of teams that can't access historical performance data are essentially guessing.
How does contact data quality affect forecast accuracy?
Stale contacts - people who've changed jobs, emails that bounce, disconnected phones - create phantom pipeline. If 15-20% of your contacts have decayed, your weighted pipeline systematically over-forecasts. Verifying contact data on a regular refresh cycle ensures your pipeline reflects real, reachable buyers rather than outdated records.