How to Build a Sales MIS Report That Actually Gets Used
84% of sales reps didn't meet quota last year. That's not a people problem - it's a visibility problem. When leadership can't see what's happening in the pipeline until month-end, every intervention comes too late. A well-built sales MIS report fixes that, but most of the ones we've seen are 47-tab monstrosities that nobody opens after the first week.
What Is a Sales MIS Report?
A sales MIS (Management Information System) report isn't a single spreadsheet. It's a structured pack of dashboards and tables that track how your sales engine performs across three dimensions: activity, pipeline, and revenue. Think of it as the operating system for your sales leadership's decision-making - the central management report that ties every metric together.
This is different from a financial MIS report, the kind that tracks cash flow, P&L, and balance sheet health. If you search for "MIS report," most top results describe the finance version. A sales-focused MIS report is built around pipeline stages, rep activity, and deal velocity. Different audience, different KPIs, different cadence.
The distinction from a generic sales dashboard also matters. A dashboard shows you what's happening right now. An MIS report layers in historical trends, variance analysis, and benchmark comparisons so you can see why it's happening and what to do about it. It's the difference between a speedometer and a full diagnostic readout.
Most teams conflate the two, build a pretty Salesforce dashboard, and call it reporting. That's why 67% of reps don't think they'll hit quota this year - the reporting infrastructure doesn't catch problems early enough to fix them.
Essential Report Structure
Every sales MIS report needs a three-part structure:
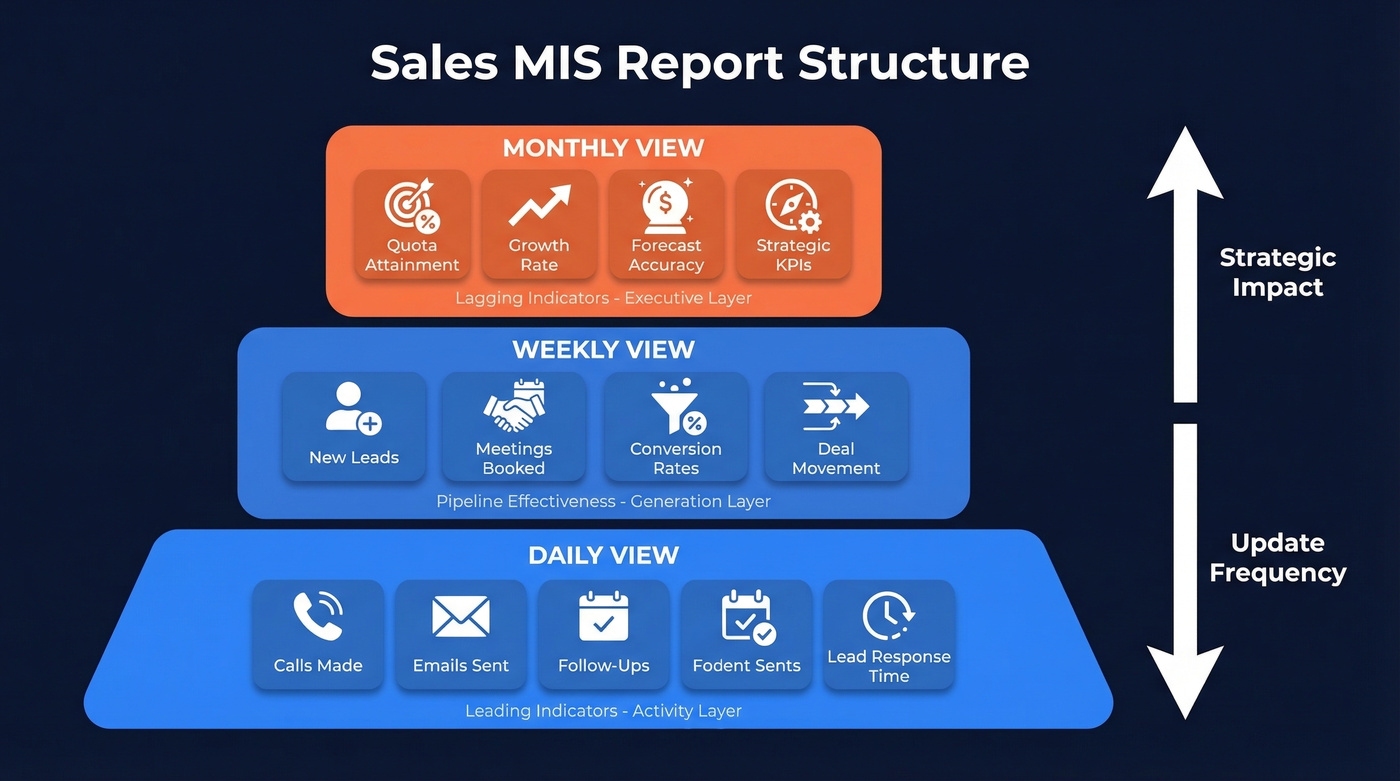
- Daily view - activity metrics like calls, emails, follow-ups, and lead response time. This is your leading indicator layer (and a great place to standardize sales activities).
- Weekly view - pipeline effectiveness: new leads, meetings booked, conversion rates, deal movement. This is where pipeline generation reporting lives, showing how much new pipeline your team creates each week.
- Monthly view - revenue outcomes: quota attainment, growth rate, strategic KPIs, forecast accuracy. The executive layer.
You need three deliverables to make this work. First, a KPI framework with formulas and benchmarks. Second, a clean workbook or BI tool with the right tab structure. Third, a stakeholder distribution plan so the right people see the right data at the right cadence. Let's build all three.
Core KPIs With Formulas and Benchmarks
The KPI table is the backbone of your report. Every metric needs a formula, a benchmark range, and a clear owner.
| KPI | Formula | Benchmark |
|---|---|---|
| Win Rate | (Deals Won / Total Closed) x 100 | 20-30% |
| Pipeline Coverage | Pipeline Value / Quota | 3-4x |
| Close Rate | (Won / Total Opportunities) x 100 | 15-25% |
| Deal Slippage | (Slipped Deals / Forecast) x 100 | <20% |
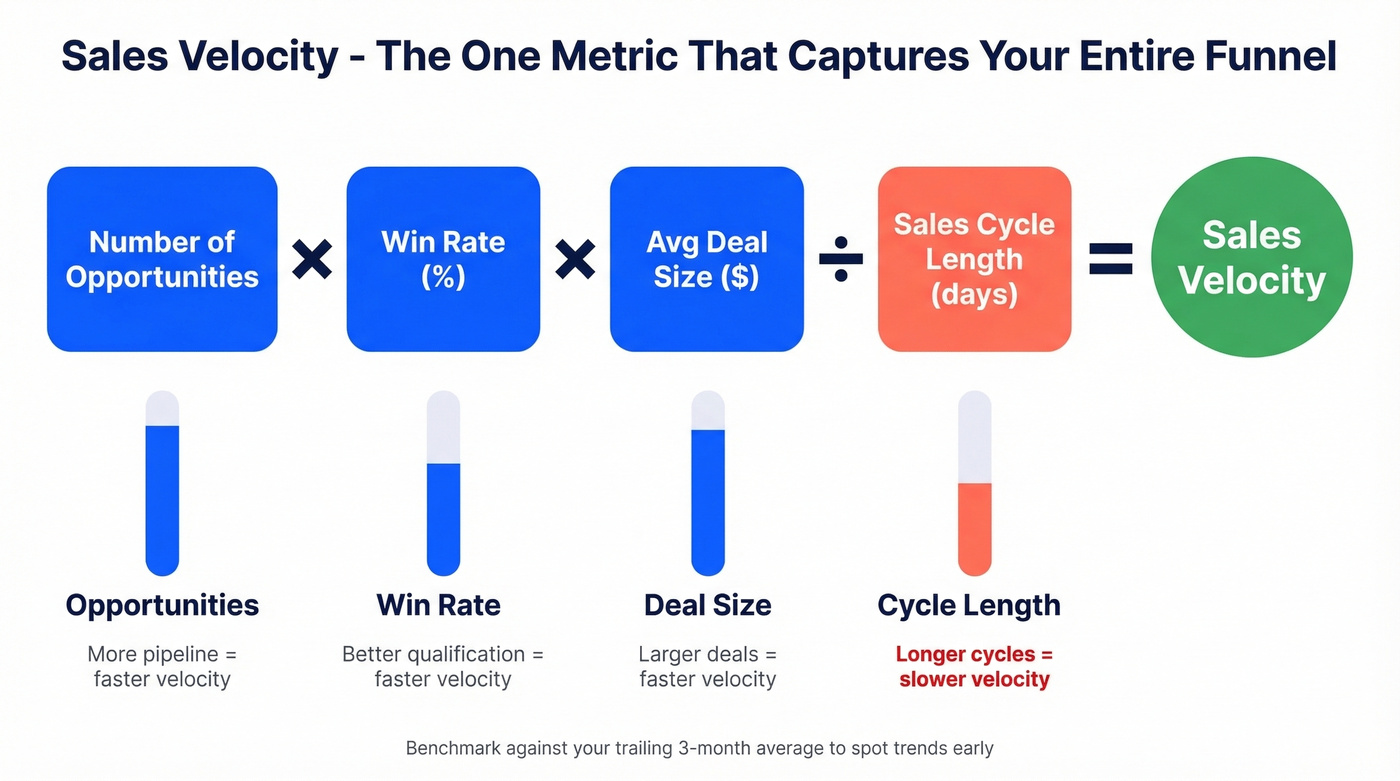
| Sales Velocity | (Opps x Win Rate x Avg Deal) / Cycle Length | Benchmark against trailing 3-month average |
| Sales Growth Rate | ((Current - Previous) / Previous) x 100 | 15-25% annual |
| Cycle Length | Avg days from opp creation to close | 3-6 months (B2B) |
| Follow-Up Rate | Total follow-up attempts / Total leads | Target 5+ per lead |
Sales velocity deserves special attention because it captures your entire funnel in a single number. If velocity is declining, something upstream is broken - fewer opportunities, lower win rates, smaller deals, or longer cycles. Your MIS should surface which lever is dragging.
If you want to go deeper on what to track (and how to interpret it), align this KPI set with your broader sales operations metrics so leadership isn't debating definitions every week.
Leading vs. Lagging Indicators
A complete MIS report needs both. Lagging indicators - revenue, quota attainment, win rate - tell you what already happened. They're rearview mirrors. Leading indicators - calls made, demos booked, pipeline created this week - tell you what's about to happen.
Here's the thing: most teams build a report that's 90% lagging. By the time you see revenue miss, the damage was done six weeks ago. Structure your report so daily and weekly views emphasize leading indicators, and monthly views emphasize lagging ones. That way, managers can intervene while there's still time to change the outcome, not just document the failure.
Sales Cycle Benchmarks
Your rep's deal is at 140 days. Is that bad? It depends entirely on your segment. A 140-day cycle is fast for enterprise energy deals and painfully slow for SMB SaaS. Without benchmark context, your cycle length KPI is just a number.
Here are the tables you need to calibrate your MIS, based on 2026 industry data:
By Industry:
| Industry | Avg Cycle (Days) |
|---|---|
| Retail | 70 |
| Software | 90 |
| Financial Services | 98 |
| Insurance | 127 |
| Manufacturing | 130 |
| Energy | 155 |
| Non-Profit | 162 |
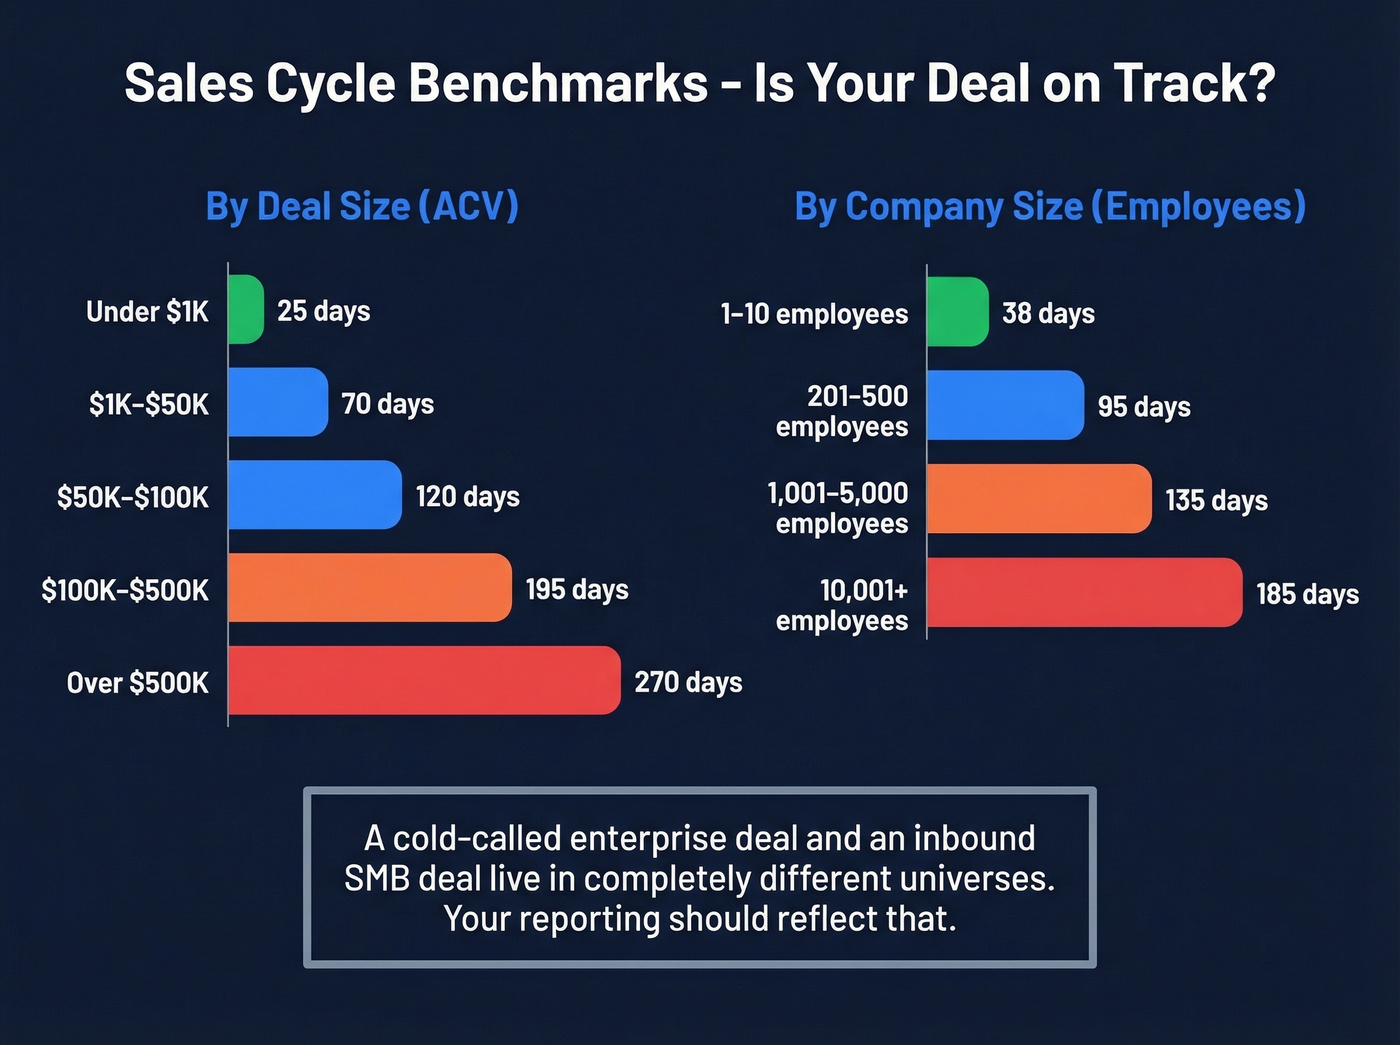
By Company Size (Prospect):
| Employee Count | Avg Cycle (Days) |
|---|---|
| 1-10 | 38 |
| 201-500 | 95 |
| 1,001-5,000 | 135 |
| 10,001+ | 185 |
By ACV:
| Deal Size | Avg Cycle (Days) |
|---|---|
| <$1K | 25 |
| $50K-$100K | 120 |
| >$500K | 270 |
By Channel & Complexity:
| Channel | Low Complexity | Medium Complexity | High Complexity |
|---|---|---|---|
| SEO / Inbound | 28 days | 60 days | 120 days |
| Paid Ads | 30 days | 65 days | 130 days |
| Cold Calling | 60 days | 90 days | 150 days |
| Referral | 20 days | 45 days | 100 days |
| Partner / Channel | 40 days | 80 days | 160 days |
That last table is the one most teams miss. A cold-called enterprise deal and an inbound SMB deal live in completely different universes, and your reporting should reflect that. Include the tables that match your business in your workbook's Definitions tab. When a rep's deal sits at 140 days in a segment where the benchmark is 90, that's a slippage signal your weekly review should catch.
How to Structure Your Workbook
The tab structure of your MIS workbook matters more than most people think. A messy workbook with formulas pointing everywhere breaks within a month.
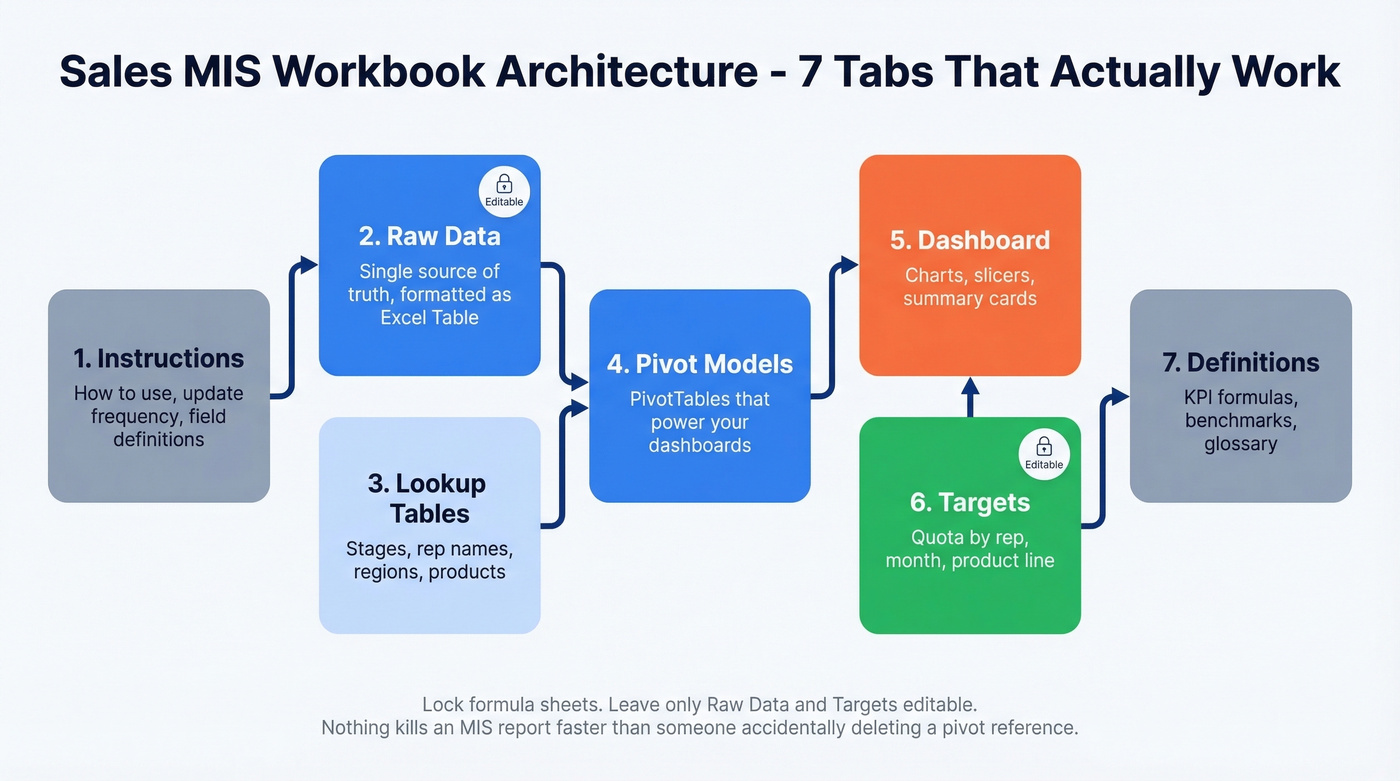
Use this seven-tab architecture:
- Instructions - how to use the workbook, update frequency, field definitions
- Raw Data - the single source of truth, formatted as an Excel Table
- Lookup Tables - pipeline stages, rep names, regions, product categories
- Pivot Models - PivotTables that power your dashboards
- Dashboard - the visual layer with charts, slicers, and summary cards
- Targets - quota by rep, by month, by product line
- Definitions - KPI formulas, benchmark ranges, glossary
For smaller teams, Salesflare's three-sheet approach works well: a Settings sheet for stages, team members, and targets; a Sales Funnel sheet for lead-level data entry; and a Sales Report sheet that auto-calculates from the funnel. Simpler, but harder to scale past about 15 reps.
Your raw data sheet needs clean columns. At minimum: OrderID, OrderDate, Region, Salesperson, ProductName, Units, Revenue. For B2B pipeline tracking, add Stage, DealSize, Probability, CreationDate, ExpectedCloseDate, and NextStep. If you're still standardizing what belongs in a CRM vs. a spreadsheet, it helps to review a few examples of a CRM and mirror their field conventions.
Pipeline coverage, deal slippage, sales velocity - every KPI in your MIS report depends on the quality of data feeding your CRM. Prospeo enriches your pipeline with 98% verified emails, 125M+ direct dials, and 50+ data points per contact, refreshed every 7 days.
Stop reporting on stale data. Start with contacts that actually connect.
Build It in Excel Step-by-Step
Here's the actual build process, assuming you've got your raw data ready.
Step 1: Format as Table. Select your data range and hit Ctrl+T. This gives you dynamic ranges that auto-expand when you add rows - critical for a report that updates weekly.
Step 2: Clean the data. Remove duplicates via Data > Remove Duplicates. Standardize naming so "CA" and "California" don't coexist. Ensure dates are actual date formats, not text strings. This step takes 30 minutes and saves you hours of debugging later.
Step 3: Build PivotTables. Insert a PivotTable on a new sheet. Drag Region into Rows, Revenue into Values. That's your first summary. Build separate pivots for rep performance, product mix, and pipeline stage distribution.
Step 4: Add charts. Select your PivotTable, insert a clustered column chart. Keep it simple - one chart per question you're answering. "Revenue by region" gets one chart. "Pipeline by stage" gets another. Don't combine them.
Step 5: Add slicers for interactivity. Click your PivotTable, go to Insert > Slicer, and pick Product Category or Region. Slicers let managers filter the dashboard without touching formulas, which means fewer panicked Slack messages about broken spreadsheets.
Step 6: Build variance analysis. In your Targets tab, add columns for Actual, Budget, Variance (=Actual-Budget), and Variance %. Apply conditional formatting - green fill when actual exceeds target, red when it falls short. This is your exception reporting layer (and it pairs well with a dedicated sales forecasting motion).
Step 7: Lock it down. Protect the formula sheets via Review > Protect Sheet. Leave only the Raw Data and Targets tabs editable. Nothing kills an MIS report faster than someone accidentally deleting a pivot reference.
Cadence and Distribution
Most teams get the report wrong not because of bad data, but because of bad timing. An anti-pattern we see constantly: daily revenue reports for B2B teams. Revenue doesn't move meaningfully in 24 hours, and daily revenue tracking creates anxiety without actionable insight. Save revenue for the monthly view.
| Frequency | Focus | Metrics |
|---|---|---|
| Daily | Activity | Calls, emails, follow-ups, lead response time |
| Weekly | Pipeline | New leads, meetings, conversion, deal movement |
| Monthly | Revenue | Quota attainment, growth, forecast accuracy |
80% of sales require five or more follow-up calls, but 44% of reps follow up only once. Your daily activity report should make this gap visible. If reps are averaging 1.2 follow-ups per lead, that's a coaching moment, not a mystery (and a good time to share sales follow-up templates with the team).
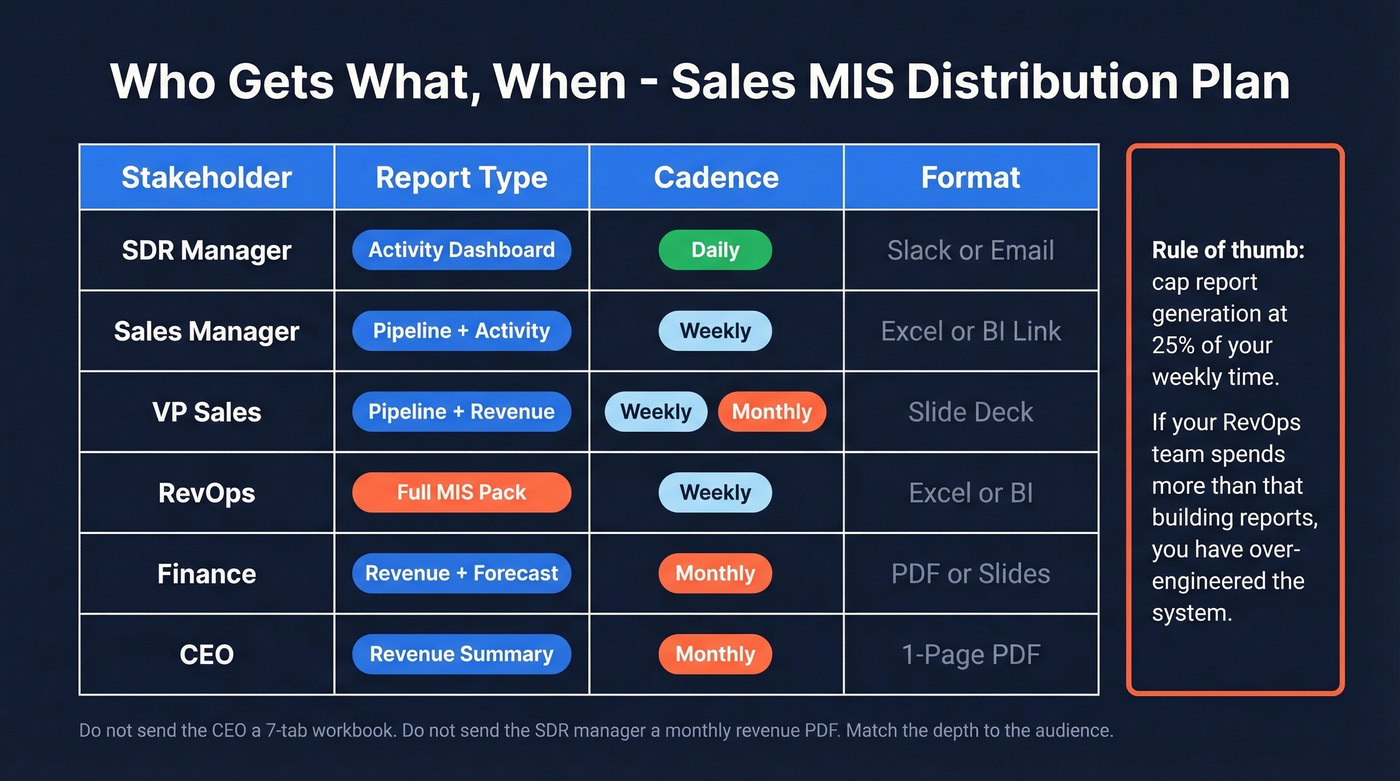
A useful rule of thumb: cap report generation at 25% of your weekly time. If your RevOps team is spending more than that building and distributing reports, you've over-engineered the system.
Stakeholder Distribution:
| Stakeholder | Report | Cadence | Format |
|---|---|---|---|
| SDR Manager | Activity dashboard | Daily | Slack/email |
| Sales Manager | Pipeline + activity | Weekly | Excel/BI link |
| VP Sales | Pipeline + revenue | Weekly + monthly | Slide deck |
| RevOps | Full MIS pack | Weekly | Excel/BI |
| Finance | Revenue + forecast | Monthly | PDF/slide |
| CEO | Revenue summary | Monthly | 1-page PDF |
Don't send the CEO a 7-tab workbook. Don't send the SDR manager a monthly revenue summary. Match the depth to the decision-maker.
Why Most MIS Reports Fail
McKinsey found that 82% of organizations spend at least one full day per week fixing master data issues. That tracks with what we've seen across dozens of sales orgs. Your sales MIS report is only as trustworthy as the data feeding it.
The most common data quality problems: duplicate records affect 60% of teams, human error another 60%, inconsistent formats 55%, and incomplete fields 32%. These aren't edge cases. They're the norm.
Data quality breaks down across four dimensions. Accuracy asks whether the data is correct. Completeness checks if fields are filled. Consistency ensures "CA" means California everywhere. Validity confirms that dates are actually dates. Your MIS should have a hygiene checklist:
- Document field definitions in your Definitions tab
- Use help text and dropdown validation in CRM fields
- Enforce templates for data entry - no free-text where a picklist works
- Automate where possible - manual entry is where errors breed
Let's be honest: most pipeline reporting problems aren't reporting problems at all - they're data problems wearing a reporting costume. A 12% reply rate looks like a messaging problem when it's actually a 30% bounce rate in disguise. If your CRM is full of stale emails and wrong phone numbers, your outreach KPIs are all corrupted from the start. Prospeo's 98% email accuracy and 7-day data refresh cycle catches this at the source, verifying lead data before it hits your CRM so your pipeline metrics reflect reality. If you're auditing list quality, start with email bounce rate as a leading indicator of data decay.
Your MIS shows cycle length creeping up? The fix often starts upstream - reaching the right buyers faster. Prospeo's 30+ filters (buyer intent, job changes, headcount growth) let you build lists that shorten cycles instead of padding them.
Teams using Prospeo book 35% more meetings than Apollo users.
Moving Beyond Excel
Excel works beautifully for teams under about 50 reps with a single data source. Beyond that, you'll hit walls: manual refreshes, version control nightmares, and the inability to blend CRM data with marketing or finance data in real time.
The natural first step is Power BI Pro. It connects to most common data sources and handles the pre-revenue/post-revenue dashboard split well. Tableau Creator is the move when you need advanced visualization or audience-specific dashboards - exec view vs. manager view vs. seller view. Build purpose-specific dashboards rather than one mega-dashboard: Sales Funnel, Actuals vs. Target, Team Performance, and Regional Heatmap are the four most common.
A dedicated pipeline generation report is also worth building separately. It isolates how much new pipeline each rep and channel creates per period, making it easier to diagnose sourcing gaps before they hit revenue. Skip this if your team is under 10 reps - the overhead won't justify the insight at that scale. If pipeline creation is a recurring issue, map it against common sales pipeline challenges so you fix the root cause, not the symptom.
None of these tools fix bad source data, though. If your CRM contacts are stale, even Tableau will just visualize garbage beautifully. The consensus on r/sales is pretty consistent on this point: invest in data quality upstream before spending on dashboards downstream.
The decision point is clear. When you have 50+ reps, multiple data sources, or need real-time updates, it's time to move. Until then, a well-built Excel workbook outperforms a poorly configured BI tool every time.
Free Templates to Start With
Don't build from scratch. These free templates give you a working foundation:
- Smartsheet Weekly Sales Activity Report - tracks daily calls, visits, leads, and revenue goals vs. actual. Available in Excel and Google Sheets.
- Smartsheet Daily Sales KPI Report - daily KPI dashboard across a month with charts and monthly averages.
- Salesflare Multi-Tab Workbook - the three-sheet architecture in Excel and Google Sheets. Best for teams under 30 reps.
- GitHub Sales MIS Report XLSX (312 KB) - a downloadable workbook you can reverse-engineer for your own structure.
Pick one, customize it with your KPIs and benchmarks from the tables above, and you'll have a working sales MIS report in an afternoon.
FAQ
What is a sales MIS report?
A structured set of dashboards and tables tracking revenue, pipeline health, rep activity, and conversion rates across daily, weekly, and monthly cadences. Unlike a live dashboard, it layers in historical trends, variance analysis, and benchmarks so leadership can diagnose problems and act before revenue misses.
What KPIs belong in a sales MIS report?
Win rate, pipeline coverage (3-4x), close rate, sales velocity, deal slippage (<20%), growth rate, and cycle length are the essential eight. Pair lagging indicators like quota attainment with leading ones like demos booked and follow-up rate for early warning signals.
How often should I update it?
Daily for activity metrics like calls, emails, and response time. Weekly for pipeline movement - new leads, conversion rates, deal progression. Monthly for revenue outcomes. Avoid daily revenue reports for B2B teams; they generate noise without actionable insight.
How do I keep the underlying data accurate?
Start with verified contact data before it enters your CRM - tools like Prospeo verify emails at 98% accuracy and refresh records every 7 days, which eliminates stale data at the source. Then enforce field definitions, use dropdown validation, remove duplicates regularly, and automate data entry wherever possible.
Can I build one in Excel or do I need BI tools?
Excel handles MIS reporting well for teams under about 50 reps. Use Format as Table, PivotTables, slicers, and conditional formatting. Graduate to Power BI or Tableau when you need real-time multi-source blending or audience-specific views.