How to Build a Sales Org Chart That Doesn't Go Stale in Two Weeks
It's 9 PM on a Sunday. The CEO just pinged you: "Need the updated sales org chart for the board deck by tomorrow." The last version is from Q2 - three hires ago, two departures ago, and one entire territory realignment ago. You open the old Lucidchart file and realize it's basically fiction.
91% of executives report too many conflicting priorities during reorgs, and a stale sales organizational chart is both a symptom and a cause. Let's fix that - not just the chart itself, but the thinking behind it.
What You Need (Quick Version)
Building a sales org chart that stays useful comes down to three decisions:
- Pick a model. Assembly line (SDR → AE → AM/CSM) works for most B2B sales teams. Start here unless you have a strong reason not to.
- Define roles with ratios. A 2-3:1 SDR-to-AE ratio is a common benchmark. One frontline manager per 6-8 reps keeps spans of control manageable.
- Choose your tools. Lucidchart for building the visual chart. A data enrichment platform for populating prospect org charts with verified emails and direct dials.
That's the skeleton. The rest of this guide fills in the muscle and connective tissue.
What a Sales Org Chart Should Include
Most org charts are just boxes with names and titles. That's a directory, not a strategic document. A useful chart includes context that helps people make decisions.
A complete chart covers reporting lines showing who reports to whom, including dotted-line relationships for matrix structures. It maps territory or segment ownership so everyone knows which rep owns which accounts. And it includes contact data - direct dials and emails for every person, especially on prospect org charts.
But the most overlooked element is context beyond titles. Enterprise reps on Reddit put it perfectly: they don't just need titles - they need to know what their exec buyers "do and control." A VP of Engineering at one company might own procurement decisions; at another, that same title has zero budget authority. Your chart should capture this.
Sales Org Chart Models
There are taxonomies floating around with 11 different sales org structures. That's academically interesting and practically useless. You need three.
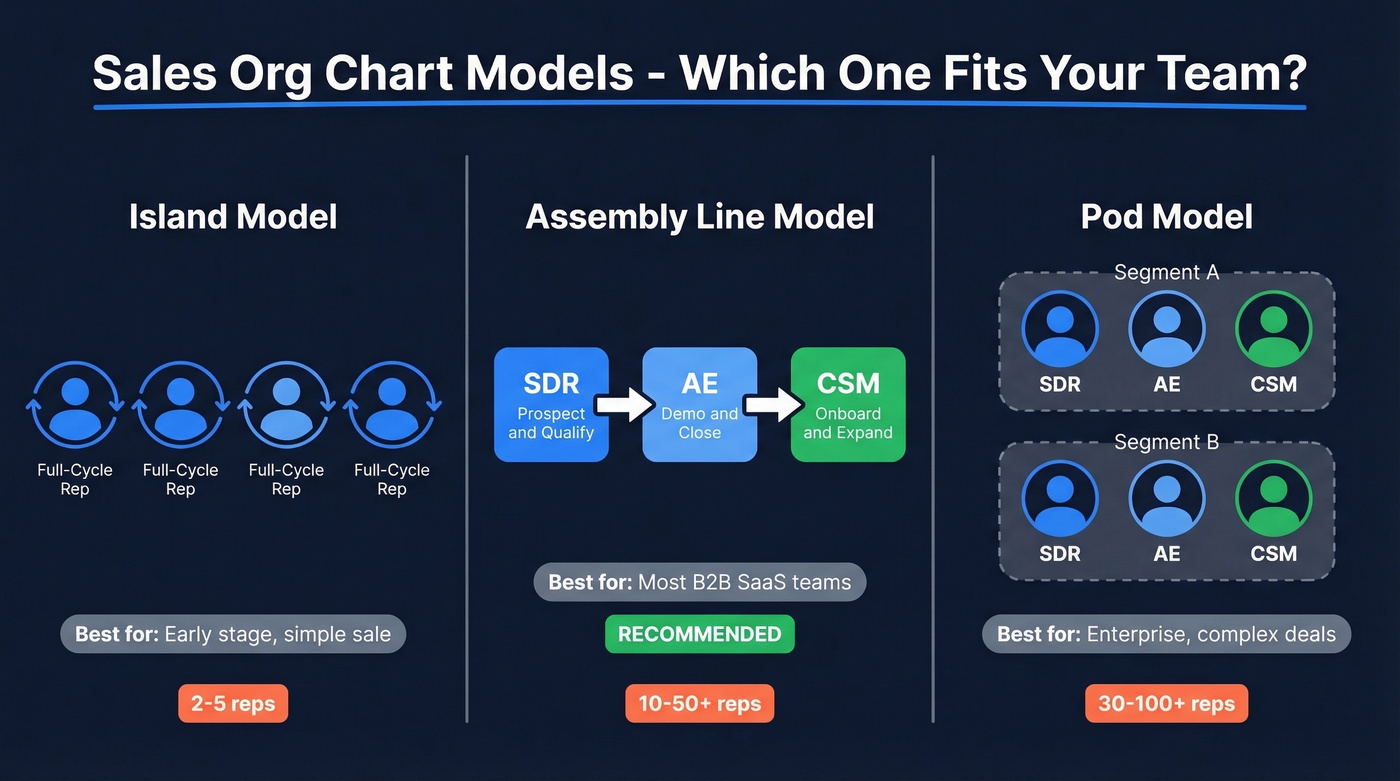
| Model | How It Works | Best For |
|---|---|---|
| Island | Each rep runs full cycle | Early-stage, simple sale |
| Assembly Line | Specialized roles (SDR → AE → CSM) | Most B2B SaaS teams |
| Pod | Cross-functional mini-teams | Enterprise, complex deals |
Island is the default when you have two reps and no process. Everyone does everything. It works until it doesn't, which is usually around rep number five.
Assembly line is what Close calls the specialization model, and it's the right starting point for most teams. Clear handoffs, measurable conversion between stages, and the ability to hire specialists instead of unicorns. We've recommended this structure to dozens of teams and it consistently delivers the fastest path to repeatable pipeline. Start here.
Pod groups an SDR, AE, and CSM - sometimes a solutions engineer - into a self-contained unit focused on a segment or set of accounts. Powerful for enterprise B2B sales but harder to manage at scale.
Two variants worth knowing: hunter-farmer splits new business from account expansion, which makes sense once your install base generates meaningful upsell revenue. Matrix structures add dual reporting lines, useful in global orgs, painful everywhere else.
Here's the thing: geographic structures are dying. In a remote-first world, organizing your sales team by region makes less sense than organizing by segment, deal size, or vertical. If your team structure still has "West Coast Team" and "East Coast Team" as primary divisions, you're organizing around a constraint that no longer exists.
One more shift for 2026: AI-assisted SDR tools are changing the math on ratios. When AI handles initial outreach sequencing and lead scoring, a single SDR can feed more AEs - which means your chart might need fewer SDR boxes than it did two years ago.
Role-by-Role Breakdown
A real sales organization chart in 2026 includes ops, enablement, and customer success - because revenue doesn't stop at the closed-won line.
The Sales Hierarchy
The standard progression runs SDR/BDR → AE → AM/CSM → Sales Manager → Director of Sales → VP of Sales → CRO. Not every company has every level, but the reporting chain follows this logic.
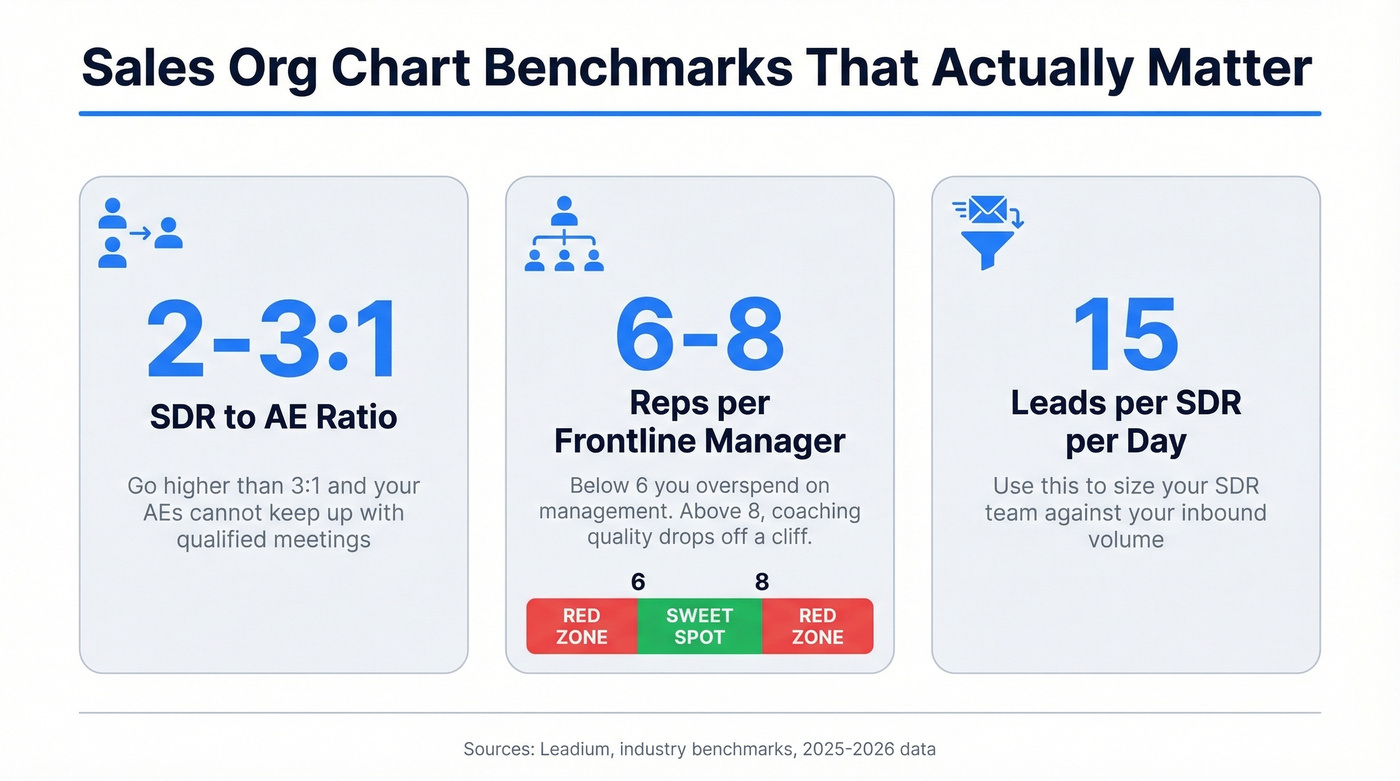
The benchmarks that matter:
- SDR:AE ratio - 2-3:1 is the sweet spot. Go higher than 3:1 and your AEs can't keep up with qualified meetings.
- Manager span of control - 6-8 reps per frontline manager. Below six, you're overspending on management. Above eight, coaching quality drops off a cliff.
- SDR capacity - the average SDR handles roughly 15 leads per day. Use this when sizing the team against inbound volume.
Where Ops and Enablement Sit
Sales Ops owns process, CRM configuration, metrics, and reporting - the tactical right hand of the sales team. Sales Enablement owns training, content, coaching, and preparation for customer-facing interactions. They're complementary but distinct.
A centralized ops model works well under ~200 reps. Beyond that, you'll likely need a hybrid with central governance and embedded specialists in each segment.
The CRO Revenue Org
The modern default at growth-stage companies is a CRO who owns marketing, sales, and customer success under one umbrella. Customer success can drive up to 50% of total growth, which is why many teams keep it under the same executive as sales. When marketing reports to a CMO and sales reports to a VP Sales and CS reports to a VP CS, nobody owns the full customer journey.
If your org chart doesn't include ops and enablement, it's incomplete. Full stop.
A sales org chart without contact data is just a diagram. Prospeo gives you verified emails and direct dials for every person on your prospect's org chart - 300M+ profiles, 98% email accuracy, 125M+ verified mobiles.
Map the org chart. Reach every decision-maker. Start free.
Org Charts by Company Stage
Startup (5-10 People)
The founder is still closing deals. You've got 2-3 AEs, maybe 1 SDR, and nobody dedicated to ops. The team structure fits on a napkin, and a napkin is fine. Don't over-engineer it.
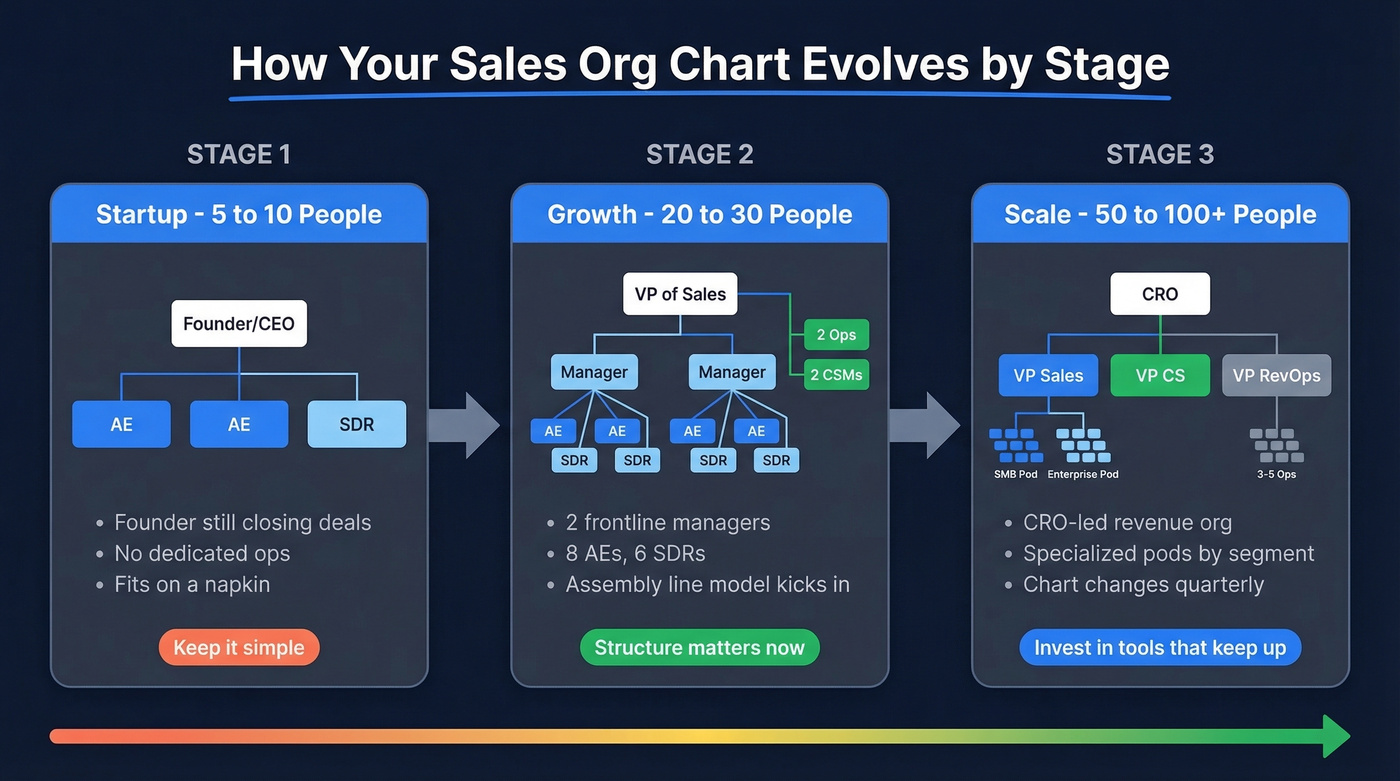
Growth (20-30 People)
Now you need structure. A typical growth-stage setup: VP of Sales, 2 frontline managers, 8 AEs, 6 SDRs, 2 ops/enablement hires, and 2 CSMs. We've seen the assembly line model really earn its keep at this stage - clear handoffs, measurable stage conversion, and enough people that you can't just "figure it out" anymore.
Scale (50-100+ People)
You're running a CRO-led revenue org with multiple VPs, specialized pods by segment or vertical, a dedicated RevOps team of 3-5 people, and an enablement function with its own manager. The organizational chart changes quarterly, which is exactly why you need tools that keep up.
Using Org Charts for Account Mapping
There's a second use case for a sales org chart that's just as important as structuring your own team: mapping your prospect's organization.
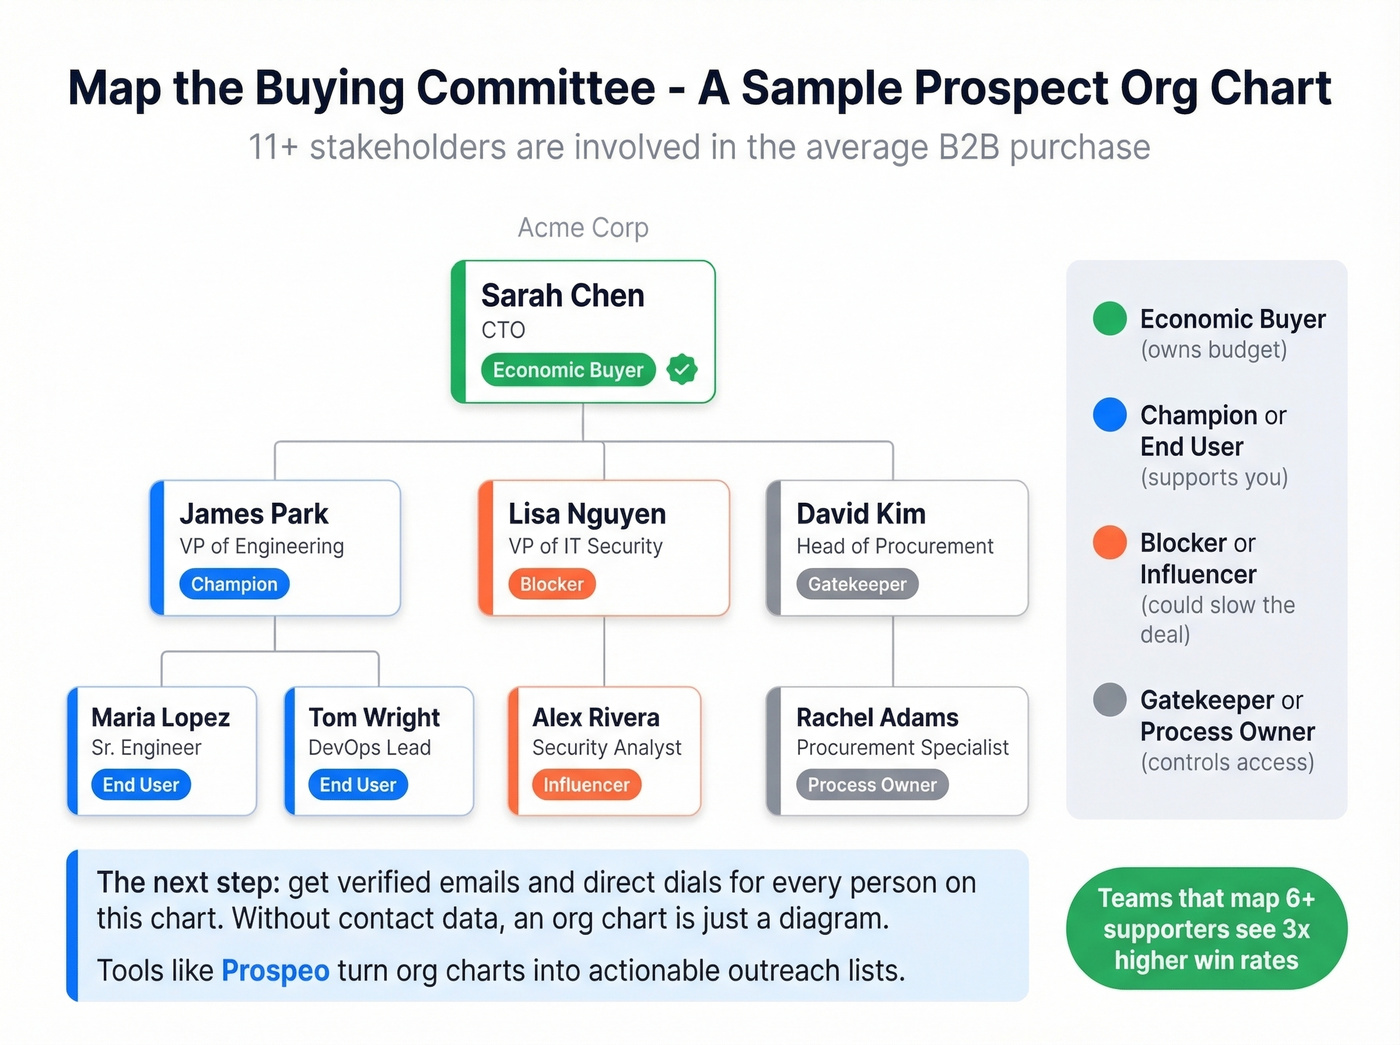
The average B2B purchase now involves 11+ stakeholders. When sales teams map at least six supporters inside a target account, win rates can triple. If your baseline close rate is 15%, tripling it changes the math on every deal in your pipeline.
The problem is the "now what?" moment. You've mapped the VP of Engineering, the procurement lead, the IT security reviewer, and three end-user champions. Now you need verified emails and direct dials for every single one of them. This is where Prospeo's database fits - search by job title, department, company size, or technographics across 300M+ professional profiles, then pull verified contact data for every stakeholder on the chart. Emails come back at 98% accuracy, refreshed on a 7-day cycle, so your stakeholder maps don't decay the moment you build them.

Knowing who reports to whom is step one. Reaching them is step two. Prospeo's Chrome extension lets you pull verified emails and phone numbers for every stakeholder on a prospect org chart - 50+ data points per contact, refreshed every 7 days.
Stop charting names you can't contact. Get the data that connects.
How to Build Your Chart
Five steps. None of them are "open PowerPoint."
Design by role first, assign people second. Start with the roles your sales process requires - SDR, AE, CSM, Manager, Ops - then slot people in. This forces you to think about headcount planning rather than just documenting what already exists.
Choose your data source. Your CRM, HRIS, or even a clean spreadsheet with fields for title, manager, name, and contact info. The key is a single source of truth that feeds the chart.
Pick a tool. Lucidchart for most teams, Miro if you're already living in it for collaboration. More on tools below.
Add context beyond titles. Territory ownership, segment responsibility, quota tier, dotted-line relationships. A chart with just names and titles is a phone directory, not a strategic asset.
Set an update cadence. Monthly minimum. Better yet, connect your chart tool to your HRIS or CRM so it updates automatically. The moment it goes stale, nobody trusts it.
Best Tools for Sales Org Charts
For most teams, the answer is straightforward: Lucidchart for the visual chart, a data platform for the contact layer. Here's the full picture.
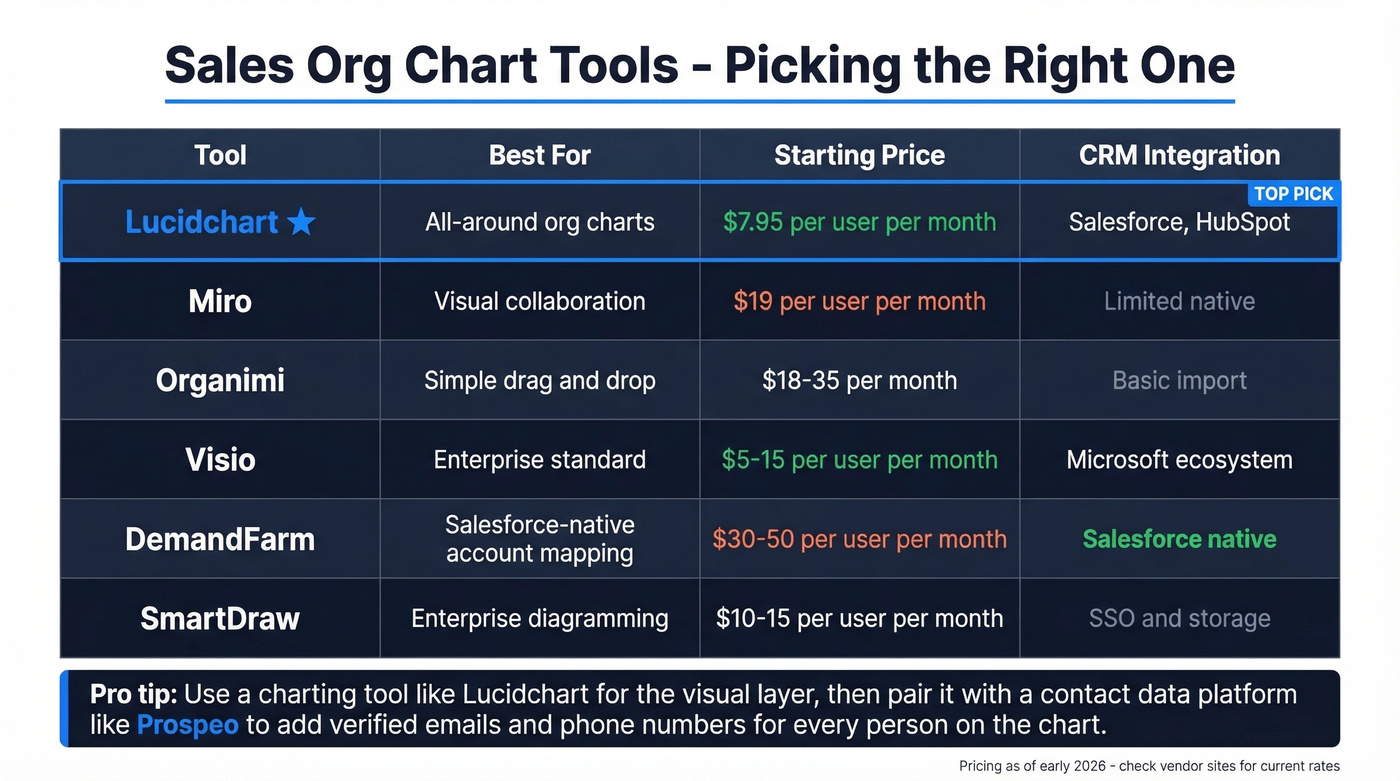
| Tool | Best For | Free Tier | Paid Pricing | CRM Integration |
|---|---|---|---|---|
| Lucidchart | All-around charts | Yes | From $7.95/user/mo | Salesforce, HubSpot |
| Miro | Visual collaboration | Yes | $19/user/mo | Limited native |
| Organimi | Simple drag-and-drop | Yes (1 chart) | $18-35/mo | Basic import |
| Visio | Enterprise standard | No | $5-15/user/mo | Microsoft ecosystem |
| DemandFarm | Salesforce-native mapping | No | ~$30-50/user/mo | Salesforce native |
| SmartDraw | Enterprise diagramming | No | ~$10-15/user/mo | SSO, storage |
Lucidchart is our default recommendation. It supports spreadsheet and HRIS imports, has 100+ integrations including Salesforce and BambooHR, and the templates are genuinely good. If you only pick one tool, pick this.
Enterprise reps on r/sales consistently mention Miro for complex stakeholder maps, but the tradeoff is real: everything is manual. Copy, paste, reformat, repeat. When you're mapping 50+ stakeholders across multiple accounts, that gets old fast.
Skip Organimi unless you're a small team that just needs a clean, shareable chart without the overhead of Lucidchart. Visio is for companies already deep in the Microsoft ecosystem - reliable, not exciting. DemandFarm is the pick for Salesforce shops doing enterprise deals, with relationship mapping and influence scoring built in. SmartDraw rounds out the enterprise options with SSO and storage integrations that make IT teams happy.
Mistakes That Kill a Sales Reorg
Reorganizing your sales team is inevitable. Doing it badly is optional. Growthspace identified four pitfalls that apply directly:
The "magic key" illusion - believing that moving boxes on a chart will fix performance problems. In our experience, teams waste months redesigning org structures when the real problem is stale data, weak coaching, or misaligned comp plans.
Exhaustion after planning - leadership spends months designing the new org, then has no energy left for the actual transition. Reps get a new chart and zero support.
Rose-colored glasses - assuming everyone will naturally adapt to new roles, territories, and reporting lines. They won't.
The calendar trap - artificial deadlines ("we need this done by Q2") that force rushed decisions and incomplete rollouts.
Here's a diagnostic worth remembering: if more than a third of your team is missing quota on your top three metrics, it's a structure problem, not a people problem. But if only a few reps are struggling, rearranging boxes won't help - invest in coaching instead.
Let's be honest about something: stop obsessing over the perfect structure. The chart matters less than the data in it and the cadence at which you update it. A "good enough" sales org chart that's current beats a beautifully designed one that's three months stale every single time.
FAQ
What is a sales org chart?
A visual representation of your sales team's structure - reporting lines, roles, hierarchy, territory ownership, and ideally contact data for every person. It goes beyond a simple directory by adding context like segment responsibility and quota tiers.
How often should you update it?
Monthly at minimum. Connect your chart tool to your CRM or HRIS for automatic updates. Any chart that isn't treated as a living document will be outdated within weeks, and nobody will trust it.
What's the best structure for a startup?
Assembly line with the founder as primary closer. Keep it flat - 2-3 AEs, 1 SDR, no dedicated ops - until you hit 10+ reps, then hire your first frontline manager.
How do you populate a prospect org chart with contact data?
Use a B2B data platform to search by job title, department, and company. Pull verified emails and direct dials for every stakeholder, then layer that data onto your visual map so reps can actually reach the people they've identified.
What's the difference between Sales Ops and Enablement?
Sales Ops owns process, CRM configuration, metrics, and reporting. Enablement owns training, content, and coaching. Both belong on your org chart, but they serve distinct functions and typically report to different leaders.