Sales Performance Metrics: What to Track, What "Good" Looks Like, and What Most Guides Get Wrong
It's Monday morning. Your VP of Sales pulls up the dashboard, stares at 47 metrics across 6 tabs, and asks the same question as last week: "So... are we on track?" Nobody answers confidently.
That silence is expensive. McKinsey's research shows companies that nail sales analytics see 5-10% revenue growth with the same or improved margins. Most teams never get there - not because they lack data, but because they're drowning in it. We've watched teams spend entire QBRs debating what a metric means instead of deciding what to do about it, and it's one of the most frustrating patterns in B2B sales.
Why Most Sales Dashboards Fail
Sales reps spend roughly 60% of their time on non-selling tasks - admin, CRM updates, searching for contacts, sitting in internal meetings. The dashboard was supposed to fix this: give everyone visibility, reduce guesswork, drive accountability. Instead, most dashboards become digital wallpaper.
Teams bolt on every metric their CRM offers, build 30-field views, and then wonder why nobody looks at them. The average B2B deal now involves 13 decision-makers and 80% of buyer interactions happen digitally. That complexity demands focus, not more data points.
In a recent r/sales thread, an enterprise rep asked for evidence-based guidance on which outreach activities actually move the needle. That uncertainty isn't a strategy problem - it's a metrics problem. When you can't connect activity to outcomes, everything feels like guesswork.
Here's the thing: a dashboard with 30 metrics is a dashboard with zero metrics. If a rep can't glance at it and know exactly what to do next, you've built a reporting artifact, not a performance tool.
What You Need (Quick Version)
Before you read another word, here are the five KPIs every sales team should track before adding anything else:
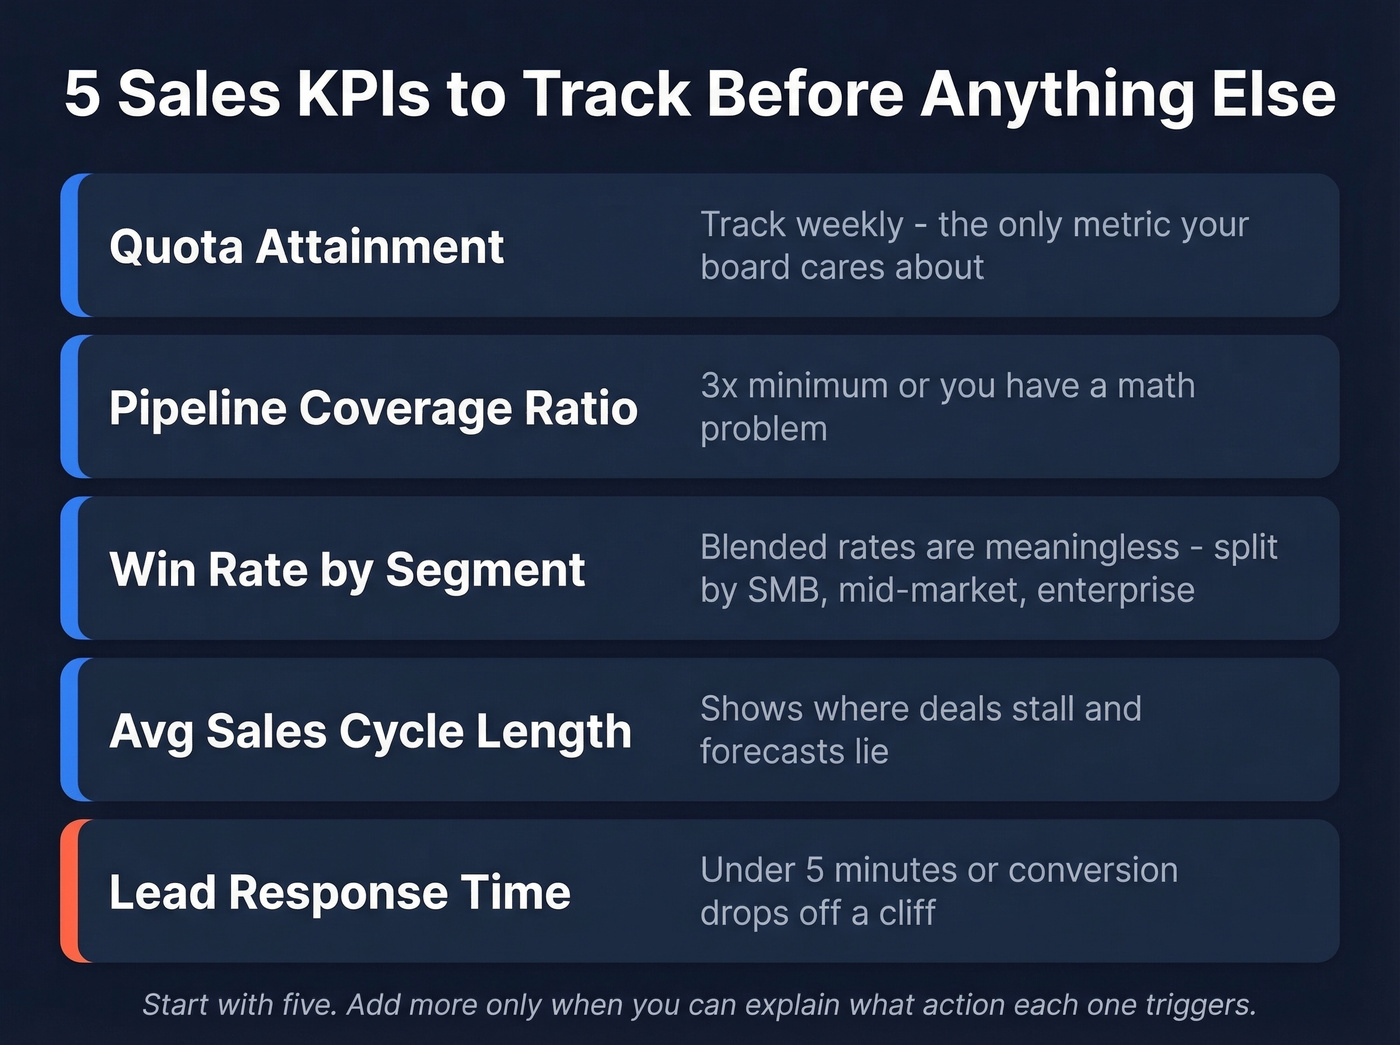
- Quota attainment - the only metric your board actually cares about. If you're not measuring this weekly, you're flying blind.
- Pipeline coverage ratio - 3x minimum. Below that, you don't have a pipeline problem, you have a math problem.
- Win rate by segment - blended win rates are meaningless. SMB and enterprise close at very different rates.
- Average sales cycle length - this tells you when deals are stalling and where your forecast is lying to you.
- Lead response time - the single highest-leverage activity metric. Minutes matter. Hours kill deals.
Start with five. Add more only when you can explain what action each one triggers.
KPIs vs. Metrics - Why the Difference Matters
Every KPI is a metric, but not every metric is a KPI. The distinction determines what shows up on your Monday morning dashboard versus what lives in a quarterly deep-dive.
Metrics are any measurable data point: emails sent, calls logged, proposals viewed. KPIs are the 3-5 numbers directly tied to your team's revenue targets - the ones you review in every pipeline meeting and hold people accountable to. Pipeline coverage is a KPI. Number of posts by your SDRs is a metric (and probably a vanity one).
The more useful framework is leading vs. lagging. Revenue is lagging - by the time you see it, the work happened months ago. Pipeline generation is leading - it tells you what revenue will look like 60-90 days from now. Altus Alliance recommends tracking at least 8 leading indicators, from calls made to close ratio, because it takes an average of 8 touches before a meaningful connection with a prospect. The teams that get forecasting right obsess over leading indicators rather than celebrating (or panicking about) lagging ones.
15 Indicators That Predict Revenue
Five categories. Each metric gets a definition, a benchmark, and what to do when the number goes sideways.
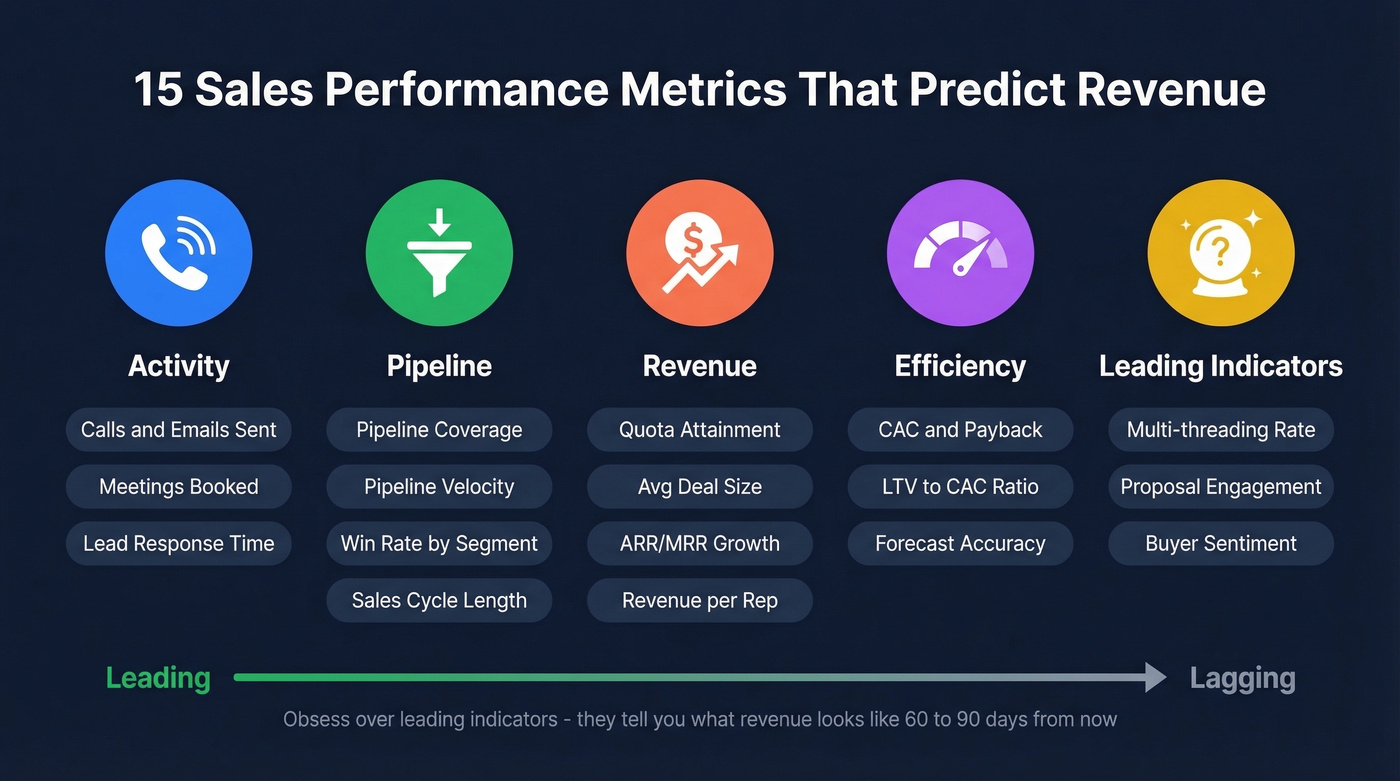
Activity Metrics
Calls made and emails sent aren't glamorous, but they're the foundation. Reps spend about 2 hours per day actually selling. If your activity numbers are low, the problem usually isn't motivation - it's that your reps are buried in non-selling work.
Meetings booked is where activity converts to pipeline. Track this as a ratio against outbound touches. A rep sending 200 emails and booking 2 meetings has a messaging or targeting problem, not a volume problem.
Lead response time is the metric most teams track but few optimize. You need to respond to a lead in five minutes or less; after that, the chance of conversion drops off a cliff. Many teams still respond in hours. This is the single easiest metric to improve with process changes alone - no new tools, no new hires, just faster follow-up.
If you want a clean way to define what “good” looks like for each stage, start with funnel metrics and work backward from revenue.
Pipeline Metrics
This is where revenue gets built or lost. With 13 decision-makers involved in the average B2B deal, pipeline metrics tell you whether you'll hit your number before the quarter ends - or whether you're fooling yourself.
Pipeline coverage should sit at 3x minimum - $3 in qualified pipeline for every $1 of quota. Some enterprise teams target 4-5x because their win rates are lower. Below 3x at the start of a quarter, no amount of late-stage heroics will save you.
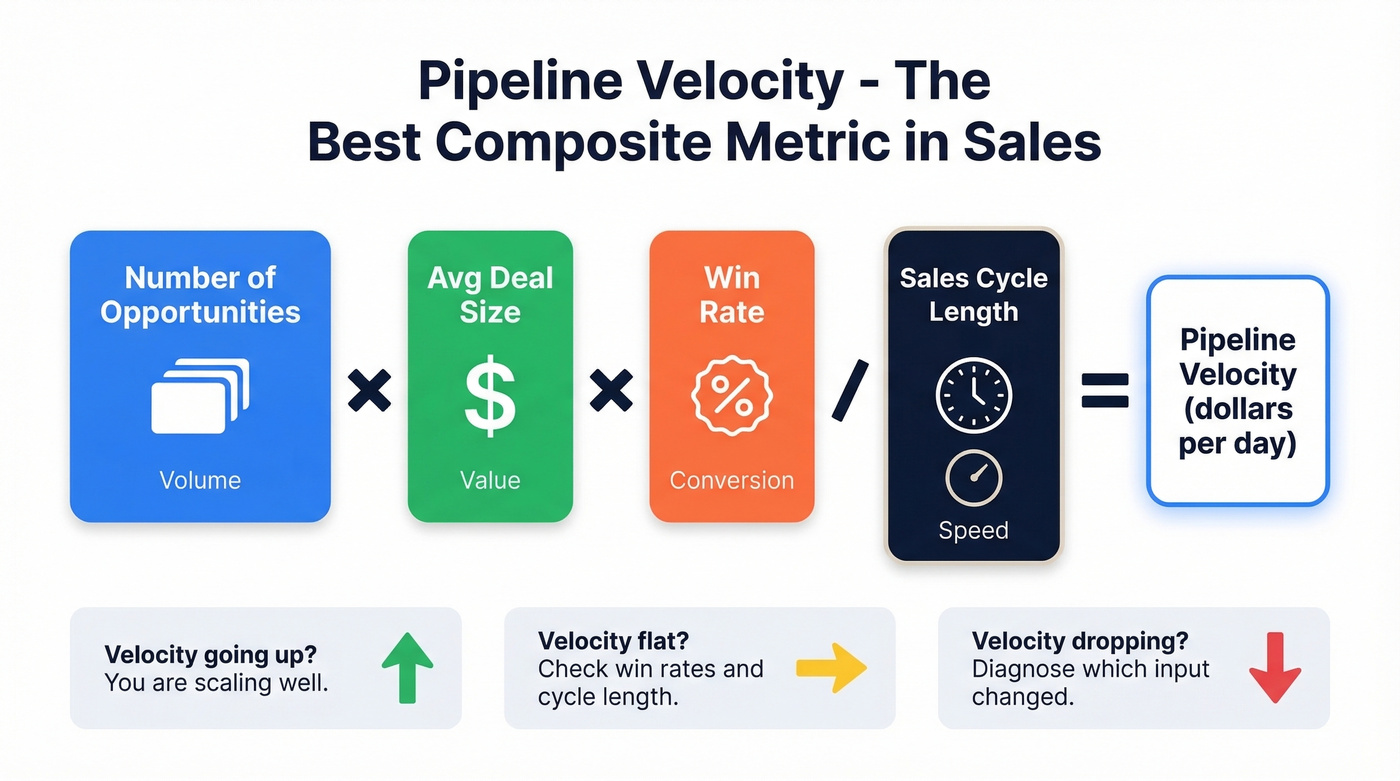
Pipeline velocity measures how fast deals move through your funnel: (number of opportunities x average deal size x win rate) / sales cycle length. It's one of the best composite metrics because it captures volume, value, conversion, and speed in a single number.
Win rate needs segmentation or it's useless. A blended 25% tells you nothing when SMB closes at a much higher rate and enterprise closes at a much lower one. Mid-market typically falls in the 20-30% range. Track these separately, and suddenly you can see which segments need intervention.
Sales cycle length varies dramatically by segment. Many enterprise deals take 1-2 quarters to close. SMB and mid-market are typically much faster. Watch the trend, not the absolute number - if cycles are lengthening (and 57% of sales professionals say they are), you need to understand why before it tanks your forecast.
If you’re pressure-testing whether your pipeline is “real,” use a simple pipeline health checklist before you start tweaking rep activity.
Here are the stage-by-stage conversion benchmarks most B2B funnels follow:
| Funnel Stage | Conversion Rate |
|---|---|
| Lead to MQL | 35-45% |
| MQL to SQL | ~15% |
| SQL to Opportunity | 25-30% |
| Opportunity to Closed-Won | 6-9% |
| Lead to Customer | 1.5-2.5% |
The MQL-to-SQL handoff is where most deals die. If your number is significantly below 15%, the problem is usually qualification criteria or marketing-sales alignment, not rep performance.
Revenue Metrics
The lagging indicators your board cares about. They confirm whether everything upstream is working.
Quota attainment is the headline number. Outreach reports 84% of reps missed quota last year. If your team is consistently missing, the issue is usually unrealistic quotas, insufficient pipeline, or a product-market fit problem that no amount of sales effort can fix.
Average deal size matters for forecasting and resource allocation. Track it by segment and watch for drift - shrinking deal sizes often mean you're moving downmarket without realizing it.
ARR/MRR growth is the north star for SaaS. Median ARR growth sits around 26%, with top performers reaching ~50%. Pair this with net revenue retention - NRR benchmarks for 2026 target 106%, with best-in-class companies hitting 120-130%.
Revenue per rep tells you whether you're scaling efficiently or just adding headcount. Combine it with LTV:CAC (target 4:1 minimum) and the magic number (target >1.0) for a full picture of unit economics.
If you need a tighter definition of what “good” looks like for conversion, benchmarks, and fixes, see sales conversion rate.
Efficiency Metrics
These tell you whether you're growing profitably or just burning cash faster.
Customer acquisition cost (CAC) is total sales and marketing spend divided by new customers acquired. CAC payback - months of revenue needed to recoup acquisition cost - should land at 12-15 months for a healthy SaaS business. Above 18 months and you're financing growth with future revenue you haven't earned yet.
LTV:CAC ratio at 4:1 means every dollar of acquisition cost generates four dollars of lifetime value. Below 3:1 and your unit economics don't work. Above 6:1 and you're probably underinvesting in growth.
Forecast accuracy is the efficiency metric nobody wants to talk about. Track it as the percentage variance between your committed forecast and actual closed revenue. If you're consistently off by more than 15%, your pipeline stages need recalibration and every downstream decision - hiring, spend, capacity planning - is built on fiction.
If you’re rebuilding your forecasting process, start with a dedicated stack review of sales forecasting solutions.
Leading Indicators Most Teams Miss
These separate teams who react from teams who predict.
Multi-threading rate measures how many stakeholders you're engaged with per deal. The benchmark is 3+ contacts per opportunity. Single-threaded deals are a forecasting risk - if your one champion leaves or gets reassigned, you're starting over.
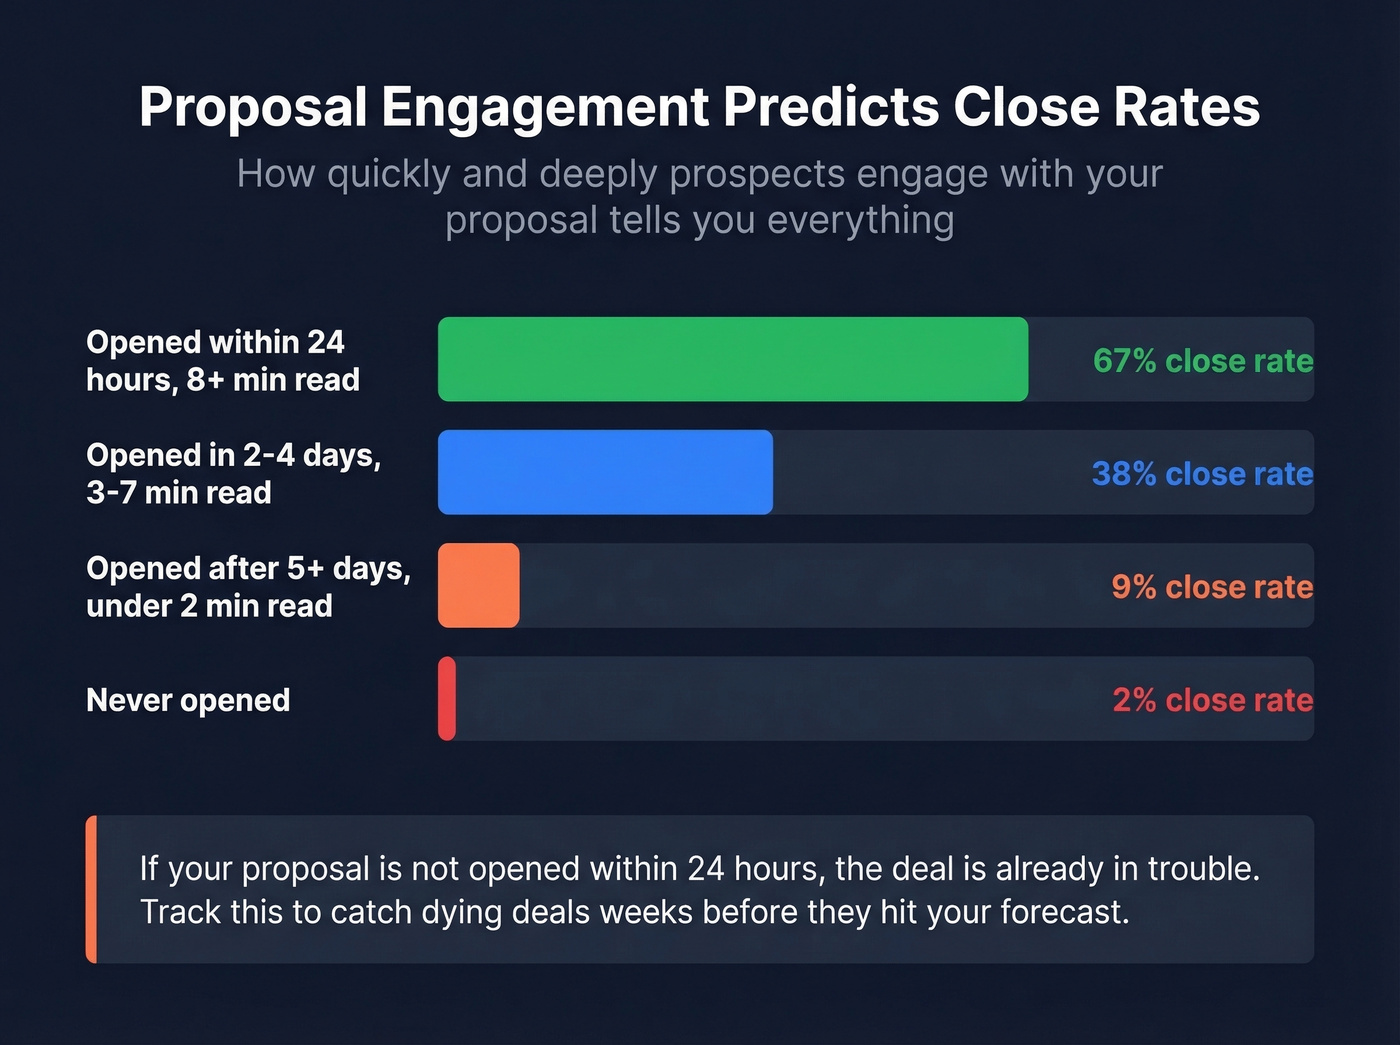
Proposal engagement score is one of the most underused predictive metrics we've seen:
| Engagement Pattern | Close Rate |
|---|---|
| Opened within 24hrs, 8+ min read | 67% |
| Opened 2-4 days, 3-7 min | 38% |
| Opened 5+ days, under 2 min | 9% |
| Never opened | 2% |
If your proposals aren't being opened within 24 hours, the deal is already in trouble. Track this and you'll catch dying deals weeks before they show up as a missed forecast.
Buyer sentiment and qualification rate round out the picture. Qualification rate - the percentage of leads that pass your framework - tells you whether marketing is sending the right people or just filling the top of funnel with noise. Buyer sentiment, tracked through conversation intelligence tools, reveals whether your champion is enthusiastic or just polite.
To make qualification rate actionable (instead of a vanity percentage), pair it with a real lead scoring model.
Benchmarks by Industry
Benchmarks without context are dangerous. A 7.4% conversion rate sounds incredible until you realize that's legal services, where deal values and sales motions look nothing like B2B SaaS.
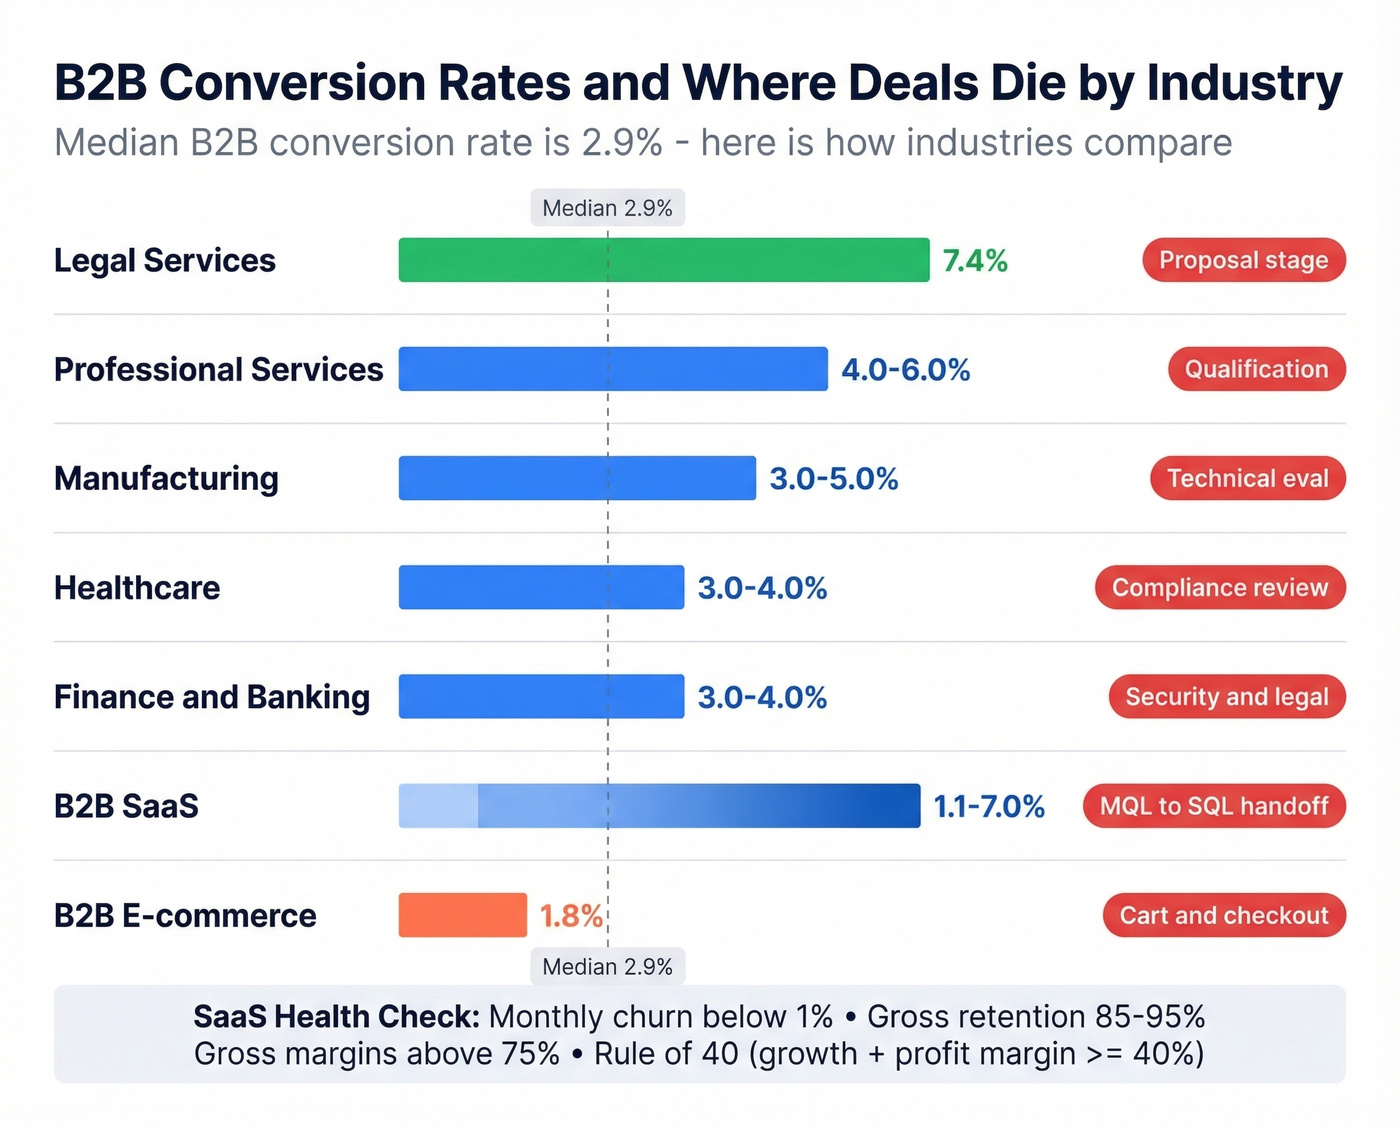
| Industry | Avg Conversion | Where Deals Die |
|---|---|---|
| Legal services | 7.4% | Proposal stage |
| Professional services | 4.0-6.0% | Qualification |
| Manufacturing | 3.0-5.0% | Technical eval |
| Healthcare | 3.0-4.0% | Compliance review |
| Finance/Banking | 3.0-4.0% | Security/legal |
| B2B SaaS | 1.1-7.0% | MQL to SQL handoff |
| B2B e-commerce | 1.8% | Cart/checkout |
The median B2B conversion rate across industries is 2.9%. If you're consistently well above that, your funnel is outperforming the market. If you're consistently below, something structural is broken.
For SaaS specifically: monthly churn below 1%, gross retention between 85-95%, gross margins above 75%, and the Rule of 40 (growth rate + profit margin >= 40%). These aren't vanity numbers - they're the metrics investors and acquirers use to value your business.
Reps spend 60% of their time on non-selling tasks - and bad contact data is a huge chunk of that. Prospeo gives your team 98% accurate emails and 125M+ verified mobiles so every activity metric actually converts to pipeline.
Fix your data and every metric downstream improves.
Building a Measurement Framework That Works
Not every metric deserves weekly attention. Here's the cadence we've seen work across dozens of teams:
| Metric Category | Frequency | Who Owns It | Action Trigger |
|---|---|---|---|
| Activity (calls, emails) | Weekly | Reps + managers | Below 80% of target |
| Pipeline (coverage, velocity) | Monthly | Managers + VPs | Coverage drops below 3x |
| Revenue (quota, deal size) | Monthly | VPs + CRO | Team attainment below 80% |
| Unit economics (CAC, LTV) | Quarterly | RevOps + finance | CAC payback exceeds 18mo |
| Forecast accuracy | Quarterly | CRO + CEO | Variance exceeds 15% |
Reps should see activity and pipeline metrics. Managers should see pipeline and revenue. Executives should see revenue and efficiency. Role-based views prevent the "47-metric dashboard" problem. Organizations using mobile CRM hit targets 65% of the time versus 22% without mobile access - so make sure your dashboards work on a phone, not just a 27-inch monitor.
For e-commerce teams, the rhythm shifts slightly: weekly traffic and social metrics, biweekly AOV and CPA reviews, monthly email open rate and cart abandonment analysis, and quarterly CLV assessments. The principle is the same - match frequency to how fast the metric can change.
If you’re formalizing ownership and cadence, it helps to map this into sales operations metrics so RevOps and sales leaders stay aligned.
Five Mistakes That Wreck Your Numbers
Tracking too many metrics at once. Limit to 3-5 KPIs per dashboard view. Every additional metric dilutes focus.
Using blended averages. A 25% blended win rate hides the fact that SMB and enterprise behave very differently. Segment everything - by deal size, segment, rep tenure, and source.
Measuring activity without outcomes. A rep making 80 calls with a 5% meeting rate outperforms a rep making 200 calls at 1%. Activity metrics only matter when paired with conversion rates.
Ignoring leading indicators. Teams that measure ROI well are 1.6x more likely to win larger budgets. But most teams only review lagging indicators and discover problems 60-90 days too late.
Building dashboards on dirty data. This one corrupts everything else, and it's the mistake nobody talks about.
The Data Quality Problem Nobody Talks About
Your SDR team makes 2,000 calls this week. The activity dashboard looks great - green across the board. But 40% of those numbers are disconnected. The 800 calls that actually connected? That's your real activity number. Every metric downstream - meetings booked, pipeline generated, conversion rates - is inflated by phantom activity against bad data.
Let's be honest: if your average deal size is above $5k and you're making decisions off a dashboard, data quality matters more than which metrics you pick. A perfect framework built on 70% accurate data will underperform a simple framework built on 98% accurate data every single time.
Sales leaders estimate 19% of company data is inaccessible, and 74% of AI-using teams are prioritizing data hygiene. That urgency makes sense - 89% of revenue organizations now use AI, up from 34% in 2023. AI amplifies whatever data you feed it, good or bad. And 73% of B2B buyers actively avoid sellers who send irrelevant outreach - outreach that starts with bad data.

This is where most metrics guides stop. They tell you what to track but ignore the foundation everything sits on. Prospeo addresses this at the source - 98% email accuracy, 125M+ verified mobile numbers, and a 7-day data refresh cycle versus the 6-week industry average. CRM enrichment returns 50+ data points per contact at an 83% match rate. When your underlying data is clean, your KPIs actually mean something.
If you’re evaluating vendors for this layer, compare options in data enrichment services.
Pipeline velocity depends on reaching the right people fast. Prospeo's 7-day data refresh means your reps aren't calling dead numbers or bouncing emails - they're booking meetings that move your win rate and quota attainment in the right direction.
Stop inflating activity numbers with outdated contacts.
Tools for Tracking Sales KPIs
You don't need a dozen tools. You need the right stack for your stage.
| Category | Tool | Starting Price | Best For |
|---|---|---|---|
| Data Quality | Prospeo | Free tier, ~$0.01/email | Verified contact data |
| CRM & Reporting | Salesforce | ~$25-$300/user/mo | Enterprise teams, 50+ reps |
| CRM & Reporting | HubSpot | Free CRM, paid from ~$15+/user/mo | SMB + mid-market |
| Revenue Intelligence | Gong | ~$100-200/user/mo | Call analytics + deal inspection |
| Forecasting | Clari | ~$30K-100K+/year | Enterprise forecasting |
For most teams under 50 reps, HubSpot's Sales Hub handles a large share of metric tracking out of the box. Salesforce gives you more customization but demands more RevOps investment. Gong and Clari layer on top for conversation intelligence and forecast accuracy. Skip Clari entirely if you're under $10M ARR - you won't get enough value to justify the spend.
If you’re building a modern outbound stack around these tools, start with a shortlist of SDR tools.
The Bottom Line
Track fewer sales performance metrics. Make sure the data underneath them is accurate. Review at the right cadence for each metric's rate of change. That's the entire framework - everything else is refinement.
FAQ
What's the difference between sales metrics and sales KPIs?
KPIs are the 3-5 metrics tied directly to revenue targets - numbers reviewed in every pipeline meeting that trigger specific actions when they move. Emails sent is a metric. Pipeline coverage ratio is a KPI. If you can't explain what you'd do differently when a number changes, it's not a KPI.
How many metrics should a sales team track?
Five for a starter dashboard, 10 for a growth-stage team, 15 max for mature organizations. If you can't explain what action each metric triggers when it goes red, cut it. More data points usually means more noise and slower decisions, not better insight.
How do I make sure my sales dashboard data is accurate?
Verify your underlying contact data first - bad emails and disconnected numbers inflate activity metrics and corrupt conversion rates across your entire funnel. A 7-day refresh cycle on your contact data keeps CRM records current; tools with stale data degrade within weeks, not months.
What does quantifying sales performance look like in practice?
It starts with choosing the right indicators for your stage, then building a measurement cadence around them. Early-stage teams track five core KPIs weekly. Mature orgs use layered dashboards with role-based views - reps see activity, managers see pipeline, executives see revenue and efficiency. The key is connecting every number to a specific action.