Sales Pipeline Stages: The 2026 Guide With Real Benchmarks, Exit Criteria, and Velocity Math
84% of sales reps miss quota. That's not a rounding error - it's a structural failure, and most of it traces back to sales pipeline stages built on gut feel instead of data. Per Deloitte and McKinsey research, companies with structured sales processes grow 17-21% faster than competitors winging it. Most pipeline guides list seven stages and stop. No conversion benchmarks. No velocity math. No guidance on when to kill a stalled deal.
This one does.
Quick Reference
If you just need the stages of a sales pipeline, here are the seven with forecasting probabilities: Prospecting (5%), Qualification (10%), Discovery (20%), Demo (40%), Proposal (60%), Negotiation (80%), Closed Won (100%). Need conversion benchmarks? Jump to the benchmarks section. Debating how many stages your team actually needs? Jump to the stage count section. One thing to internalize now: your pipeline is only as useful as the exit criteria you enforce - not the number of stages you pick.
What Is a Sales Pipeline?
A sales pipeline is your internal roadmap of the steps a deal moves through from first touch to closed revenue. It's seller-facing - it tracks what your team does, not what the buyer feels.
Don't confuse it with a forecast. A pipeline shows where deals sit right now. A forecast predicts what'll close and when. The pipeline feeds the forecast, but they're different instruments.
Pipeline vs. Funnel
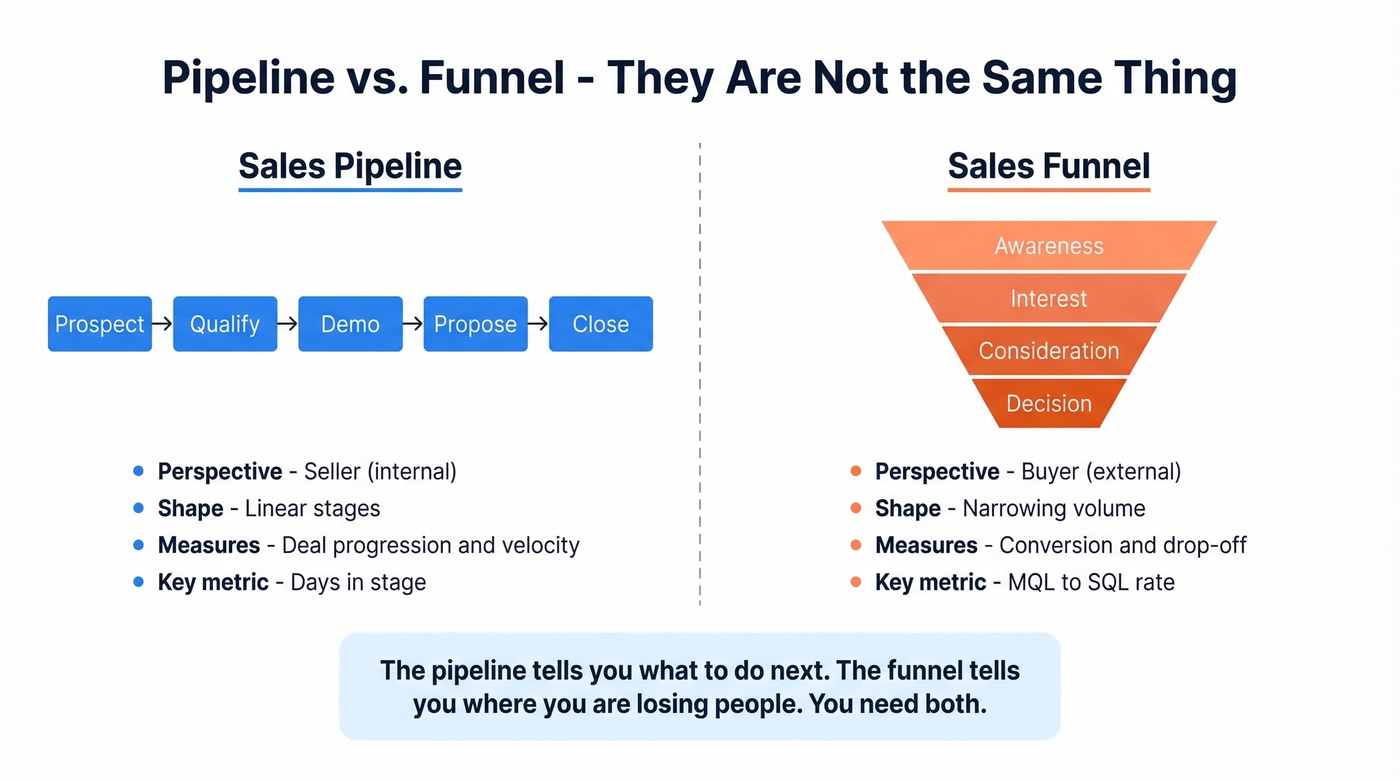
People use these interchangeably. They shouldn't. A pipeline is a seller's roadmap - it tracks actions and milestones your reps control. A funnel is a buyer's traffic report - it measures volume and attrition as prospects move through awareness, consideration, and decision.
| Dimension | Pipeline | Funnel |
|---|---|---|
| Perspective | Seller (internal) | Buyer (external) |
| Shape | Linear stages | Narrowing volume |
| Measures | Deal progression | Conversion/drop-off |
| Owner | Sales team | Marketing + Sales |
| Example metric | Days in stage | MQL-to-SQL rate |
The pipeline tells you what to do next. The funnel tells you where you're losing people. You need both, but this guide focuses on the pipeline.
The 7 Core Stages Explained
These seven stages work for most B2B teams. Your naming conventions might differ - "Discovery" vs. "Needs Analysis," "Demo" vs. "Solution Presentation" - but the underlying logic is universal. What matters isn't the labels. It's the exit criteria that gate each transition.
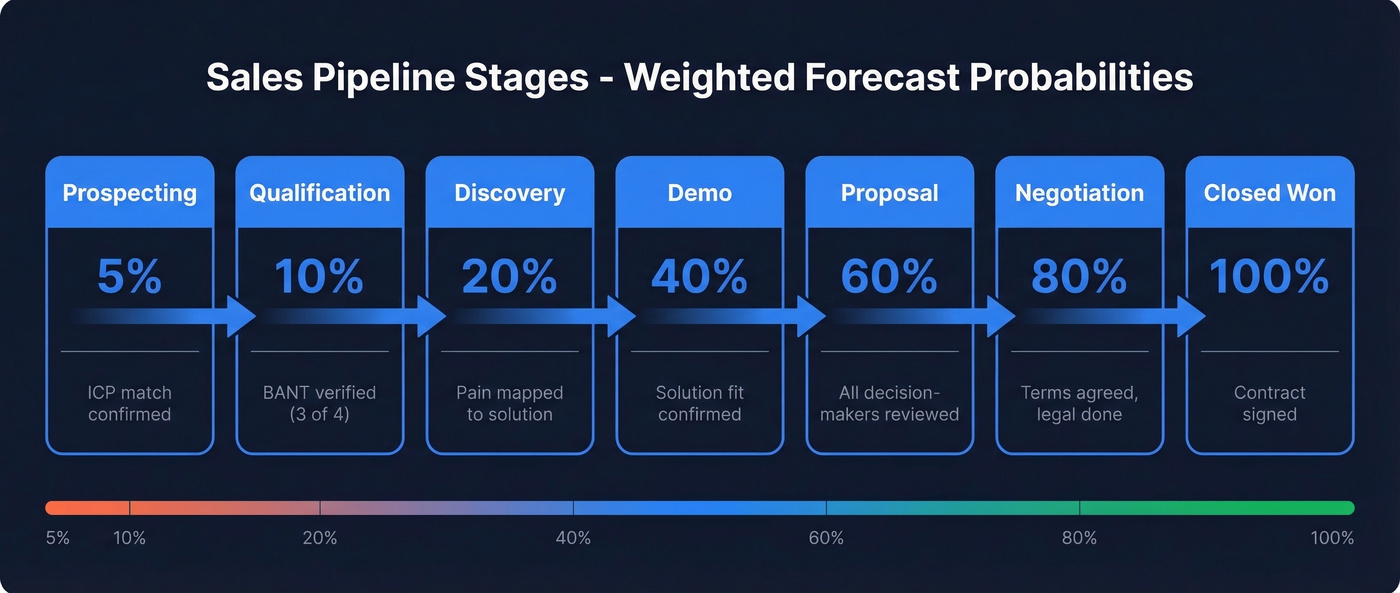
Here's the full probability table for weighted forecasting, adapted from Rework's stage-based forecasting model. Some models add a "Verbal Agreement" stage at 90% between Negotiation and Closed Won - if your deals routinely get verbal commits before ink, consider it.
| Stage | Probability |
|---|---|
| Prospecting | 5% |
| Qualification | 10% |
| Discovery / Needs Analysis | 20% |
| Demo/Presentation | 40% |
| Proposal | 60% |
| Negotiation | 80% |
| Closed Won | 100% |
Prospecting (5%)
This is where leads enter your pipeline. Reps identify potential buyers through outbound research, inbound responses, or referrals. Everything downstream depends on the quality of what enters here - contacting leads within 24 hours increases conversion by 5x, but speed without accuracy is just fast failure. A realistic lead-to-qualification conversion for outbound is often around 20-40% when targeting is tight.
Exit criteria:
- Lead matches ICP criteria (industry, company size, title)
- Valid contact information confirmed (email verified, phone tested)
- Prospect replies to outreach or accepts a meeting
- Lead assigned to a rep with a next step scheduled
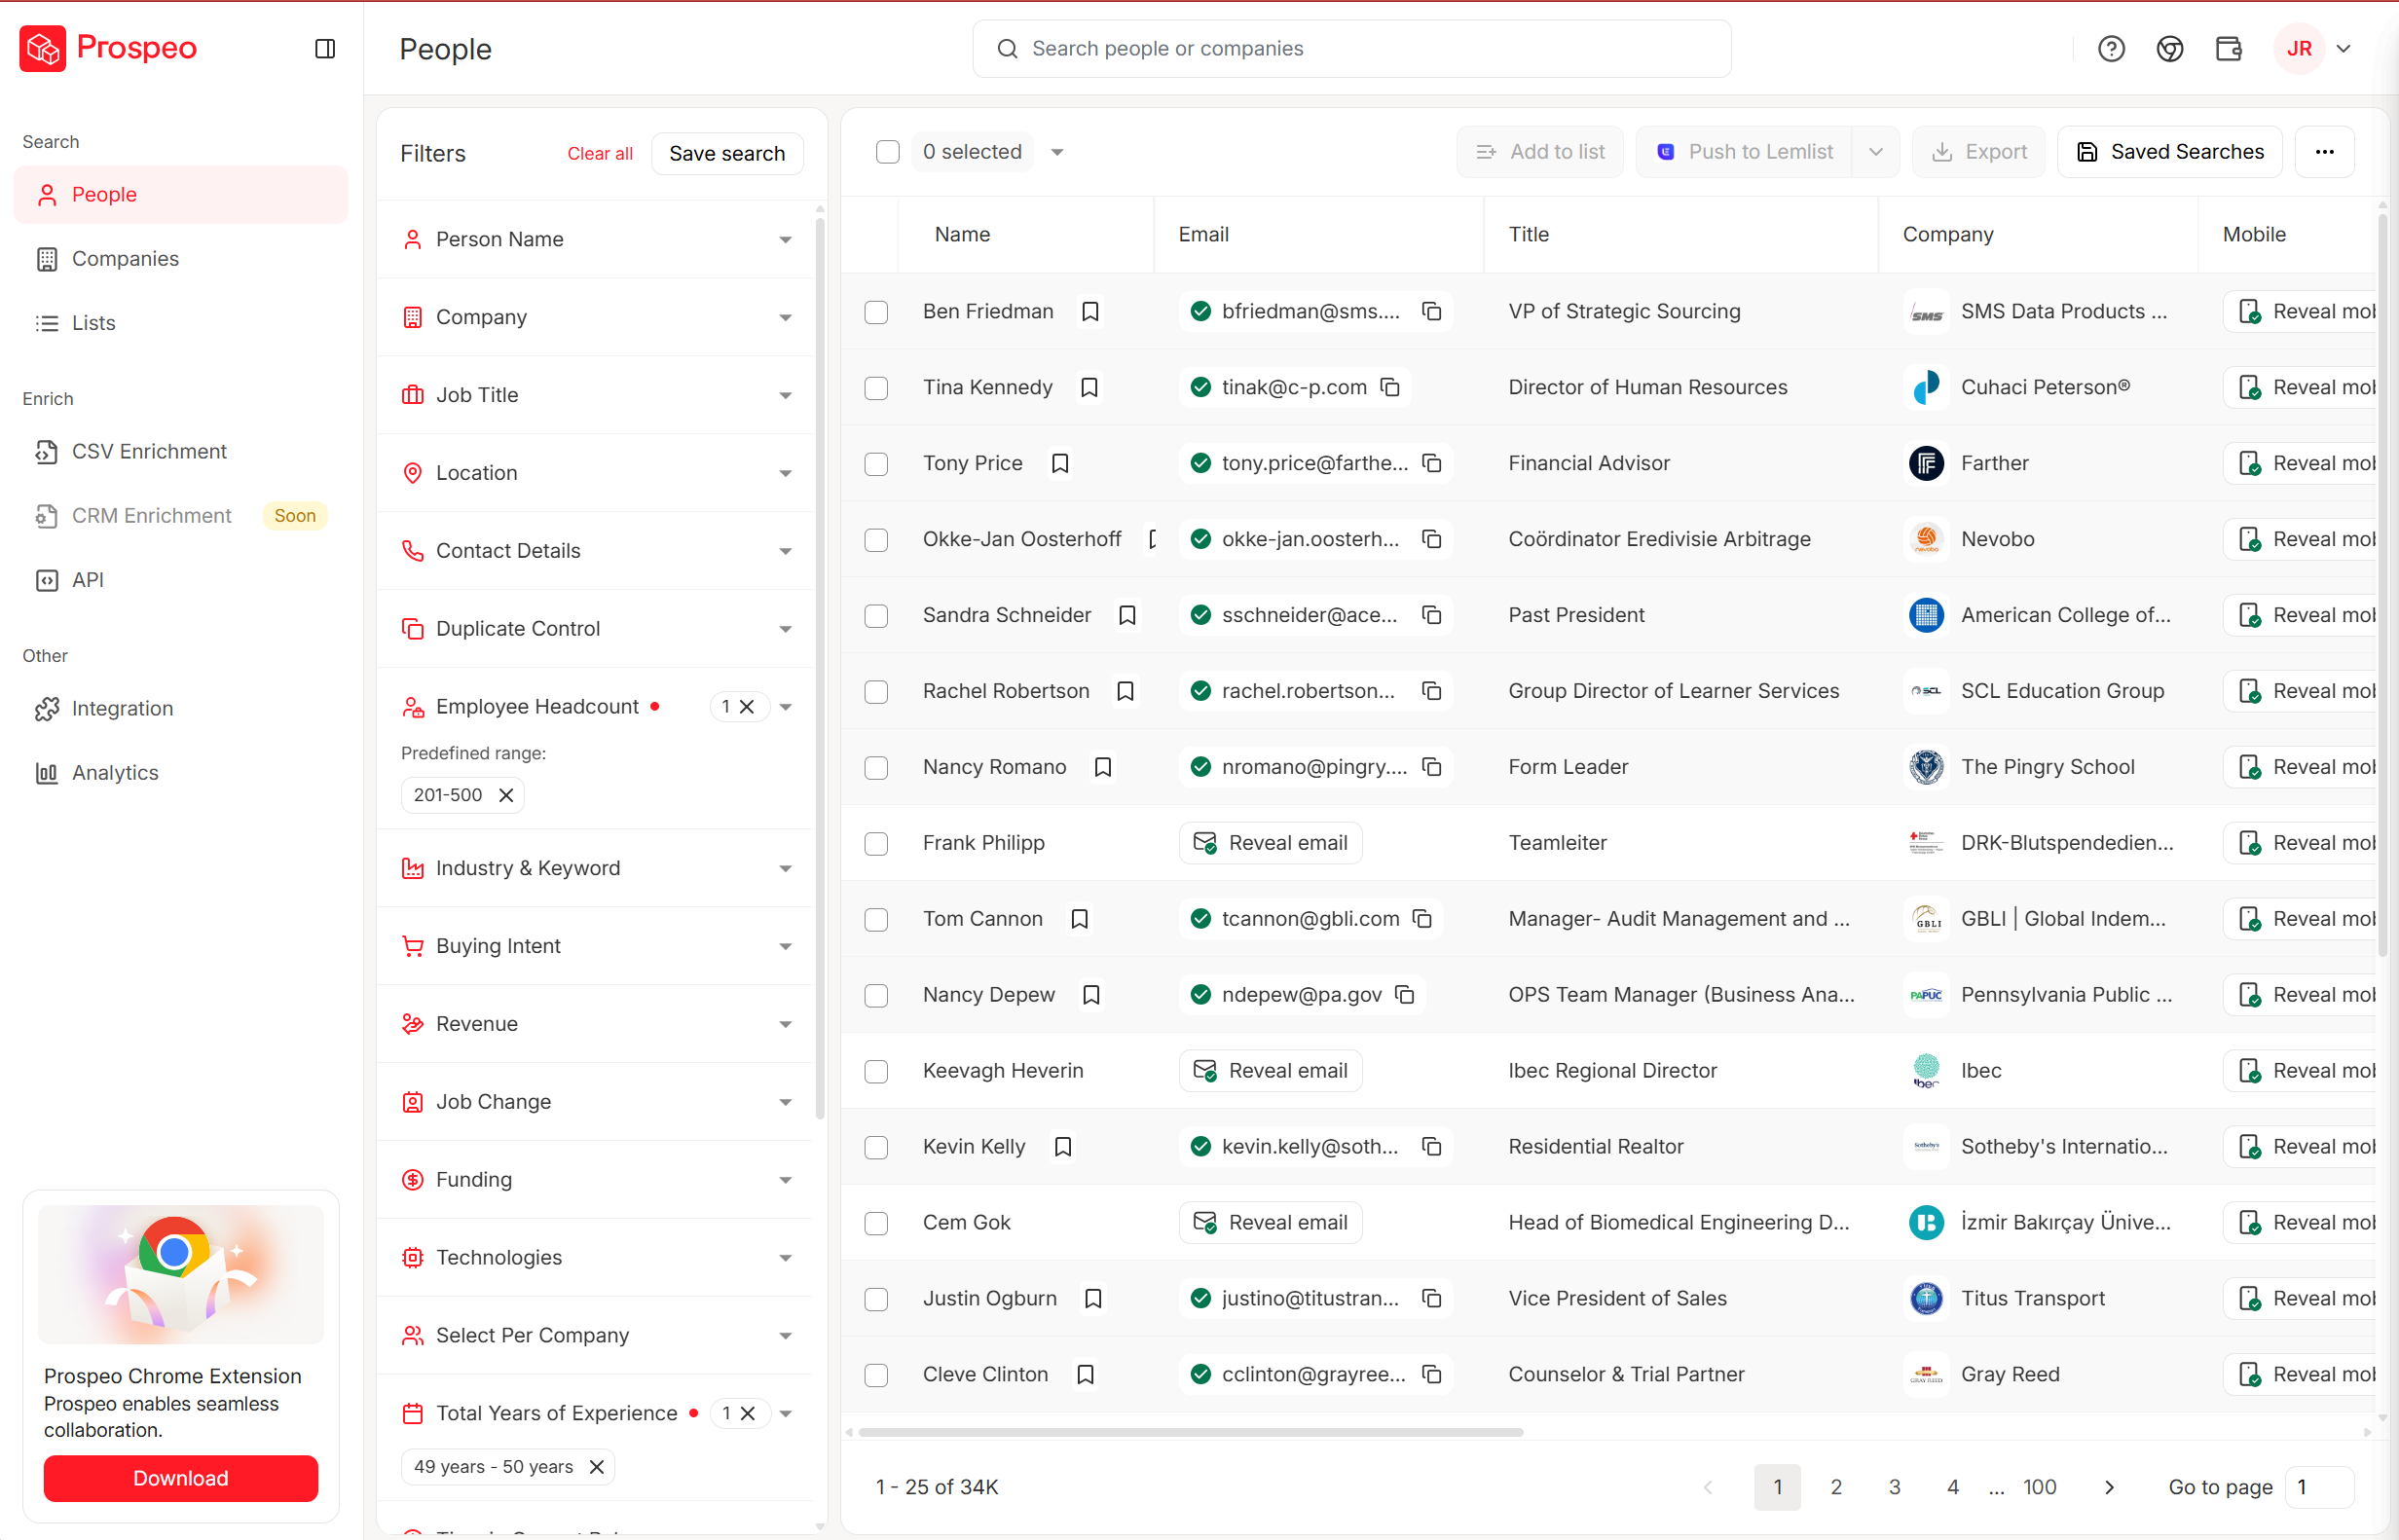
Here's the thing: your pipeline starts with the data entering it. If 30% of your contact data is stale before reps even pick up the phone, every metric from here forward is fiction. We've seen this firsthand - teams running Prospeo's 300M+ profiles with 98% email accuracy and a 7-day refresh cycle cut bounce rates from 35-40% to under 5% and added 200+ new opportunities per month.
Qualification (10%)
The rep determines whether this prospect has the budget, authority, need, and timeline to buy. This is where BANT, MEDDIC, or PQL earns its keep. The goal isn't to advance every lead - it's to kill the ones that won't close before they waste pipeline space. Qualification-to-close rates typically land at 15-25% in SaaS, so most of what enters here should die.
If you can't check at least three of these four, the deal doesn't advance:
| Criterion | What "confirmed" looks like |
|---|---|
| Budget | Prospect names a range, references a line item, or confirms they've bought similar tools |
| Authority | You're talking to the decision-maker, or your champion can name them and get you a meeting |
| Need | Prospect describes a specific pain, not a vague "we're exploring options" |
| Timeline | There's an event, renewal date, or initiative driving urgency within 6 months |
Explicit disqualification conditions matter just as much: wrong ICP, no real need, incumbent locked in, or "RFP filler" where you're column fodder. Build those into your CRM as disqualification reasons so you can track why deals die, not just that they did.
Discovery / Needs Analysis (20%)
The rep digs into the prospect's pain, current workflow, and success criteria. This isn't a product pitch - it's an interview. The best discovery calls surface problems the prospect didn't know they had. Discovery-to-demo conversion runs 50-70% when qualification upstream is tight.
Exit criteria:
- Needs documented and mapped to your solution
- Stakeholders and their priorities identified
- Competitive landscape understood (who else they're evaluating)
- Prospect agrees to a demo or deeper technical conversation
If you want a tighter structure for this stage, use a consistent set of discovery questions so reps don’t improvise the fundamentals.
Demo / Presentation (40%)
Generic demos kill deals. Let's be honest - we've all sat through the 45-minute feature tour that has nothing to do with the problem we described on the last call. The difference between a demo that advances and one that stalls is simple.
Good demo: Opens with the prospect's specific pain point. Shows the exact workflow that solves it. Ends with a mutual action plan and a date for the next step.
Bad demo: Opens with your company's founding story. Walks through every feature alphabetically. Ends with "so, any questions?" and a vague promise to "circle back."
Demo-to-close rates run 20-30% in many SaaS orgs. If yours is below 15%, your discovery stage is broken - reps are demoing prospects who aren't qualified. Exit this stage when the prospect confirms solution fit, technical objections are addressed, the decision-making process and timeline are reconfirmed, and the prospect expresses intent to explore a contract or proposal.
To standardize what “good” looks like, many teams use a product demo checklist to enforce consistency.
Proposal (60%)
This is where deals go to die. Spekit's pipeline analysis shows the biggest conversion leak happens right here - 51% of deals that reach proposal never make it to negotiation. Proposal-to-close rates should land at 50-70%; if yours is below 40%, your proposals are sitting too long or arriving before the prospect is truly ready.
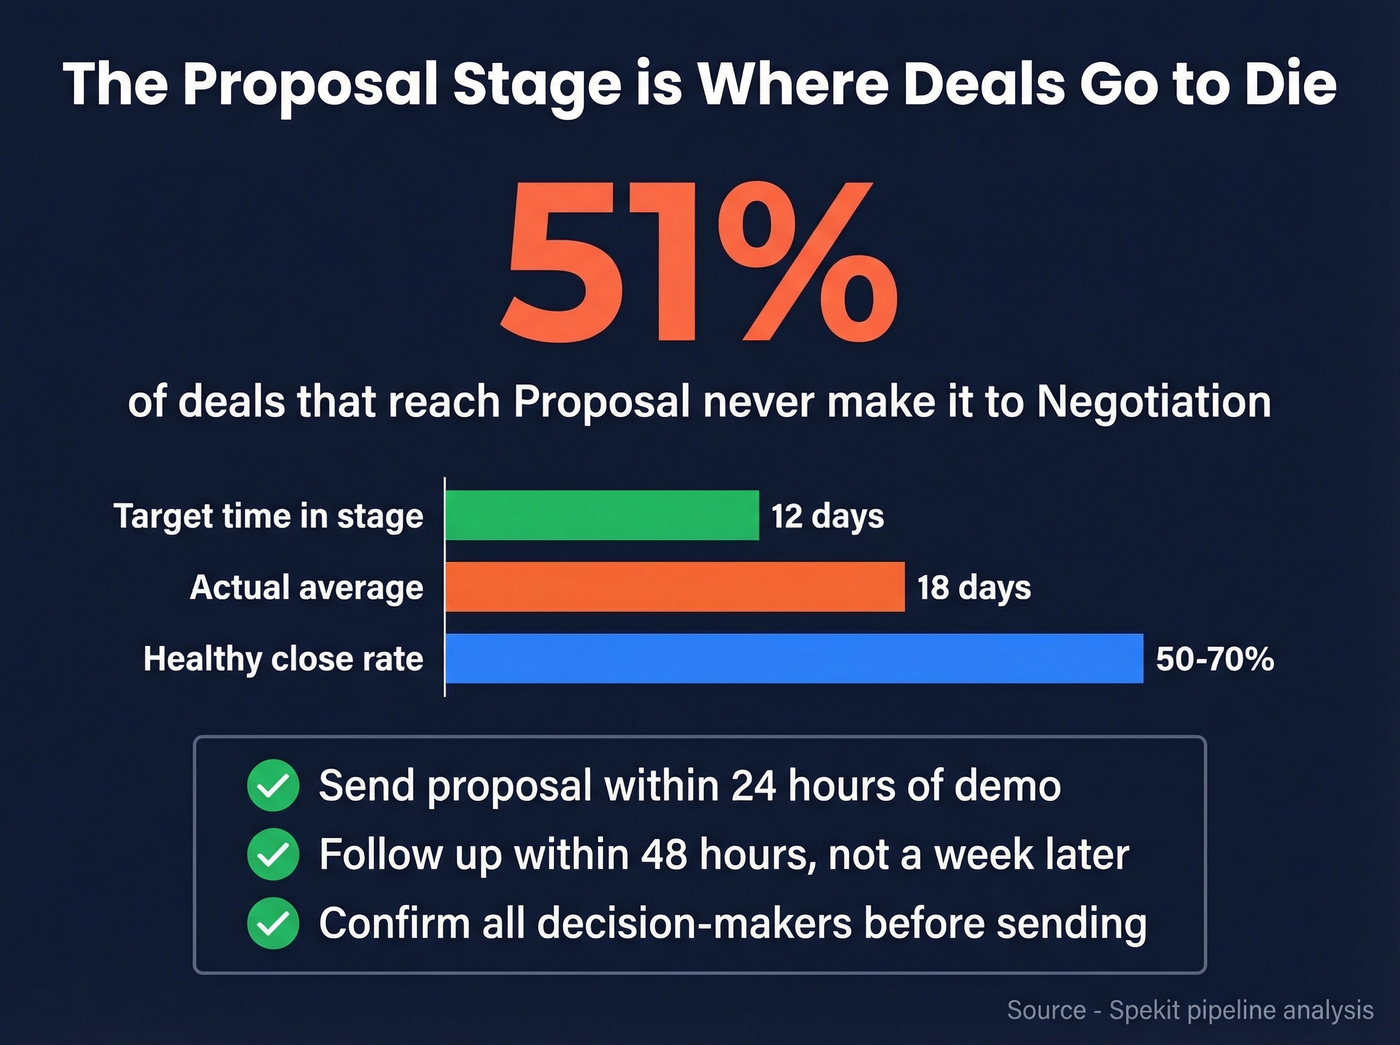
In Spekit's example, the diagnosis was simple: deals were spending an average of 18 days in the proposal stage against a 12-day target. Stale proposals kill momentum. Send the proposal within 24 hours of the demo, and follow up within 48 hours - not a week later.
Exit criteria:
- Proposal reviewed by all decision-makers
- Pricing and scope questions answered
- No new stakeholders introduced (if they are, you're back in discovery)
- Prospect provides feedback or a counteroffer
Negotiation (80%)
Terms are being hammered out - pricing, contract length, implementation timeline, SLAs. Procurement gets involved for enterprise deals. The deal is real. The question is whether the terms work for both sides.
Negotiation-to-close rates run 75-85% in healthy pipelines. Below 60%? You're entering negotiation before the prospect has internal alignment.
Exit criteria:
- All commercial terms agreed (price, payment, duration)
- Legal/procurement review complete
- Implementation timeline confirmed
- Verbal commitment or signature pending
Closed Won (100%)
Contract signed. Revenue booked. The deal moves to onboarding or customer success. This stage exists for tracking purposes - it's the finish line, not a working stage. Make sure the deal is logged in your CRM with accurate value and close date, and that the handoff to implementation or CS happens immediately. For teams running expansion revenue, consider adding post-sale pipeline stages for onboarding, renewal, and upsell - but that's a separate pipeline, not an extension of this one.
84% of reps miss quota because bad data poisons their pipeline at the prospecting stage. Prospeo's 300M+ profiles with 98% email accuracy and 7-day refresh cycle cut bounce rates from 35% to under 5% - so every deal entering your pipeline starts on verified ground.
Stop feeding stale data into Stage 1. Start with emails that actually connect.
How Many Stages Do You Need?
Every guide on the internet argues about whether you need 5, 7, or 8 stages. That's the wrong question.
A 5-stage pipeline with rigorous exit criteria will outperform a 9-stage pipeline where reps drag deals forward based on vibes. Some teams run a lean five - Prospecting, Qualification, Demo, Proposal, Closed - and close faster than competitors with twice as many stages.
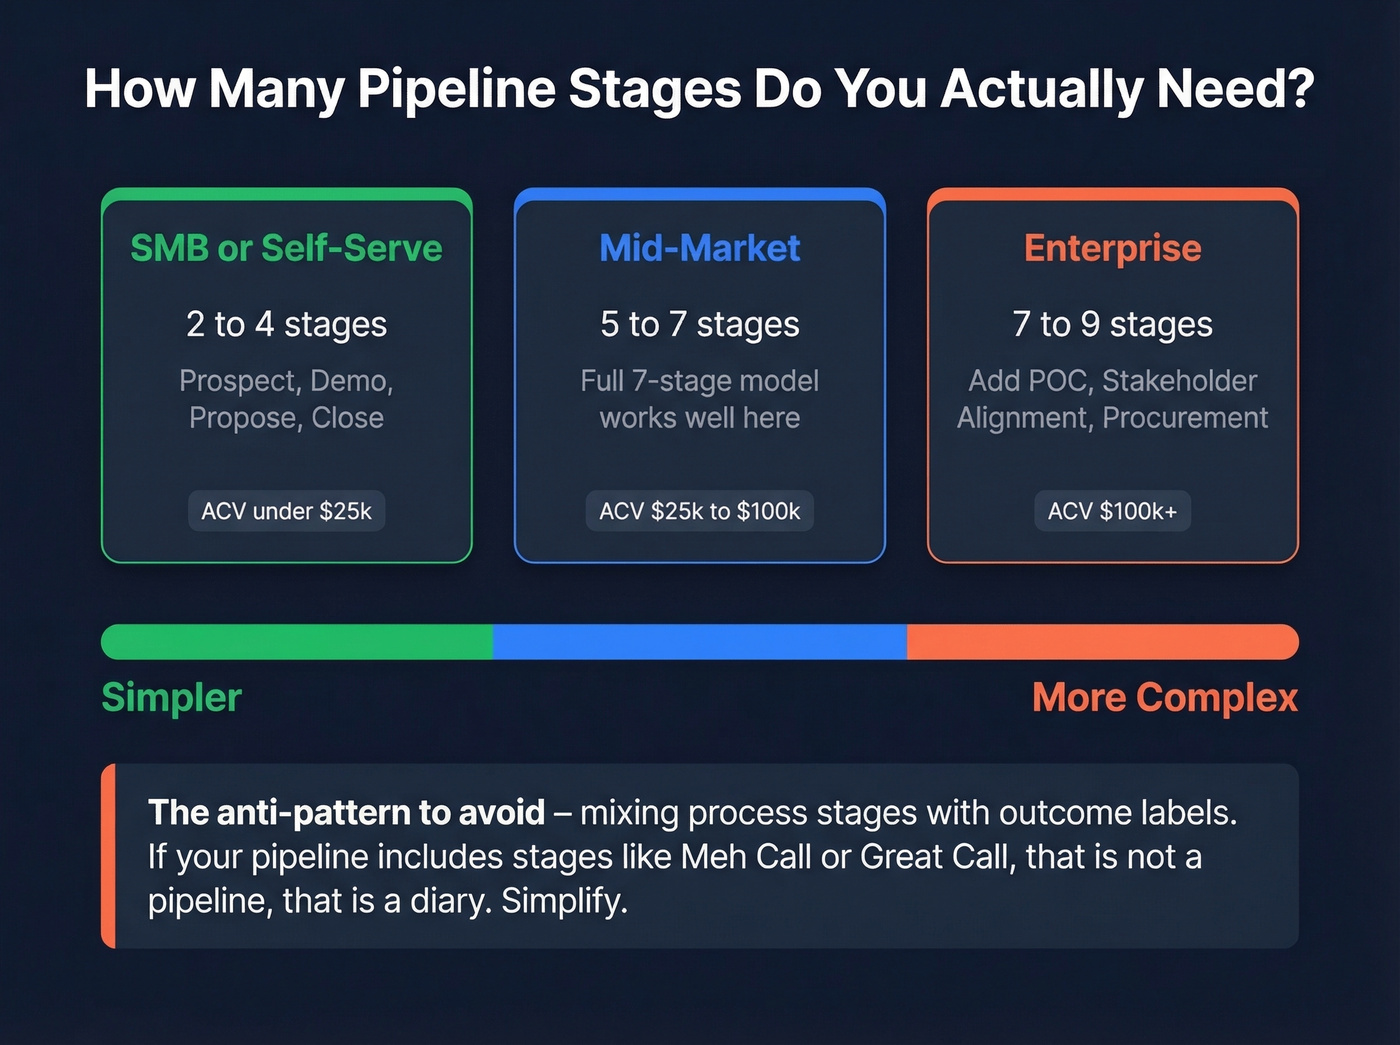
The general framework: SMBs selling lower-ticket deals can run 2-4 stages. Mid-market teams typically need 5-7. Enterprise orgs with procurement, legal, and security gates often land at 7-9. Most CRMs ship with default pipelines - customize them to match your actual sales motion rather than accepting the defaults.
One user in r/sales put it bluntly: "I've gotten sick of my company's CRM; it provides very little value for me as a field seller." Their proposed fix? Three stages - Prospect, Proposal, Closing - plus won/lost. That's aggressive, but the instinct is right. Reps won't update a pipeline they don't trust.
The anti-pattern to avoid is mixing process stages with outcome labels. We've seen pipelines that look like this: Lead Interested, Info Request, Meeting Request, Never Replied, Meeting Booked, Missed Call, Meh Call, Great Call, Proposal Sent, Won, Lost. That's not a pipeline. That's a diary. "Meh Call" and "Great Call" are subjective judgments, not stage gates. "Never Replied" is a dead-end bucket masquerading as a stage. If your pipeline has more than seven stages and some of them describe feelings, simplify.
Stop obsessing over the number of stages. Start obsessing over exit criteria.
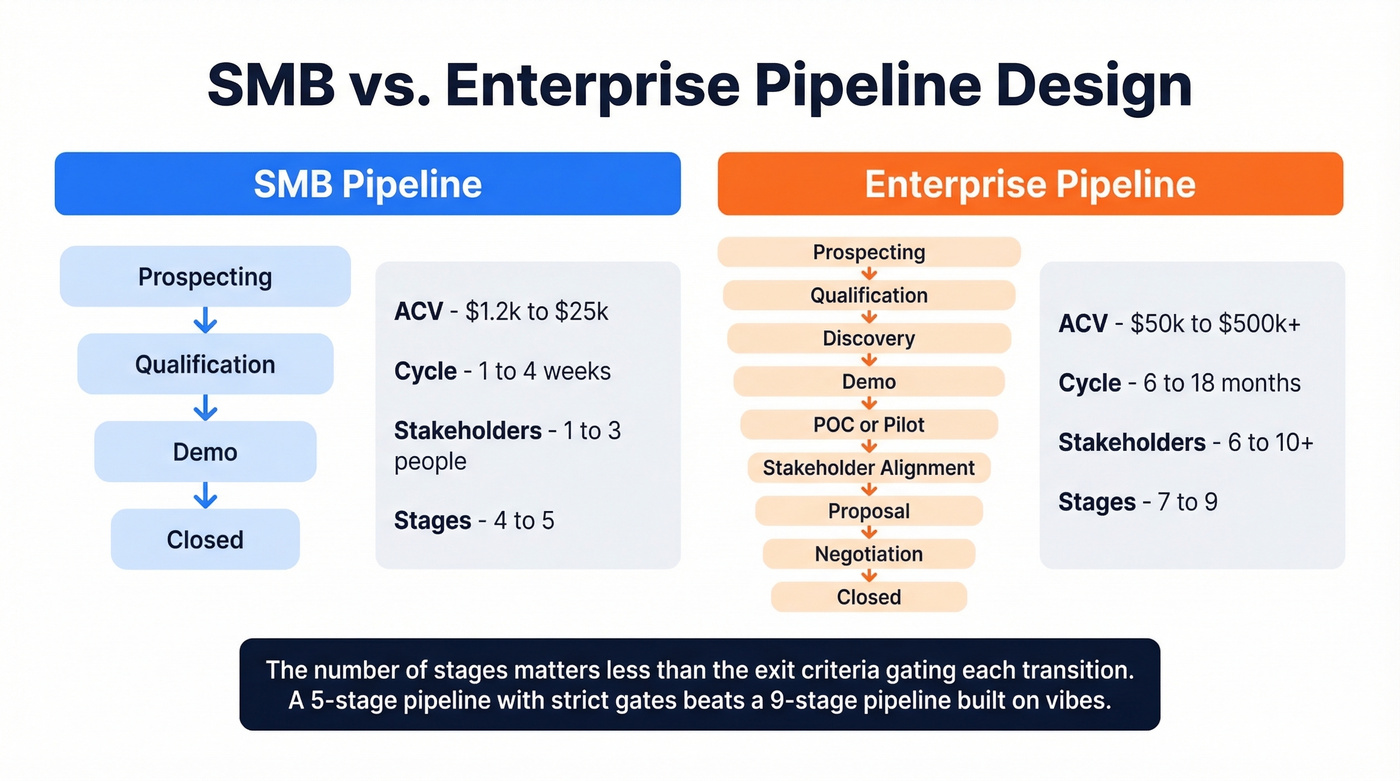
SMB vs. Enterprise Design
The same seven stages don't work identically for a $5k deal and a $300k deal. The underlying logic is the same, but enterprise pipelines need additional gates that SMB pipelines don't.
| Dimension | SMB | Enterprise |
|---|---|---|
| ACV | $1.2k-$25k | $50k-$500k+ |
| Cycle length | 1-4 weeks | 6-18 months |
| Stakeholders | 1-3 | 6-10+ |
| Stages | 4-5 | 7-9 |
| Key additions | - | POC/Pilot, Stakeholder Alignment, Procurement/Legal |
| Lead-to-MQL | ~41% | - |
| SQL-to-Opportunity | ~42% | ~36% |
| Opportunity-to-Close | ~39% | ~31% |
For SMB, the pipeline compresses. A founder selling a $10k annual contract might go from demo to proposal in a single call. Adding a "Stakeholder Alignment" stage for a deal with one decision-maker is just bureaucracy.
Enterprise is different. A $200k deal with eight stakeholders needs explicit stages for proof-of-concept, multi-threading across the buying committee, and navigating procurement and legal review. Skipping these stages doesn't make the work disappear - it just makes it invisible in your CRM, which means your forecast is guessing.
Skip the extra stages if your ACV is under $15k. Adding stages to a short-cycle deal doesn't add visibility - it adds friction. Save the complexity for deals that justify it.
Stage-by-Stage Conversion Benchmarks
Knowing your stages is step one. Knowing what "good" looks like at each transition is step two. Here are benchmarks from three sources - they don't agree perfectly, which is actually useful because it shows you the range rather than a false sense of precision.
| Transition | First Page Sage (B2B SaaS) | MarketJoy (All B2B) | Digital Bloom (SMB/Mid-Market SaaS) |
|---|---|---|---|
| Lead to MQL | 39% | 20-25% | 41% |
| MQL to SQL | 38% | 12-18% | 39% |
| SQL to Opportunity | 42% | 10-12% | 42% |
| Opp to Closed Won | 37% | 6-9% | 39% |
The MarketJoy numbers are lower because they're measuring a broader set of B2B companies, not just SaaS. The biggest bottleneck across all industries and company sizes? MQL to SQL, which runs 15-21% in aggregate studies - significantly lower than the SaaS-specific figures above. That gap is where marketing and sales alignment either works or doesn't.
Two benchmarks worth pinning to your wall: the median B2B sales cycle runs 84 days, with top performers closing in 46-75 days. Typical win rates land at 20-30%.
Let's make this concrete with a worked example from Spekit's analysis: 150 leads enter the pipeline. 120 qualify (80%). 85 reach proposal (71% of qualified). 42 enter negotiation (49% of proposals). 28 close (67% of negotiations). Overall lead-to-customer conversion: 19%. The biggest leak? Proposal to negotiation - 51% loss. The diagnosis: deals spending an average of 18 days in the proposal stage against a 12-day target.
If your numbers look wildly different from these ranges, that's not necessarily bad - but it's a signal to investigate. A 60% MQL-to-SQL rate might mean your qualification bar is too low. A 3% lead-to-close rate might mean your top-of-funnel data needs work.
If you want a broader set of reference points, compare these ranges against dedicated sales pipeline benchmarks before you reset targets.
Forecasting and Velocity Math
Two formulas every pipeline operator needs to know.
Weighted pipeline value tells you what your pipeline is actually worth, not what it looks like on paper. The formula: Deal Amount x Stage Probability = Weighted Value. A $50k deal at the proposal stage (60%) is worth $30k in your forecast. A $100k deal at prospecting (5%) is worth $5k. Add them up across all active deals and you've got a realistic revenue picture.
| Deal | Amount | Stage | Probability | Weighted |
|---|---|---|---|---|
| Acme Corp | $80k | Negotiation | 80% | $64k |
| Beta Inc | $40k | Proposal | 60% | $24k |
| Gamma Ltd | $25k | Discovery | 20% | $5k |
| Delta Co | $60k | Qualification | 10% | $6k |
| Total | $205k | $99k |
Your unweighted pipeline says $205k. Your weighted pipeline says $99k. The weighted number is closer to reality. Stage-based forecasting delivers 85-95% accuracy for the current quarter and 70-80% for next quarter when stages are disciplined.
For calibration, here are SaaS stage-to-close conversion ranges - use these to sanity-check your probability assignments:
| Stage | Typical close rate from this stage |
|---|---|
| Qualification | 15-25% |
| Demo/Discovery | 20-30% |
| Proposal | 50-70% |
| Negotiation | 75-85% |
If you’re evaluating tooling for this, start with a shortlist of sales forecasting solutions that support stage-based models.
Pipeline velocity tells you how fast money moves through your pipeline: (Opportunities x Avg Deal Size x Win Rate) / Sales Cycle Length. Example: 100 opportunities x $10,000 average deal x 20% win rate / 50 days = $4,000/day in revenue velocity.
You've got four levers to increase it: more qualified opportunities, larger deals, higher win rates, or shorter cycles. Most teams fixate on the first one. The highest-leverage move is usually shortening cycle length by killing stalled deals faster. 40-60% of deals are lost to "no decision" - not to a competitor. Those stalled deals aren't just lost revenue. They're dragging your velocity metric down and polluting your forecast.
Common Pipeline Mistakes
Four mistakes that show up in almost every pipeline audit we've run.
Over-engineering stages. The "Meh Call / Great Call" pipeline from that Reddit thread is a real example. When stages describe subjective outcomes instead of objective milestones, reps interpret them differently, data becomes meaningless, and your forecast is fiction. Every stage name should be a noun or verb phrase that describes a concrete action or milestone, not a feeling.
No exit criteria. Without explicit gates, one rep's "Qualified" is another's "Prospecting." Deals get pushed forward because the rep had a good feeling about the call. Write down 3-4 bullet-point exit criteria for every stage. Make them checkboxes in your CRM. If the boxes aren't checked, the deal doesn't move.
Ignoring data quality at Stage 1. If your bounce rate is creeping above ~5%, your pipeline metrics are lying to you. Every conversion rate downstream is inflated because you're measuring against a denominator full of dead contacts. Any verification tool is better than none - Prospeo's 98% email accuracy and 7-day refresh cycle is what our team uses, but the point is that garbage in means garbage forecast out. (If you need a deeper breakdown of causes and fixes, start with email bounce rate.)
Not cleaning stale deals. Deals that sit in a stage past your average cycle length without activity aren't "still alive." They're dead weight. For mid-market SaaS with a 60-day average cycle, flag any deal sitting in a single stage for more than 21 days. If a deal exceeds 1.5x your average days-in-stage without a logged activity, flag it for review or automatic disqualification. Build explicit disqualification conditions into your pipeline hygiene process: no need, no ICP fit, ghosting, and "RFP filler."
If you’re seeing these issues repeatedly, it’s usually part of broader sales pipeline challenges that need process + tooling fixes.
Pipeline velocity math breaks when half your contacts bounce. Snyk's 50 AEs dropped bounce rates from 40% to under 5% and added 200+ new opportunities per month with Prospeo - because every stage converts better when the data entering it is real.
Fix your pipeline conversion rates at the source - starting at $0.01 per verified email.
FAQ
What's the difference between a pipeline and a sales process?
A sales process is the methodology your team follows - discovery questions, objection handling, closing techniques. A pipeline is the visual representation of where every deal sits across defined stages. The process dictates how reps sell; the pipeline tracks where deals are and what happens next. You need both, but they serve different purposes.
What sales pipeline steps do most B2B teams follow?
Most B2B teams follow seven steps: Prospecting, Qualification, Discovery, Demo, Proposal, Negotiation, and Closed Won. The exact names vary, but the progression from identifying a lead to signing a contract stays consistent. What separates high performers isn't the step count - it's having clear definitions for each transition so every rep moves deals using the same criteria.
How often should you review your pipeline?
Weekly for deal-level reviews - move, advance, or kill stalled deals. Monthly for health metrics like conversion rates by stage, velocity, and coverage ratio. Quarterly for structural changes: adding, removing, or redefining stages based on actual data. The weekly cadence is non-negotiable.
How do you keep Stage 1 data from wrecking downstream metrics?
Pair your CRM with a verification tool that refreshes contact data regularly. Bounce rates above 5% quietly inflate every conversion rate downstream. In our experience, teams that verify emails before outreach see immediate improvements - Meritt dropped their bounce rate from 35% to under 4% and tripled weekly pipeline from $100K to $300K after cleaning up their data source.
How many sales pipeline stages should my team use?
For SMB deals under $10k, 2-4 stages. Mid-market, 5-7. Enterprise with procurement and legal gates, 7-9. The number matters far less than whether each stage has clear, enforceable exit criteria. If your reps can't explain what has to happen before a deal advances, you have too many stages or too few rules. Review quarterly and adjust based on where deals actually stall.