Sales Resource Allocation: Formulas, Benchmarks, and Frameworks That Work
It's Q4 planning season. Finance just sent over next year's targets - 20% growth, same headcount. You open the capacity model and realize it's a spreadsheet someone built three years ago with hardcoded assumptions that no longer reflect reality.
Sales resource allocation deserves better than the same four bullet points every guide recycles: people, budget, tools, time. That's not a framework. That's a fortune cookie.
Here's what actually moves the number: fix your capacity formula so you're planning from productive capacity instead of quota, benchmark utilization and selling time against real data, clean your contact data so allocated capacity reaches actual prospects, and optimize territories algorithmically rather than on a whiteboard.
Confusing Quota with Capacity
This is the single most expensive mistake in sales planning. OnlyCFO breaks it down into three concepts that most leadership teams conflate:
- Capacity - the expected annualized contribution of a ramped AE based on real productivity.
- Productivity - actual average output of ramped and ramping AEs, measured over the last quarter or LTM.
- Quota - a comp target set by the CRO and CFO to drive incentives.
Raising quota doesn't increase productive capacity. We've seen this pattern repeatedly: leadership raises quotas 10-15% without evidence that productivity has risen, attainment drops, and rep attrition spikes. Whether you use a top-down, bottom-up, or hybrid planning approach, the math underneath stays the same. Plan from productive capacity first, then use quota for comp design.
Capacity Formulas That Drive Allocation
The baseline formula is straightforward:
Sales Capacity = # Reps x (Quarterly Quota x Avg Quota Attainment)
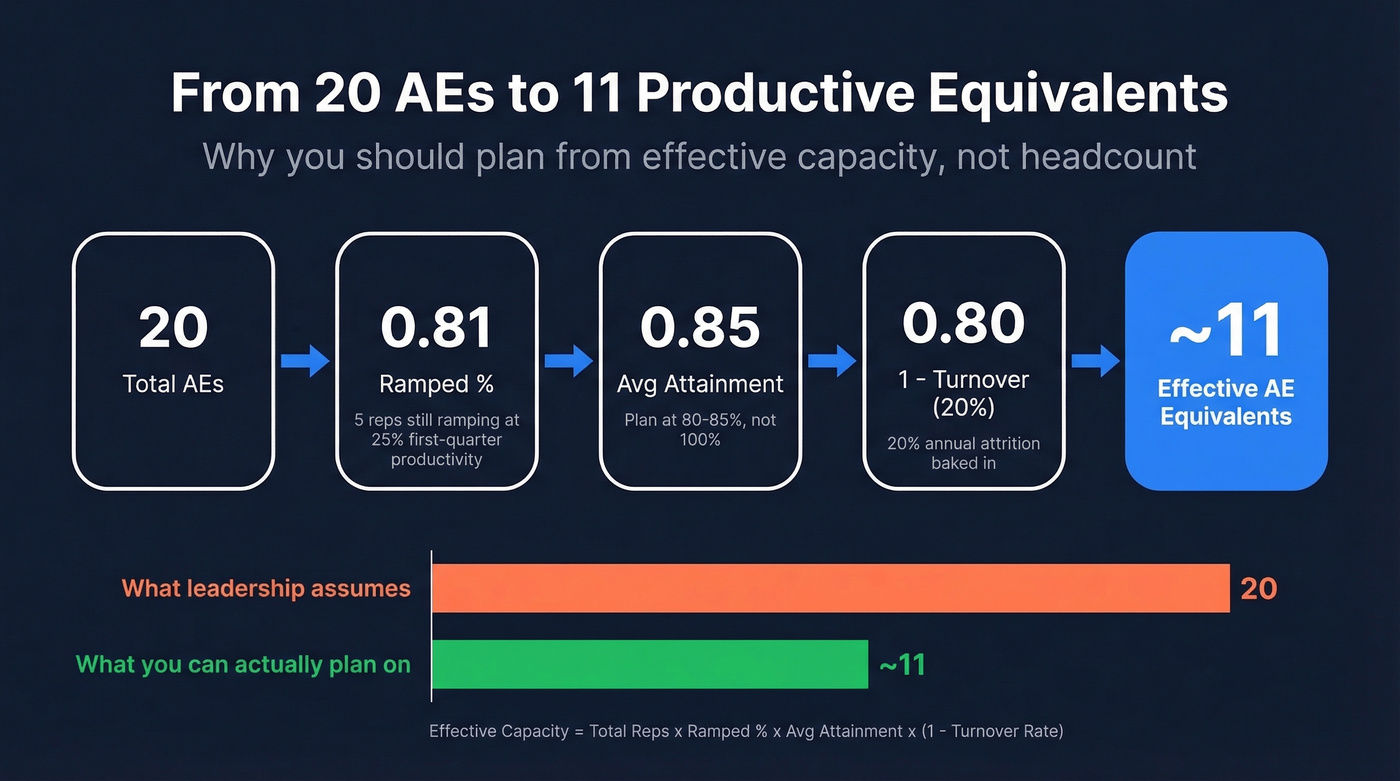
The formula that actually reflects reality accounts for ramp and churn:
Effective Capacity = Total Reps x Ramped % x Avg Quota Attainment x (1 - Turnover Rate)
Quick example: 20 AEs, five still ramping (all in their first quarter, using a standard 25% / 50% / 75% / 100% ramp curve). Average attainment is 85%, annual turnover runs 20%.
Effective Capacity = 20 x 0.81 x 0.85 x (1 - 0.20) = ~11 fully productive AE-equivalents. Not 20. Not even close.
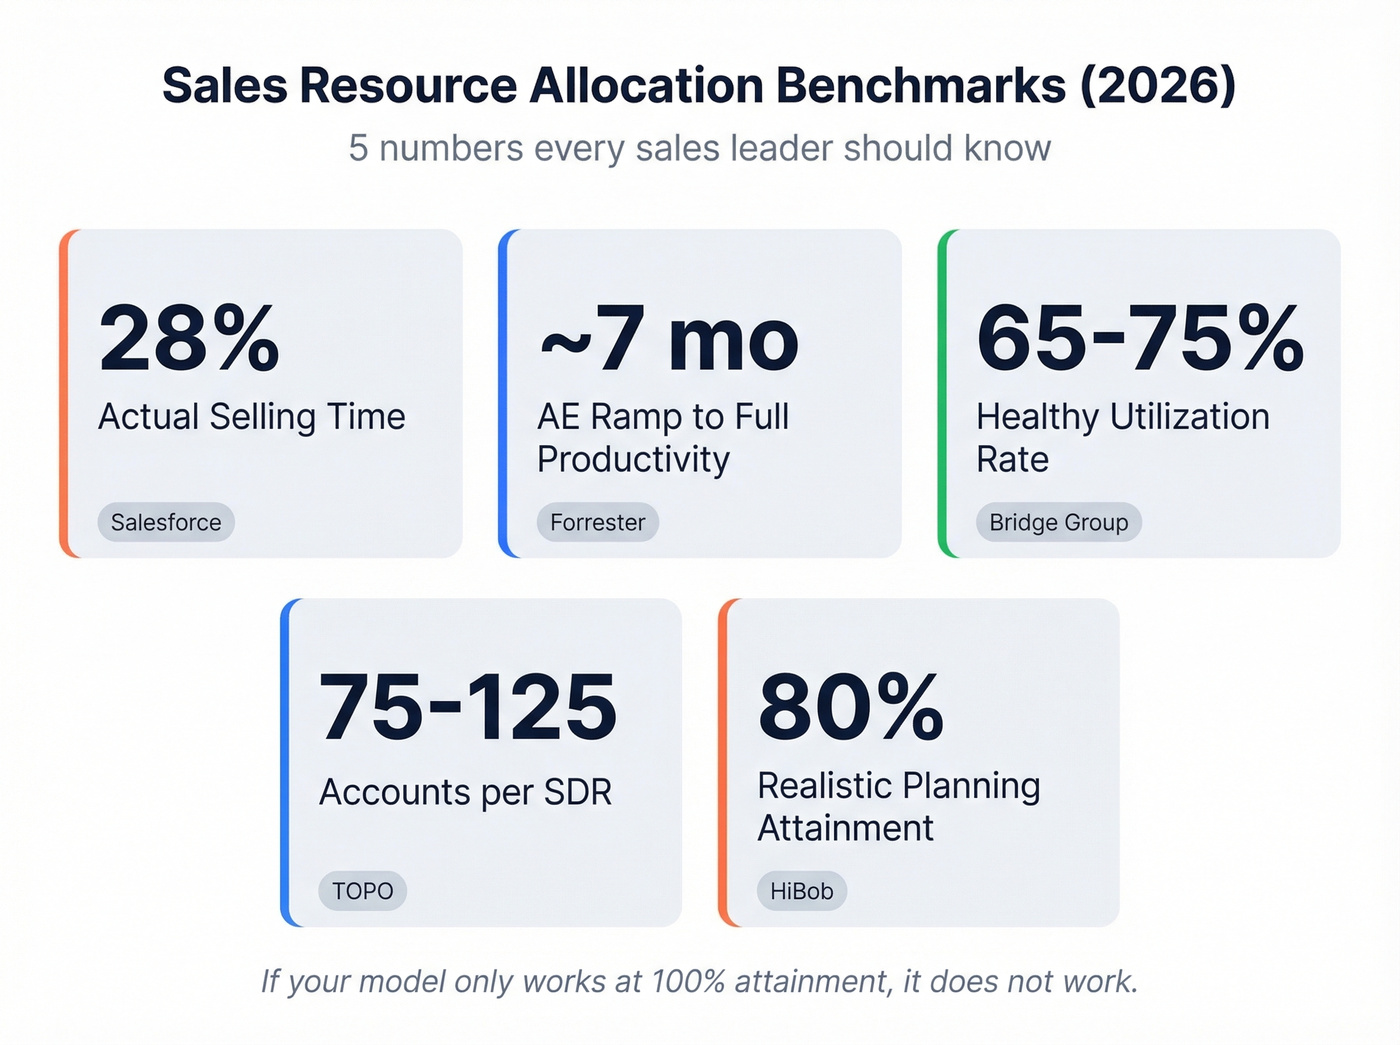
For SaaS, bookings-to-OTE ratio typically targets 3.0x-5.0x. Finance teams should scenario-model attainment at 80%, 100%, and 120%, with 80% as the realistic planning benchmark. If your model only works at 100% attainment, it doesn't work. (If you need a clean definition and math, see OTE.)
Here's the thing: most teams don't have a hiring problem. They have a capacity realization problem. Fixing data quality, territory balance, and ramp programs on your existing team will almost always outperform adding headcount into a broken system.
Benchmarks to Pressure-Test Your Model
| Metric | Benchmark | Source |
|---|---|---|
| Actual selling time | 28% | Salesforce |
| AE ramp to full productivity | ~7 months | Forrester |
| Healthy utilization rate | 65-75% | Bridge Group |
| Accounts per SDR | 75-125 | TOPO |
| Realistic planning attainment | 80% | HiBob |
The selling time number is the one that breaks most models. A rep who theoretically handles 20 qualified opportunities realistically handles 12-15 after non-selling activities eat 72% of their week. Below 65% utilization wastes capacity; above 75% burns out reps and drives turnover.
And practitioners keep asking for productivity metrics beyond quota attainment - things like revenue per rep hour and pipeline coverage by territory. They're right to push for those. Quota attainment alone tells you whether reps hit a number, not whether your allocation is efficient. If you're tightening the model, it helps to track sales operations metrics alongside output.
Your reps only sell 28% of their week. Don't let bad data shrink that further. Prospeo's 98% verified emails and 7-day refresh cycle mean every minute of allocated selling time reaches a real prospect - not a bounced inbox.
Turn your capacity model into actual pipeline. Start free, no contract.
Territory Optimization: Where Allocation Wins or Dies
Territory design is where most teams leave the biggest gains on the table. Let's look at the data:
| Method | Coverage | Travel Reduction |
|---|---|---|
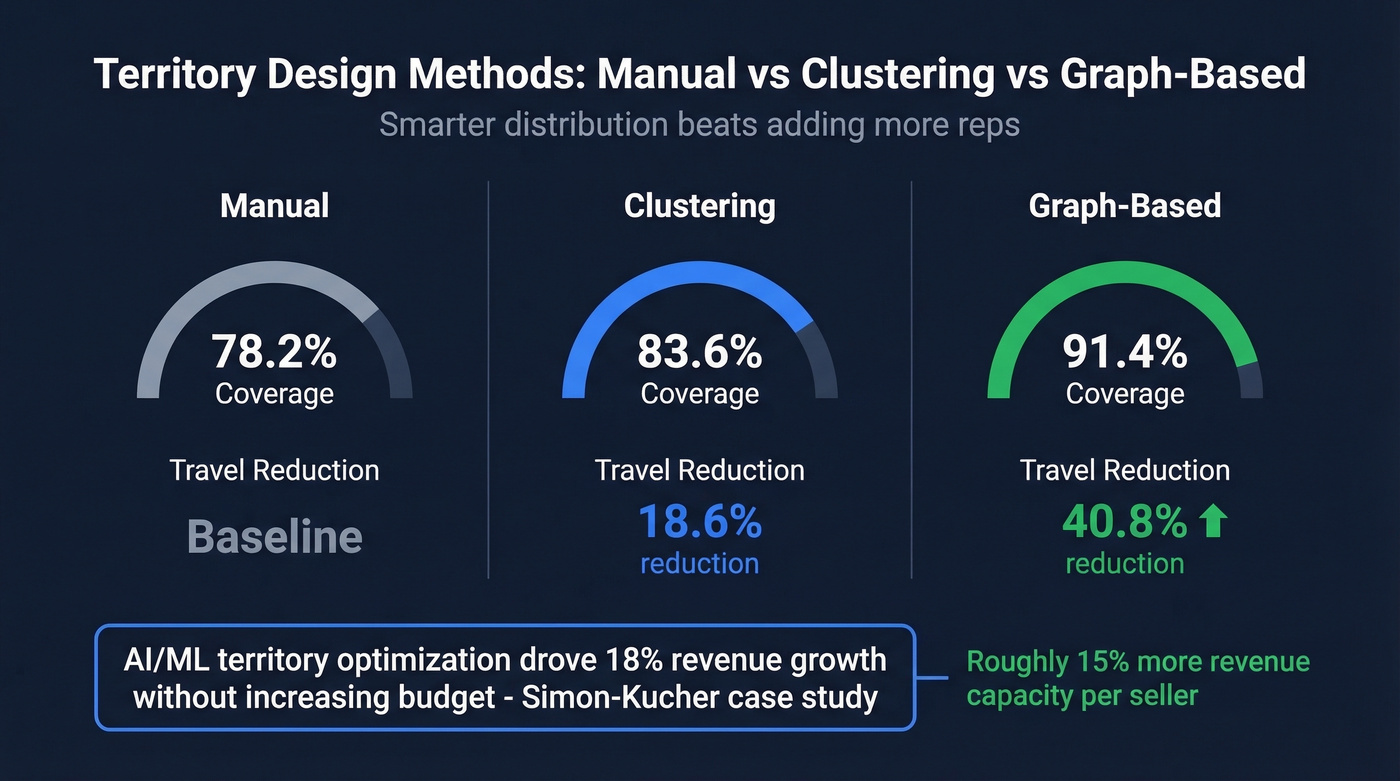
| Manual | 78.2% | Baseline |
| Clustering | 83.6% | 18.6% |
| Graph-based | 91.4% | 40.8% |
The modern approach uses Weighted TAM - scoring accounts on revenue potential, propensity to buy, competitive pressure, and strategic value - rather than raw account counts. Fair doesn't mean equal. It means equal opportunity to succeed. A rep with 50 high-fit enterprise accounts and another with 200 low-fit SMB accounts can both have "fair" territories if the revenue potential is balanced. (If you want the underlying market-sizing concepts, see addressable market.)
Simon-Kucher published a case study where an AI/ML allocation optimization model drove 18% revenue growth without increasing the overall budget. Smarter distribution often beats "add more."
Territory changes are a primary driver of rep dissatisfaction and early-year revenue drag. The fix isn't avoiding changes - it's shifting from annual "big bang" resets to quarterly micro-adjustments that keep territories aligned without blowing up rep pipelines. In our experience, teams that adopt quarterly rebalancing see measurably less early-year revenue drag and better sales forecasting accuracy. AI-assisted territory optimization can unlock roughly 15% more revenue capacity per seller, which often exceeds the impact of a net-new hire.
For organizations scaling across regions, territory-based capacity planning connects headcount decisions to geographic and segment-level demand. You hire into the territories that actually need coverage, not just the ones that are loudest. If you're operationalizing this, sales mapping software can make coverage gaps obvious fast.
Why Data Quality Multiplies Every Allocation Decision
This is where most capacity models silently fail. You can nail your formulas, benchmark your utilization, and optimize territories - then waste 30% of allocated capacity because your contact data is garbage.
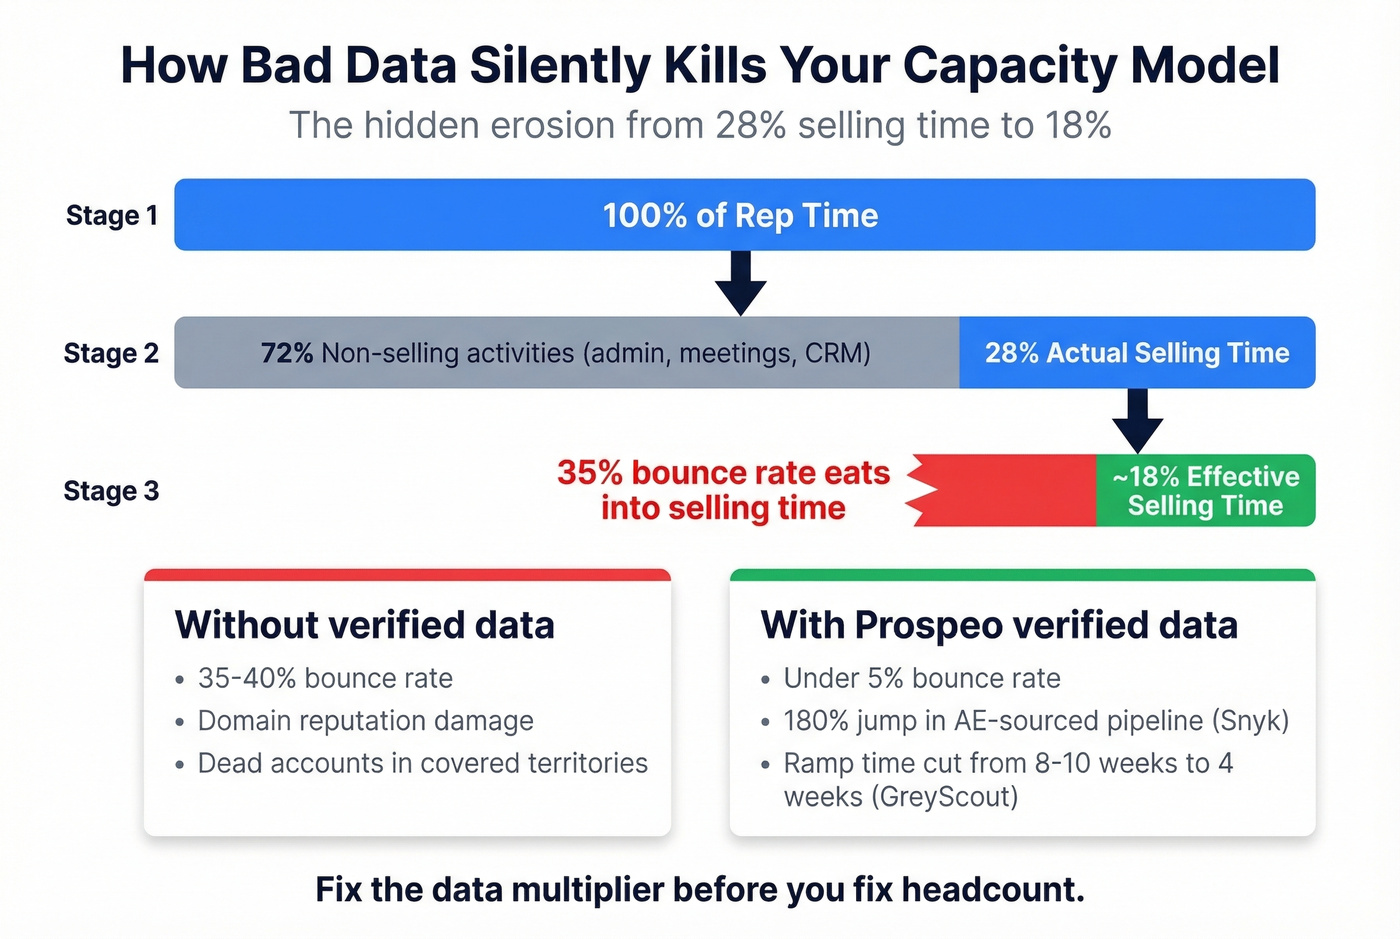
The logic chain is brutal. If 35% of emails bounce, a rep's effective selling time drops from that already-painful 28% to roughly 18%. That's before you factor in follow-ups, domain reputation damage, and the opportunity cost of dead accounts in "covered" territories. (If you want the mechanics and fixes, start with email bounce rate and email deliverability.)
Snyk saw this firsthand - 50 AEs with bounce rates running 35-40%. After switching to Prospeo for verified contact data, bounces dropped under 5% and AE-sourced pipeline jumped 180%. GreyScout cut rep ramp time from 8-10 weeks to 4 weeks once reps stopped burning their first month on bad data. With 98% email accuracy and a 7-day data refresh cycle, verified contacts turn your allocation model from a theoretical exercise into actual pipeline.

Implementation Checklist
- Audit current capacity using the Effective Capacity formula (not raw headcount)
- Benchmark selling time and utilization against industry data (28% / 65-75%)
- Separate quota targets from productive capacity in planning conversations
- Verify contact data quality - measure your actual bounce rate this week
- Run territory coverage analysis and quantify the manual-vs-algorithmic gap
- Layer in territory-based capacity planning so headcount maps to segment-level demand
- Model scenarios at 80% / 100% / 120% attainment before committing to a hiring plan
- Revisit quarterly, not annually (a lightweight QBR cadence helps.)
Snyk cut bounce rates from 35% to under 5% and saw AE-sourced pipeline jump 180%. GreyScout halved rep ramp time to 4 weeks. The difference wasn't headcount - it was data quality multiplying every allocation decision they'd already made.
Stop hiring into broken data. Fix the multiplier first.
FAQ
What's the difference between sales capacity and quota?
Capacity is the expected output of a ramped AE based on real productivity data - what your team can actually produce. Quota is a compensation target set by leadership to drive incentives. They diverge when quotas rise without evidence that underlying productivity has increased, which tanks attainment and spikes turnover.
How many accounts should an SDR manage?
The TOPO benchmark is 75-125 accounts per SDR, with roughly 16 touches per account. This varies significantly by deal size and segment - an SDR working enterprise deals with six-figure contract values will carry fewer accounts than one running high-velocity SMB outbound.
How does bad contact data affect resource allocation?
Bounced emails and dead phone numbers waste the capacity you've carefully modeled. If a third of your contact data is stale, you're effectively overstaffing by 30% without realizing it. Verified data with high accuracy and frequent refresh cycles ensures allocated rep time converts to actual prospect conversations instead of wasted dials and domain damage.
What's a good bookings-to-OTE ratio for SaaS sales teams?
Most SaaS finance teams target a 3.0x-5.0x bookings-to-OTE ratio. Below 3x signals overpaying relative to output; above 5x often means quotas are set unrealistically high and you'll see attrition. Model at 80% attainment to stress-test the ratio before committing headcount.