Sales ROI: The Formula, Benchmarks, and Fixes Most Teams Miss
Finance just asked why your 12-person sales team costs $1.8M a year. You pull up the revenue number - looks fine. Then they ask for the actual sales ROI calculation, and you realize you've never done one properly. You're not alone. Roughly 37% of sales and marketing budgets get wasted due to poor targeting and measurement gaps, and the denominator problem shows up in nearly every return-on-investment conversation we've had with sales leaders.
Here's the thing: most teams dramatically overstate their ROI because they leave half the costs out of the formula. Let's fix that.
The Short Version
The real formula is (Revenue - Total Cost) / Total Cost x 100. The key word is total - most teams leave half their costs out of the denominator. A 3:1 return is survival, not success; aim for 5:1. The three fastest levers to move your number this quarter: cut ramp time, verify your contact data before reps touch it, and kill the tools nobody uses.
What Is Sales ROI?
Sales ROI measures the profit your sales operation generates relative to what it costs:
ROI = ((Revenue - Total Cost) / Total Cost) x 100
A 300% ROI means you're generating $3 in profit for every $1 spent. With this formula, that also implies $4 in revenue per $1 of cost, because revenue equals cost plus profit. Simple enough - until you realize most teams botch the denominator.
One critical distinction: ROI is profit-based. ROAS is revenue-based. When someone says "3X return," ask which one they mean. A "3X ROAS" sounds great until you realize it doesn't account for rep salaries, tools, or overhead.
There's also MER (Marketing Efficiency Ratio): total revenue divided by total marketing/ad spend. It's useful at the portfolio level, but it won't diagnose a specific sales team problem.
How to Calculate Sales ROI
The Full Cost Checklist
The formula is easy. Getting the inputs right is where teams fall apart. A recurring theme on r/sales and RevOps communities: people use only the initial investment in the denominator and exclude everything else. Here's what actually belongs in there:
| Cost Category | Typical Range |
|---|---|
| Base salary | $60K-$120K/rep |
| OTE / commissions | $30K-$80K/rep |
| Benefits (20-30% of comp) | $18K-$60K/rep |
| Ramp cost (avg 4.5 months) | ~4-5 months of loaded cost |
| CRM | $75-$300/user/mo |
| Sales engagement tools | $100-$150/user/mo |
| Data / intelligence tools | $0.01-$1/lead |
| Training | $1K-$5K/rep/year |
| Management allocation | $8K-$15K/rep/year |
| Office / overhead | $3K-$10K/rep/year |
Don't forget: fully burdened CAC includes exec time on sales calls. If the founder is doing demos, that's a cost. (If you want a clean definition and inputs, start with CAC.)
Worked Example
One mid-market AE, $150K fully loaded cost covering salary, commission, and benefits, generates $600K in closed-won revenue.
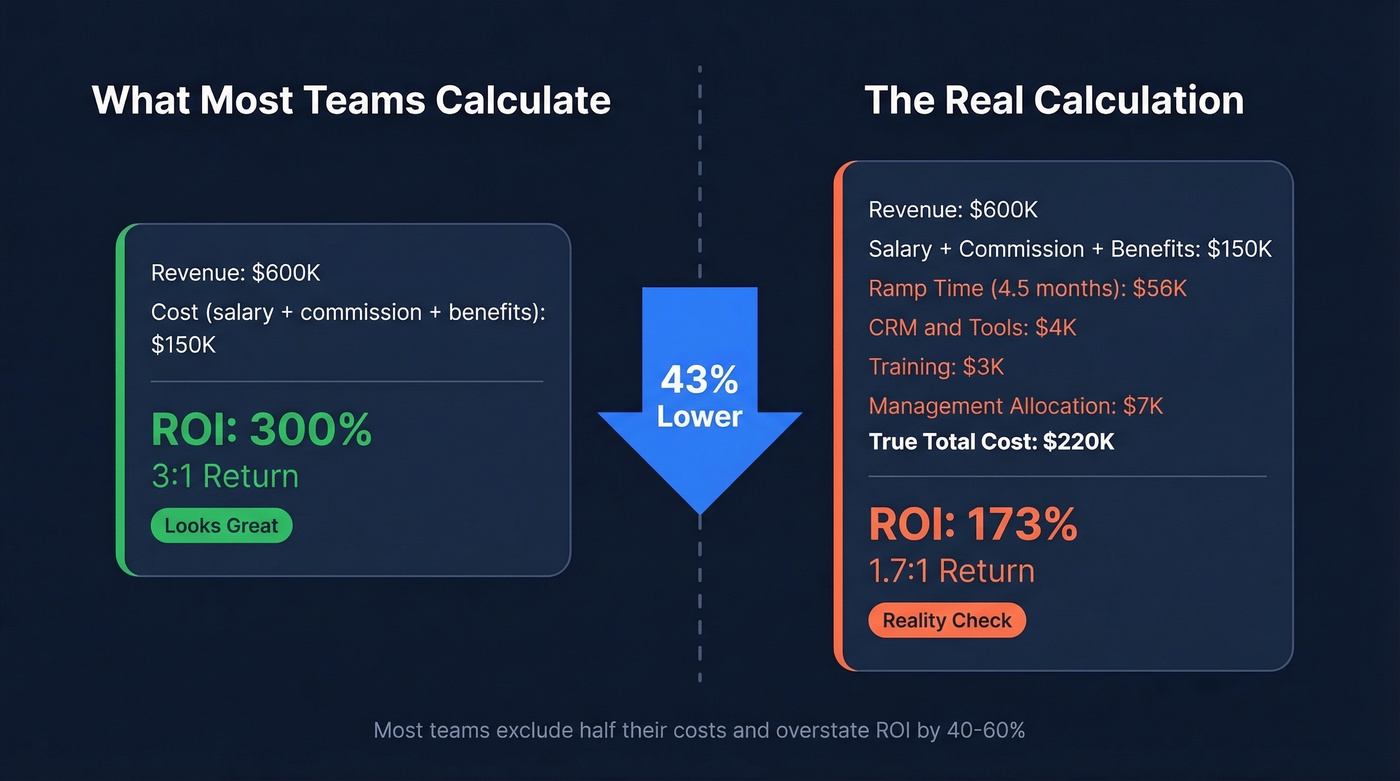
ROI = (($600K - $150K) / $150K) x 100 = 300% (3:1)
Now add the costs most teams conveniently forget: 4.5 months of ramp time at $56K, CRM and tools at $4K/year, training at $3K, and management allocation at $7K. Total cost jumps to $220K.
ROI = (($600K - $220K) / $220K) x 100 = 173%
That 3:1 just became 1.7:1. Most teams exclude half the costs and wonder why their "profitable" sales org feels tight on cash.
You just saw how hidden costs cut a 3:1 ROI down to 1.7:1. Now imagine your reps are also burning hours on bounced emails and dead numbers. Prospeo delivers 98% email accuracy on a 7-day refresh cycle at ~$0.01/lead - so every dollar in your denominator actually produces pipeline.
Stop inflating costs with bad data. Start with 75 free verified emails.
Benchmarks Worth Knowing
| Metric | Benchmark |
|---|---|
| Survival floor | 3:1 (300%) |
| Strong performance | 5:1 (500%) |
| Elite per rep or source | 400-600% |
| SaaS CAC payback | 6 months |
| SaaS LTV:CAC | 6:1 |
| B2B win rate | ~20-21% |
| SaaS lead-to-win | 5.2% |
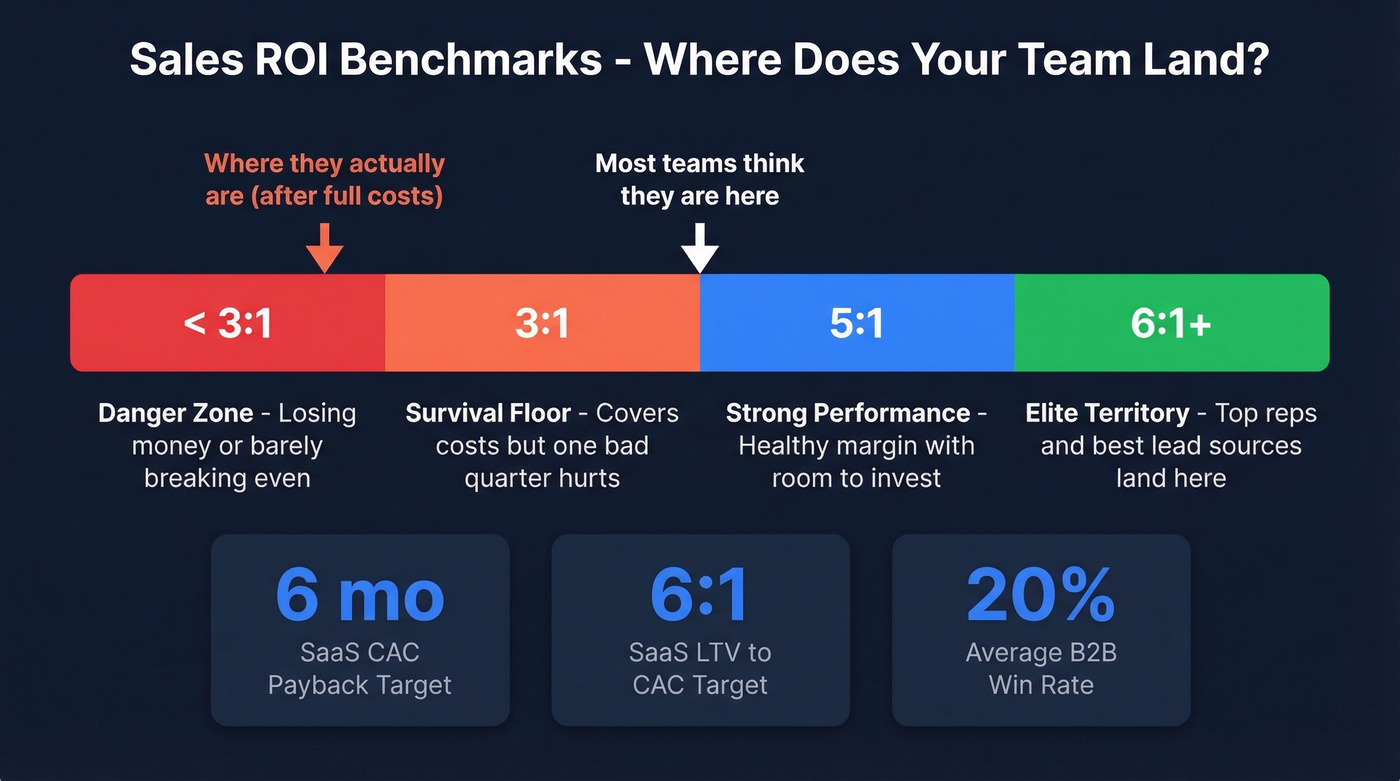
The 3:1 number isn't a target - it's a floor. At 3:1, you're covering costs and barely generating enough margin to absorb one bad quarter. Strong teams operate at 5:1 or better.
For SaaS companies with a 6-month CAC payback, you're recouping acquisition costs in about half a year. Shorten payback and your return on investment improves fast; let payback drift and it gets crushed by cash flow.
For context, even mature channels struggle with returns: search advertising averages $1.43 per dollar spent, linear TV hits $1.83, and print reaches $2.20. A well-run sales team should crush all of these. In our experience, the teams that break 5:1 aren't doing anything exotic - they just measure everything and stop pretending ramp costs don't exist.
What Drives (and Destroys) Returns
Deal velocity is the single biggest lever most teams underestimate. Deals closed within 50 days show a 47% win rate versus roughly 20% after that threshold, and the average B2B sales cycle has ballooned to 6.5 months - up from 4.9 months in 2019, partly because buying committees now average 25 stakeholders. Every extra week in the pipeline costs you money and lowers your probability of winning. (If you need a diagnostic framework, use these pipeline health metrics.)
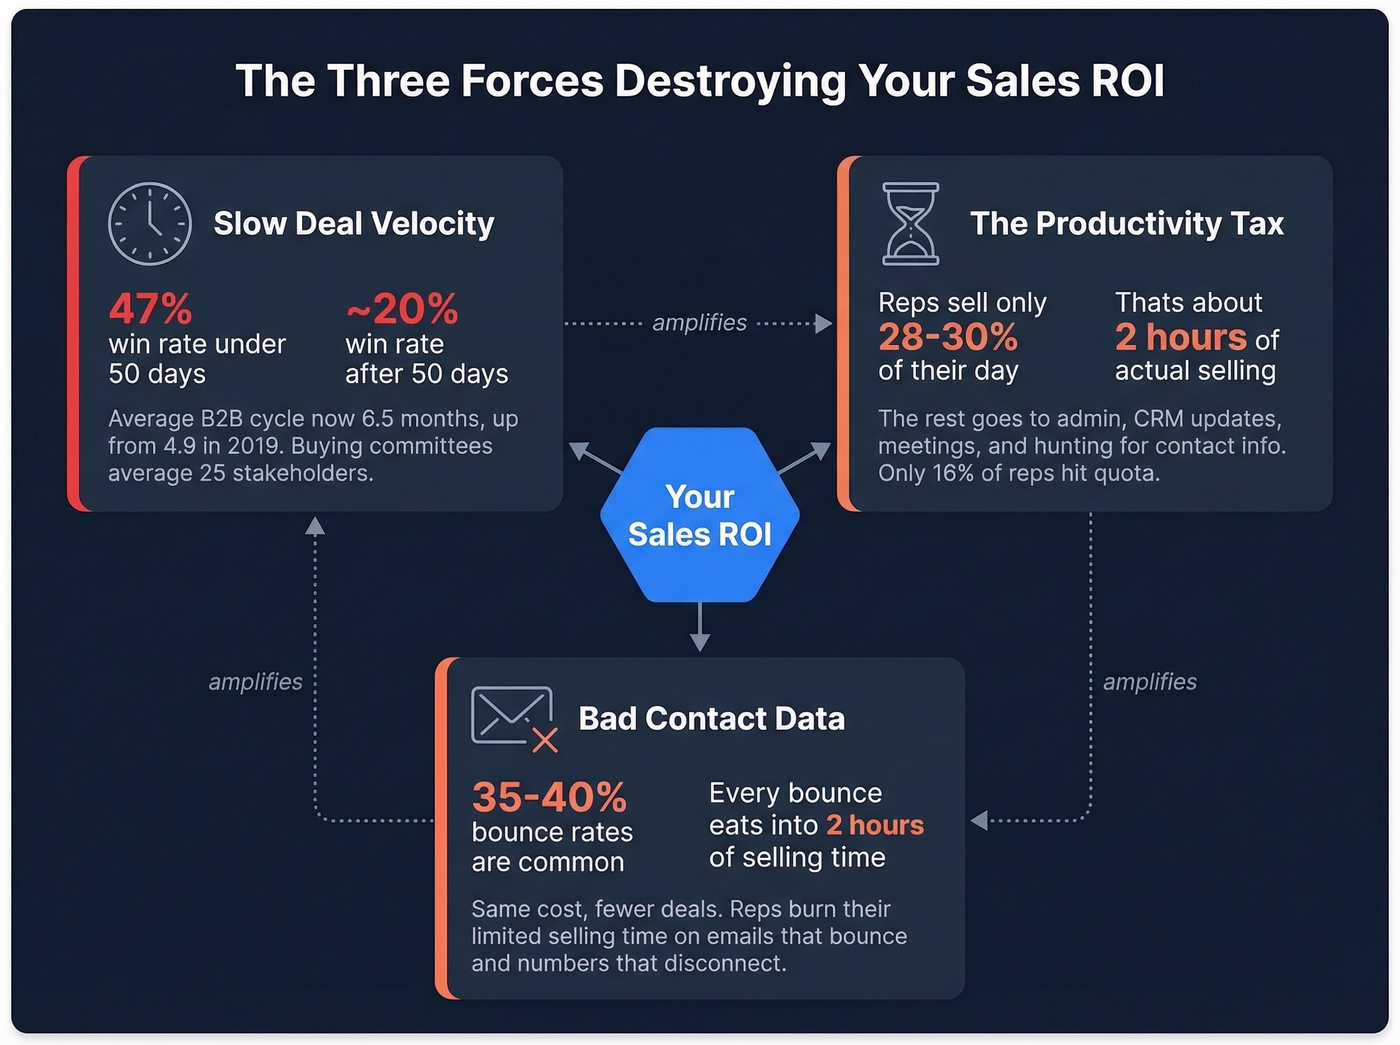
Then there's the productivity tax. Reps spend just 28-30% of their time actually selling - about 2 hours a day. The rest goes to admin, CRM updates, internal meetings, and searching for contact data.
Look, if your reps are spending 70% of their day not selling, no amount of pipeline optimization fixes your numbers. Only 16% of reps hit quota. That number won't budge until the time allocation changes. (This is where sales activities tracking helps.)
Bad contact data quietly amplifies both problems. When reps burn hours on bounced emails and disconnected numbers, they're eating into that precious 2 hours of selling time while the deal clock keeps ticking. Same cost, fewer deals - profitability craters. (If you're seeing this, start with email bounce rate benchmarks and fixes.)
Stop calculating one blended number for your entire team. Break it down by rep, by lead source, by segment. The blended number hides your best performers and your worst investments. If your average deal size is under $10K, you probably can't afford a bloated sales org at all - the math only works with tight processes, clean data, and reps who spend their time on qualified prospects instead of chasing bad numbers. (For segmentation, an Ideal Customer Profile is the fastest starting point.)
Improve Sales ROI This Quarter
Cut Ramp Time
Average ramp for a new rep is 4.5 months - that's 4.5 months of fully loaded cost with minimal output. Teams with a formal coaching process achieve 91.2% of their overall quota, and organizations that actively measure training ROI see 24% higher profit margins. Structured onboarding isn't a nice-to-have. It's the fastest way to compress the most expensive phase of a rep's lifecycle. (A simple 30-60-90 day plan makes ramp measurable.)
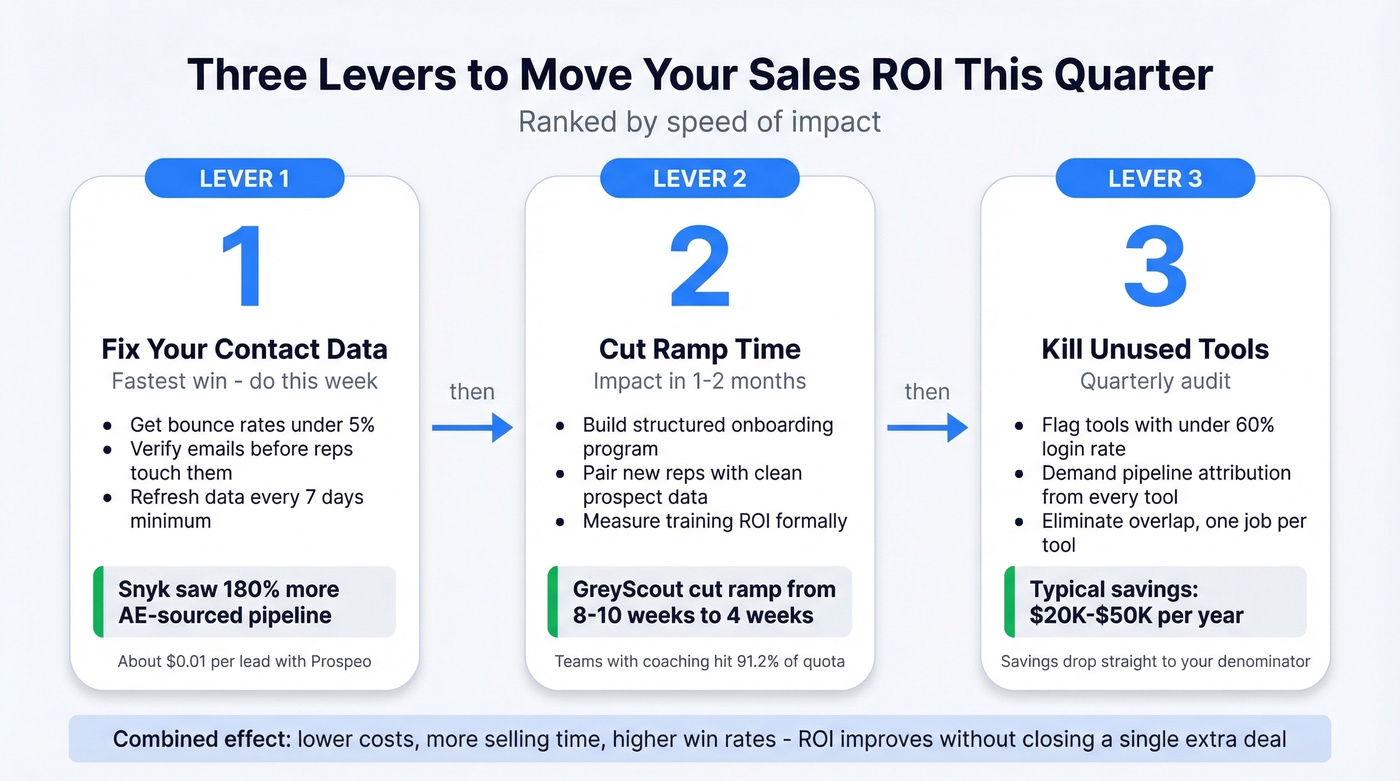
We've seen this firsthand: GreyScout cut rep ramp time from 8-10 weeks down to 4 weeks by pairing structured onboarding with clean, pre-verified prospect data. That's half the ramp cost eliminated before reps even start dialing.
Fix Your Contact Data
If your bounce rate exceeds 5%, your ROI calculation is broken at the input level. Every bounced email equals wasted research time plus a wasted send, and the compounding effect across a 50-person team is brutal. (If you're building outbound lists, use a repeatable lead generation workflow.)
Snyk's 50-person AE team was running bounce rates of 35-40%. After switching to Prospeo for email verification - 98% accuracy, data refreshed every 7 days - bounce rates dropped below 5%, and AE-sourced pipeline jumped 180%. At roughly $0.01 per email with credit-based pricing starting free at 75 emails/month, versus legacy data providers charging $15K-$40K/year, the cost-to-impact math isn't close.
Skip this fix if your bounce rate is already under 3% and your reps aren't complaining about data quality. For everyone else, it's the highest-ROI change you can make this week. (If you’re evaluating options, compare email verification tools.)
Kill Unused Tools
Run this audit quarterly:
- Usage check: Pull login data. If less than 60% of the team used a tool in the last 30 days, flag it.
- Attribution check: Can the tool show pipeline it influenced? No attribution, no justification.
- Overlap check: Two tools doing the same job means one goes.
The average rep uses 10 tools to close deals. 29% say reducing the stack would make them more efficient, and 66% feel swamped by fragmentation. We've seen teams save $20K-$50K/year just by eliminating tools that looked good in the demo but never got adopted past month two. That savings drops straight to your denominator - and your ROI jumps without closing a single extra deal. (If you’re rationalizing your stack, start with your SDR tools list.)
GreyScout cut ramp time in half. Snyk's AE-sourced pipeline jumped 180%. Meritt tripled weekly pipeline from $100K to $300K. The common thread: reps stopped wasting their 2 hours of daily selling time on contacts that bounce, disconnect, or don't exist.
Clean data is the fastest lever to move your sales ROI this quarter.
FAQ
What's a good sales ROI ratio?
3:1 is the survival floor - it means you're barely covering costs. Strong teams target 5:1, and elite reps or top-performing lead sources hit 400-600%. Consistently below 3:1 signals a structural problem: costs too high, win rates too low, or deal sizes that don't support your model.
How is sales ROI different from ROAS?
ROI is profit-based: (Revenue - Cost) / Cost. ROAS is revenue-based: Revenue / Ad Spend. A "3X ROAS" ignores rep salaries, tools, and overhead entirely. Always use ROI for sales team decisions - ROAS belongs in paid media reporting.
How do you improve returns without hiring more reps?
Three high-leverage fixes: reduce ramp time with structured coaching (teams with formal programs hit 91.2% of quota), verify contact data before reps touch it so they aren't wasting sends on bad addresses, and audit your tech stack quarterly to cut tools that can't show attributed pipeline.
Why does my calculated ROI look different from my actual cash flow?
Most teams exclude ramp costs, management allocation, benefits, and tool spend from the denominator. Including all fully burdened costs typically cuts your headline number by 40-60%. Use the full cost checklist above to get an honest calculation.