Sales Team Efficiency: How to Measure & Fix It in 2026
Fewer than 50% of reps have consistently hit quota since 2017. The problem isn't effort - reps spend 60% of their time on non-selling tasks like updating CRM fields, hunting for contact info, and chasing dead phone numbers. Sales team efficiency doesn't break because people are lazy. It breaks because of friction.
Most "sales efficiency" content hands you a formula, a vague benchmark, and tells you to "align sales and marketing." That's not enough. Let's get into how to diagnose what's actually broken and fix the highest-impact pieces first.
The 30-Second Version
1. Sales efficiency = revenue generated per dollar spent on sales. A ratio of 1.0 is breakeven.
2. If your Magic Number is below 0.80, you don't need more reps. You need fewer wasted activities.
3. The single highest-ROI fix? Clean your contact data. Bad emails and dead numbers silently tax every process downstream.
Efficiency vs. Effectiveness vs. Productivity
These three terms get used interchangeably. They shouldn't be.
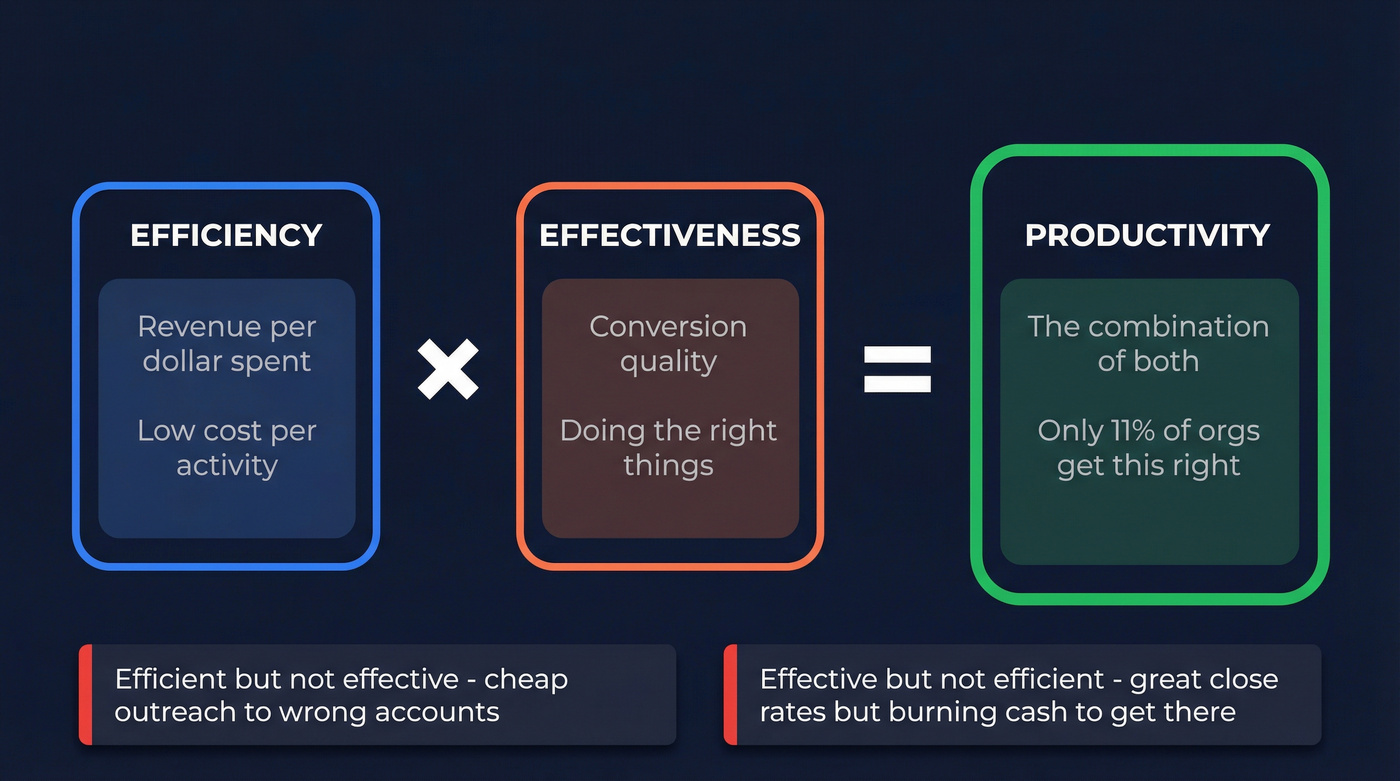
Efficiency is resource allocation - revenue per dollar of sales and marketing spend. Effectiveness is conversion - are reps doing the right things? Productivity is the combination: Productivity = Efficiency x Effectiveness.
You can be efficient (low cost per activity) but ineffective (targeting the wrong accounts). You can be effective (great close rates) but inefficient (burning cash to get there). The goal is both, and that's harder than it sounds. Only 11% of sales orgs successfully drive commercial success while executing transformations, per Gartner. Most teams optimize one dimension while the other collapses.
How to Calculate Sales Efficiency
There's no single formula. Three variants matter depending on what you're measuring.
| Formula | Calculation | When to Use |
|---|---|---|
| Basic | Revenue / S&M costs | Quick health check |
| Gross | New ARR / S&M spend | New business focus |
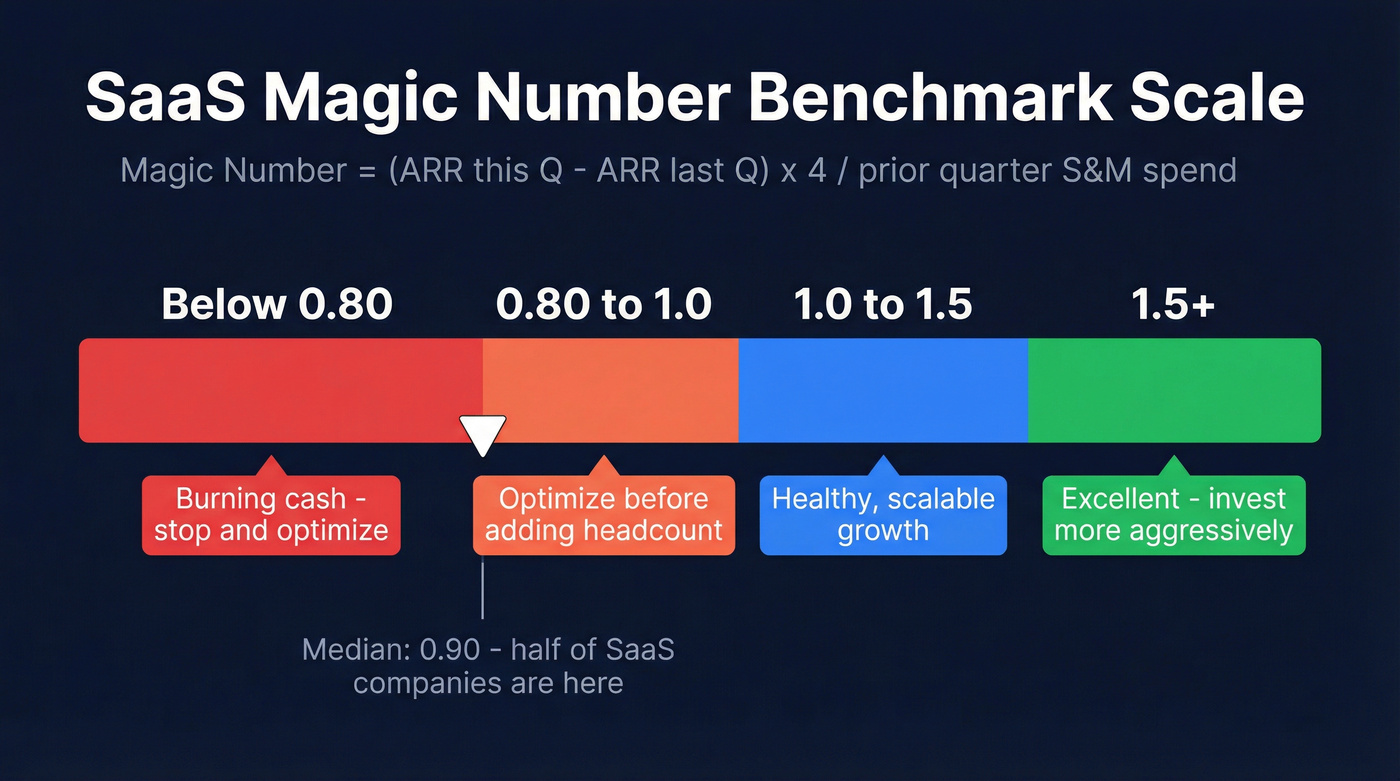
| Magic Number (SaaS) | (ARR this quarter - ARR last quarter) x 4 / prior-quarter S&M | SaaS board reporting |
The Magic Number uses prior-quarter spend because there's a lag between spending and revenue. One quarter of lag is the industry standard. If your cycle runs 6+ months, use a 2-3 quarter lag instead.
Here's the benchmark scale:
- 1.5+ - Excellent. Invest more aggressively.
- 1.0-1.5 - Healthy, scalable growth.
- 0.80-1.0 - Optimize before adding headcount.
- Below 0.80 - You're burning cash.
The median Magic Number was 0.90 in the most recent large-scale survey data. Half of SaaS companies are operating in "fair" territory - generating revenue, but not efficiently enough to scale with confidence.
A Magic Number below 0.80 means you're burning cash - and bad contact data is the silent tax behind it. Prospeo's 98% email accuracy and 7-day refresh cycle eliminate the dead leads that drag down every efficiency metric. Snyk cut bounce rates from 35% to under 5% and grew AE-sourced pipeline 180%.
Stop optimizing processes built on stale data. Fix the foundation.
Benchmarks by Company Stage
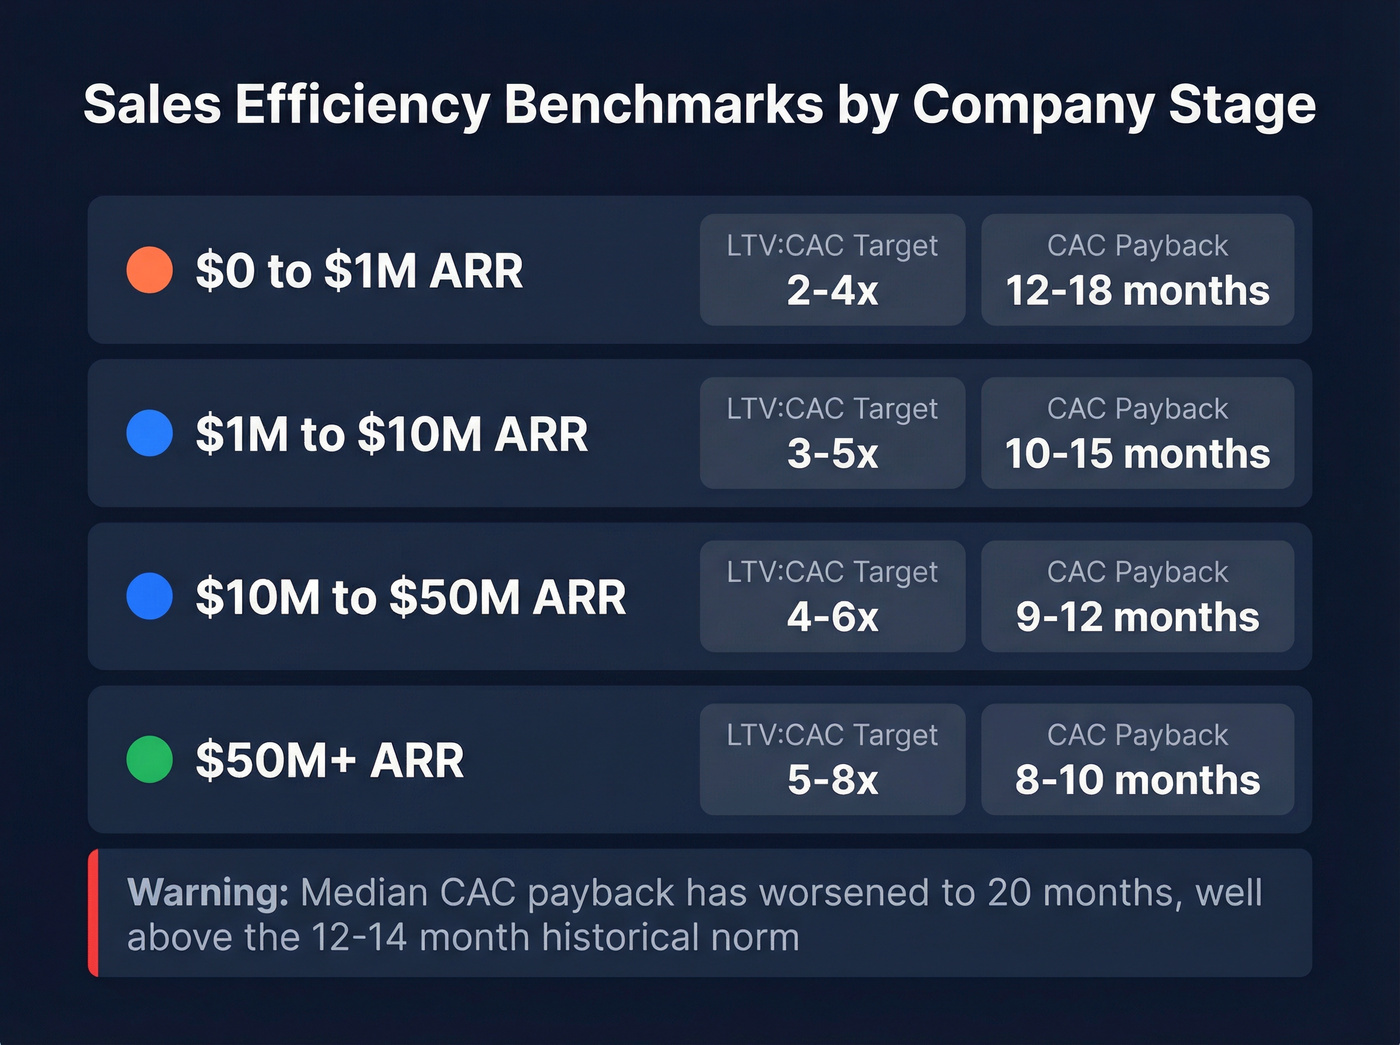
Benchmarks shift dramatically by company stage. A pre-revenue startup and a $50M ARR company shouldn't be measured against the same yardstick.
| ARR Band | LTV:CAC Target | CAC Payback |
|---|---|---|
| $0-$1M | 2-4x | 12-18 months |
| $1-$10M | 3-5x | 10-15 months |
| $10-$50M | 4-6x | 9-12 months |
| $50M+ | 5-8x | 8-10 months |
The uncomfortable trend: median CAC payback has worsened to 20 months - well above the 12-14 month historical norm. The KeyBanc 2026 survey shows recovery signals with ARR growth accelerating from 15% to 20% and gross retention trending back toward 90%, but efficiency pressure isn't going away.
Metrics That Actually Diagnose Problems
Quota attainment is a scoreboard, not a diagnostic tool. Knowing 40% of your team missed quota tells you something's wrong - not what.
The metrics that help you fix things are more granular:
- Revenue per rep hour - are reps spending time on high-value activities?
- Pipeline velocity by stage - where exactly do deals stall? (If you need a deeper framework, start with deal velocity.)
- Activity-to-attainment ratio - working hard but inefficiently, or just not working?
- Lead response time - responding within 5 minutes converts at dramatically higher rates than waiting an hour.
- Revenue per employee - benchmarks run $129K median for private SaaS, $283K for public companies.
The r/salestechniques community frames this well: practitioners want dashboards that feed capacity planning and forecasting, not retrospective reporting. If your metrics don't help you make a forward-looking decision, they're vanity metrics.
How to Improve Sales Team Efficiency
Here's the thing: most guides list 10 strategies. That's part of the problem - teams try all 10 and execute none well. We've narrowed it to four that move the needle, in priority order.
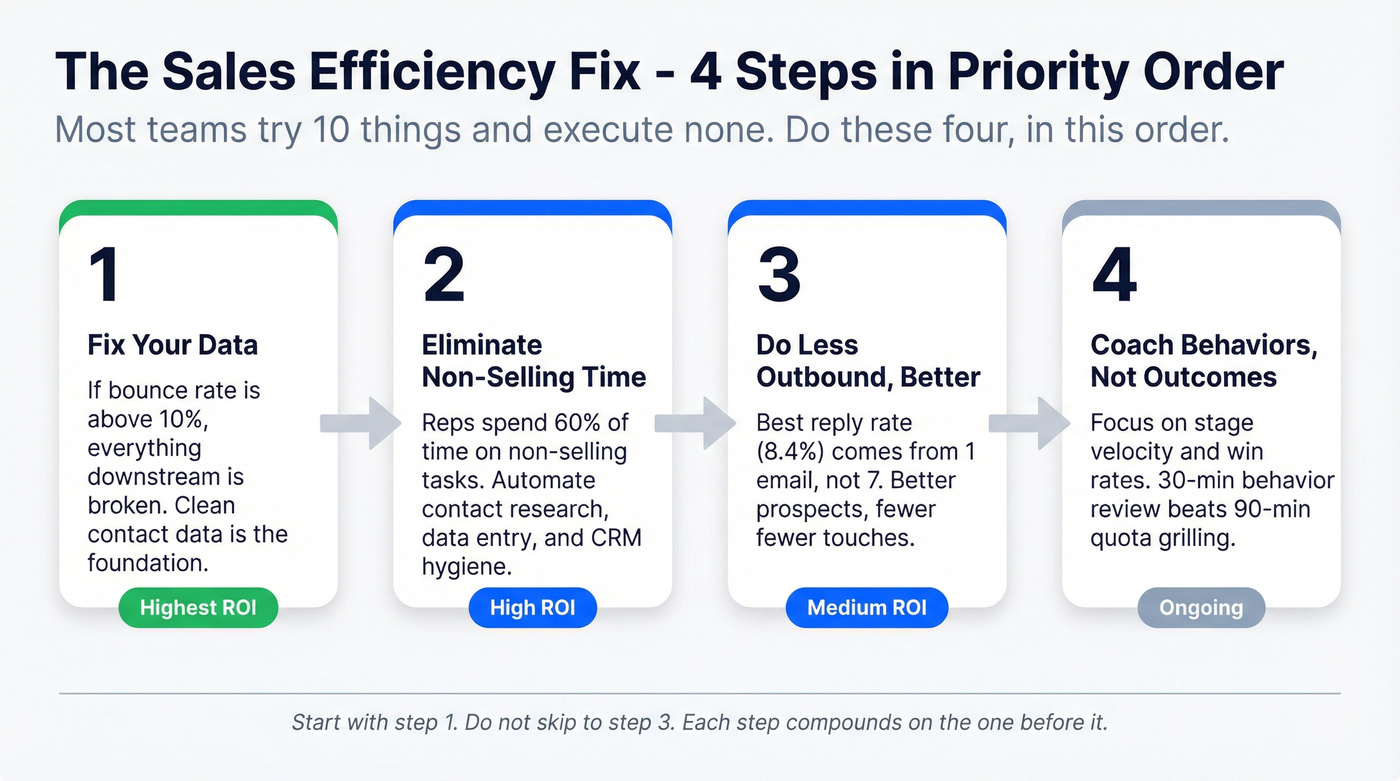
Fix Your Data First
Every process improvement built on bad data is built on sand. If your bounce rate is above 10%, reps waste time on contacts that don't exist. We've watched teams invest in sequencing tools, coaching programs, and CRM workflows while their underlying contact data was stale - and then wonder why nothing improved.
The fastest way to remove blockers for your sales team is to give them accurate information before they ever pick up the phone. Prospeo eliminates this at the source with 98% email accuracy, a 7-day data refresh cycle, and 143M+ verified emails. Snyk's 50-person AE team went from a 35-40% bounce rate to under 5% after switching, and AE-sourced pipeline jumped 180%. That's not a marginal improvement. That's a different business.
Eliminate Non-Selling Time
Reps spend 60% of their time on non-selling tasks. The biggest culprits: contact research, manual data entry, and CRM hygiene.
AI-driven automation is accelerating this shift - 67% of SaaS companies are already monetizing AI capabilities, and more than half plan to increase AI spend by over 21% this year. Tools that auto-enrich CRM records, draft outbound sequences, and surface intent signals remove manual work from every rep's week. If you want to audit where hours go, start by tracking how long reps spend just finding someone to call. Automate everything that isn't a conversation.
Do Less Outbound, Better
A Belkins study of 16.5M cold emails found the highest reply rate - 8.4% - came from a single email. Not a 7-touch sequence. One email.
Sending 4+ follow-ups more than triples unsubscribe and spam complaint rates. Real talk: sending that many follow-ups doesn't show persistence. It shows you don't have enough good leads. The efficiency play isn't more touches per prospect - it's better prospects with fewer touches. If you want to tighten your cadence without tanking deliverability, use a proven outbound sales playbook. With more than half of large B2B transactions now processed through digital self-serve channels, the old "pound the phones" playbook is actively working against you.

Coach Behaviors, Not Outcomes
Stop running weekly pipeline reviews that are just quota interrogations. Focus on stage velocity and win rates as coaching inputs. Where are deals stalling? Which reps convert discovery calls at 60% but lose deals at proposal?
Sales enablement strategies that focus on behavior-level coaching report 25-30% faster deal cycles. A weekly 30-minute review focused on pipeline velocity beats a 90-minute grilling every time. Skip this approach if your team is under 5 reps - at that size, you're better off sitting in on calls directly and giving real-time feedback. (For a full system, see how to coach salespeople.)
Common Mistakes That Kill Efficiency
One Reddit thread captures the anti-pattern perfectly: a company rolled out CRM with GPS tracking, and leadership became "hostile and distrustful" - increasing pressure despite the team hitting numbers. The CRM became a surveillance tool, not a productivity tool. Morale tanked.
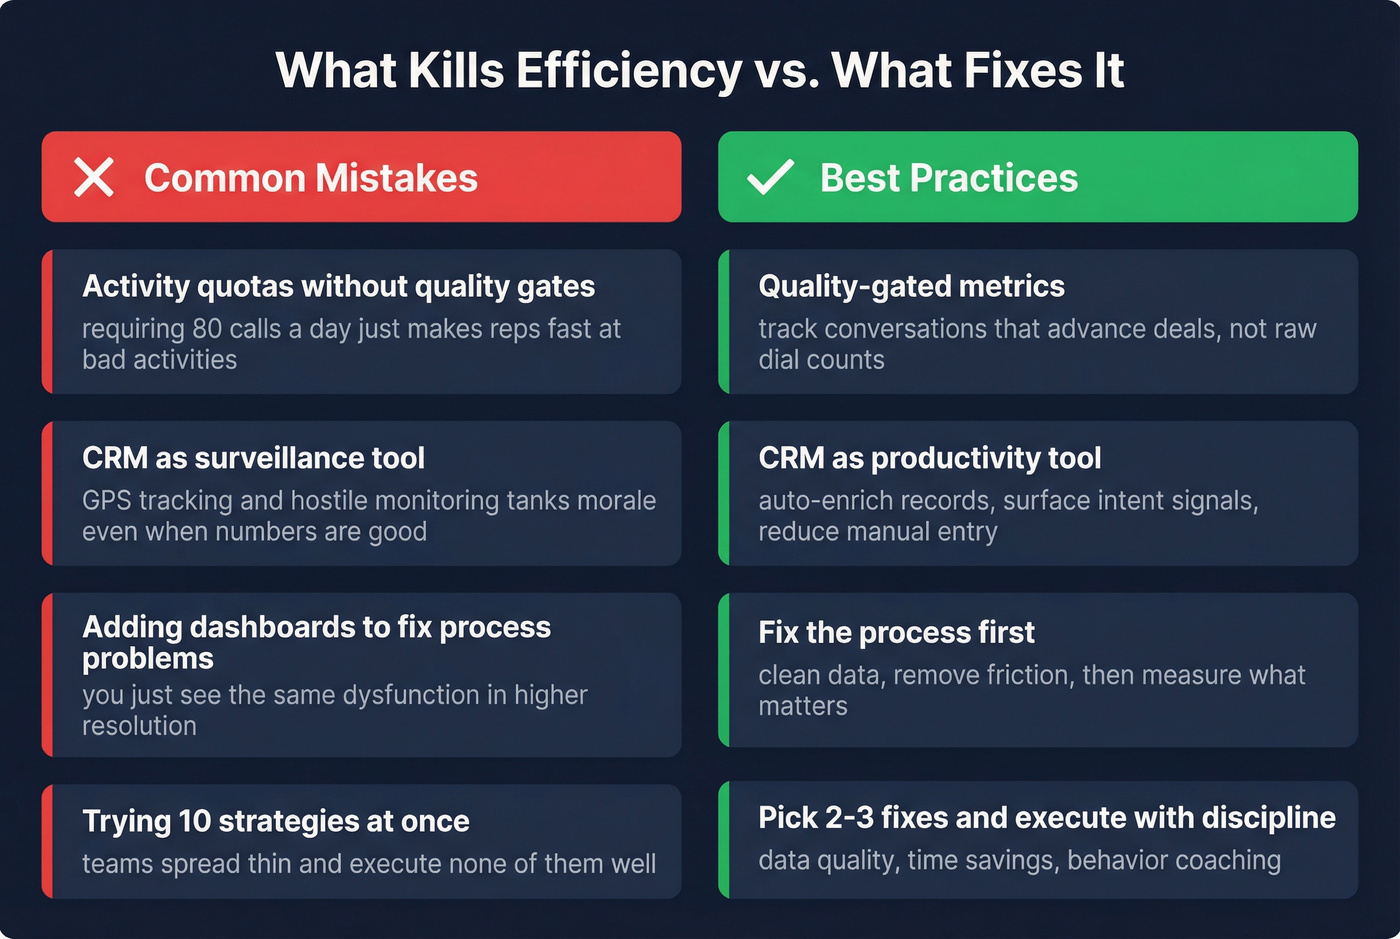
Activity quotas without quality gates are the same trap. Requiring 80 calls/day doesn't make reps efficient - it makes them fast at bad activities. And adding another dashboard won't fix a systems problem. In our experience, teams that try to solve process problems with reporting just see the same dysfunction in higher resolution.
Most teams don't need 10 strategies. They need 2-3 executed with discipline. Start with data quality. Layer in time savings. Coach on behaviors. That's it. (If you want a clean measurement layer, build a sales scorecard before you add more dashboards.)
Reps spend hours hunting for contacts instead of having conversations. Prospeo's 143M+ verified emails and 125M+ direct dials mean your team prospects in minutes, not hours - at $0.01 per email. That's how you shift from 40% selling time to 80%.
Give every rep their non-selling hours back starting this week.
FAQ
What's a good sales efficiency ratio?
A Magic Number of 1.0+ means you generate more new ARR than you spend on sales and marketing - that's healthy, scalable growth. Above 1.5 signals you should invest more aggressively. Below 0.80 means you're burning cash and should optimize before adding headcount.
How is efficiency different from productivity?
Efficiency measures output per dollar spent. Productivity combines efficiency with effectiveness - doing the right things fast and cheaply. You can be highly efficient but unproductive if you're fast at the wrong activities.
What's the fastest way to improve sales team efficiency?
Fix your contact data. If your bounce rate exceeds 10%, every downstream process is built on a broken foundation. Snyk cut bounces from 35% to under 5% and grew pipeline 180% after cleaning up their data source - that kind of improvement compounds across every rep, every day.