Sales Win Rate: How to Calculate, Benchmark, and Improve It
Three managers walk into a QBR with three different win rates. One says 18%. Another says 34%. The third - who's been quietly excluding no-decision deals - proudly reports 47%. Same quarter, same CRM, same pipeline.
The average B2B sales win rate sits around 21%, and enterprise ACV >$100K win rates fell from roughly 26% to 17% in late 2022/early 2023. But that number is meaningless if you're measuring it wrong. Stop obsessing over the number and start obsessing over your denominator.
The Short Version
- Most B2B sales orgs report win rates between 16% and 30%. Only 13% of teams hit 40%+.
- If you're consistently above 25%, you're outperforming the market.
- Three biggest levers: disqualify faster (shrink the denominator), multi-thread every deal (3+ contacts = 2.4x win rate), and clean your contact data so your pipeline isn't full of ghosts.
What Is Sales Win Rate?
Win rate is the percentage of opportunities you win out of all opportunities that reached a decision - won or lost. The formula: won deals / (won deals + lost deals) x 100. It's the single best metric for forecasting accuracy and pipeline planning because it tells you how efficiently your team converts real opportunities into revenue.
Here's the thing, though. A blended rate across your entire org is a vanity metric. A 22% figure that mixes $8K SMB deals with $150K enterprise contracts tells you almost nothing. Segment by deal size, rep, source, and sales cycle length - or the number is just noise in a dashboard nobody trusts.
How to Calculate It
The Basic Formula
Won / (Won + Lost) x 100 = Win Rate %
Say your team closed 18 deals last quarter and lost 62. That's 18 / 80 = 22.5%. Simple enough. The complexity comes from which formula variant you're using - the same dataset produces wildly different numbers depending on how you count.
Three Formula Variants
| Variant | Formula | Best for |
|---|---|---|
| By count | Won / (Won + Lost) | Rep performance |
| By revenue | $ Won / ($ Won + $ Lost) | Forecasting |
| SQL-based | Won / All SQLs created | Funnel efficiency |
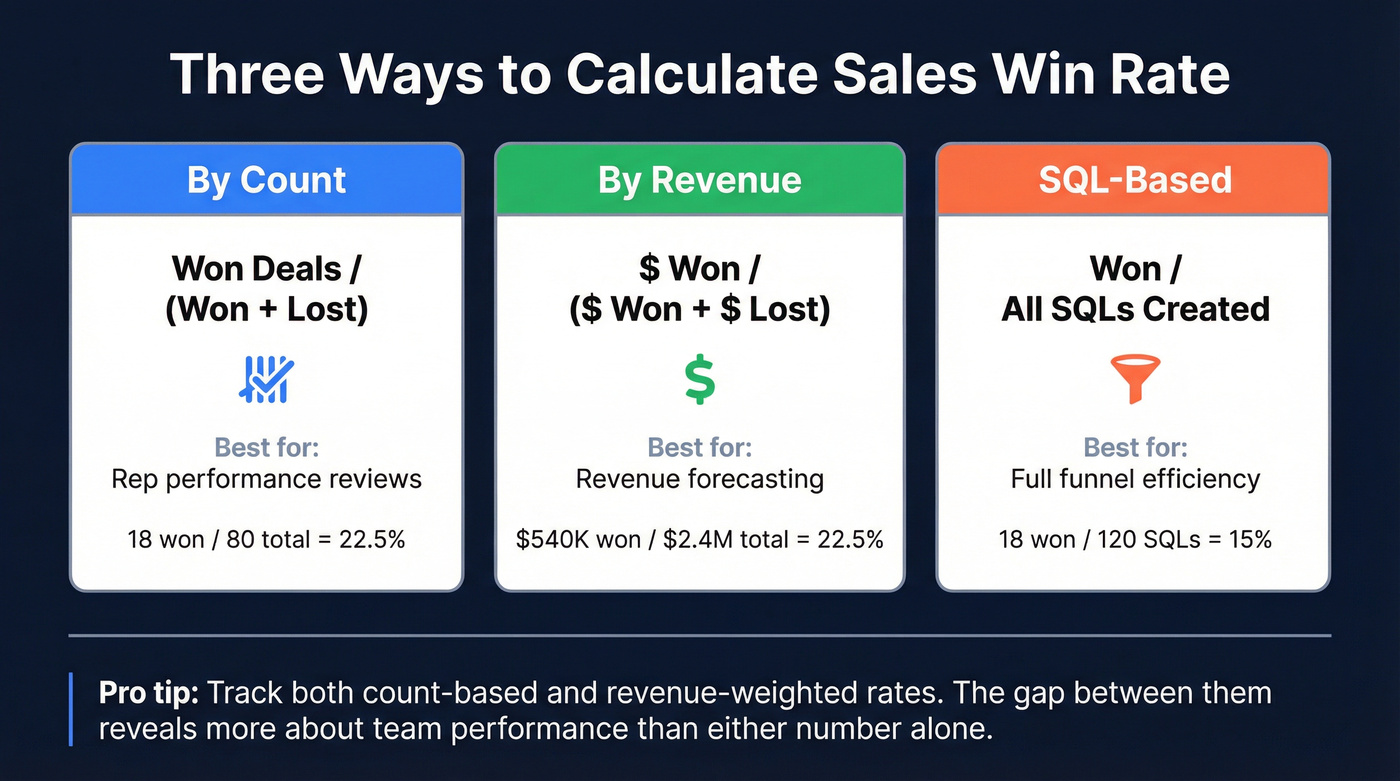
Your top rep wins 45% of deals by count, but they're mostly $12K contracts. A newer rep wins just 12% by count - yet their average deal is $85K, and their revenue-weighted rate is actually higher. If you're only tracking count-based metrics, you're rewarding velocity over value. Most mature orgs track both, and the gap between the two numbers often reveals more about team performance than either metric alone.
Win Rate vs Close Rate
These two get used interchangeably, and it causes real problems in pipeline reviews. The difference is the denominator.
| Metric | Numerator | Denominator | Typical range |
|---|---|---|---|
| Win rate | Closed-won | Closed-won + Closed-lost | 15-30% (B2B) |
| Close rate | Closed-won | All SQLs or all opps | Varies widely |
Win rate only counts decided opportunities. Close rate includes everything in the funnel - open deals, stalled deals, deals gathering dust since last quarter. The same 18 wins from a pipeline of 120 total opportunities gives you a 15% close rate but a 22.5% win rate if 62 were closed-lost and 40 are still open. Mix them up in a forecast and you'll wreck your accuracy.
For context, top-of-funnel conversion rates range from 0.9% for paid social to 3.8% for ABM](https://firstpagesage.com/reports/conversion-rate-by-channel/) - a completely different metric. Gong found that missing the "next steps" question in discovery calls correlates with a 71% decline in close rates. Process discipline shows up in the numbers.
Multi-threading 3+ contacts per deal delivers 2.4x higher win rates - but only if those contacts are real. Prospeo's 98% verified emails and 125M+ direct dials mean your reps reach actual decision-makers, not bounced inboxes and voicemail boxes.
Stop losing deals to bad data. Start reaching the buying committee.
2026 Win Rate Benchmarks
Every benchmark article cites a different number - 21%, 47%, 50% - without explaining they're using completely different definitions. Let's fix that.
Overall B2B Benchmarks
The most defensible average is around 21%, based on compiled industry data from HubSpot's Sales Trends report. Most orgs fall between 16-30%, and only 13% of teams crack 40%+.
You'll see sources like PandaDoc cite 45-50% as a "good" win rate. That number isn't wrong - it's measuring something different. Those figures come from orgs that aggressively disqualify early and only count highly vetted opportunities. If your definition of "opportunity" is loose, your rate will be low. Tight definition, high rate. The metric is only useful when the definition stays consistent quarter over quarter.
As a rough industry guide: SaaS mid-market typically runs 15-25%, professional services 25-40%, and manufacturing 10-20%. At the enterprise extreme, complex deals with long buying committees can push rates down to 5-10%. That's not a failure. It's the math of selling $200K+ contracts to 12-person committees.
Benchmarks by Deal Size
The Optifai Pipeline Study (939 B2B SaaS companies, Q1-Q3 2025 deal-level CRM data) provides the cleanest ACV segmentation we've found. These ranges represent the 25th-75th percentile:
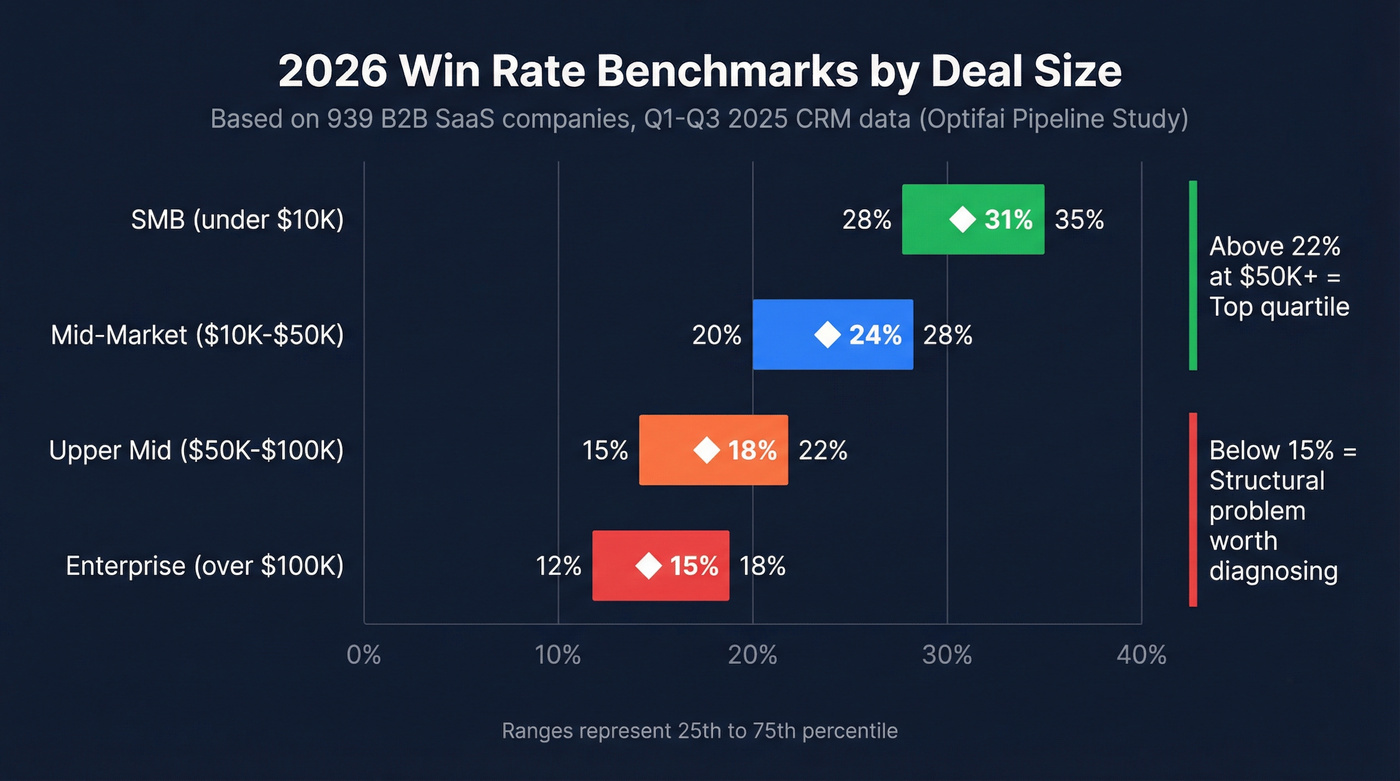
| ACV Segment | Win Rate Range | Median |
|---|---|---|
| SMB (< $10K) | 28-35% | 31% |
| Mid-Market ($10-50K) | 20-28% | 24% |
| Upper Mid ($50-100K) | 15-22% | 18% |
| Enterprise (> $100K) | 12-18% | 15% |
If you're selling $50K+ deals and your win rate is above 22%, you're in the top quartile. Below 15% means there's a structural problem worth diagnosing - and predicting outcomes accurately at this tier requires clean, stage-by-stage pipeline data.
Win Rate by Cycle Length
Speed matters more than most teams realize. Opportunities closed within 50 days show a 47% deal success rate; after 50 days, that drops to 20% or lower. Deals don't age like wine - they age like milk.
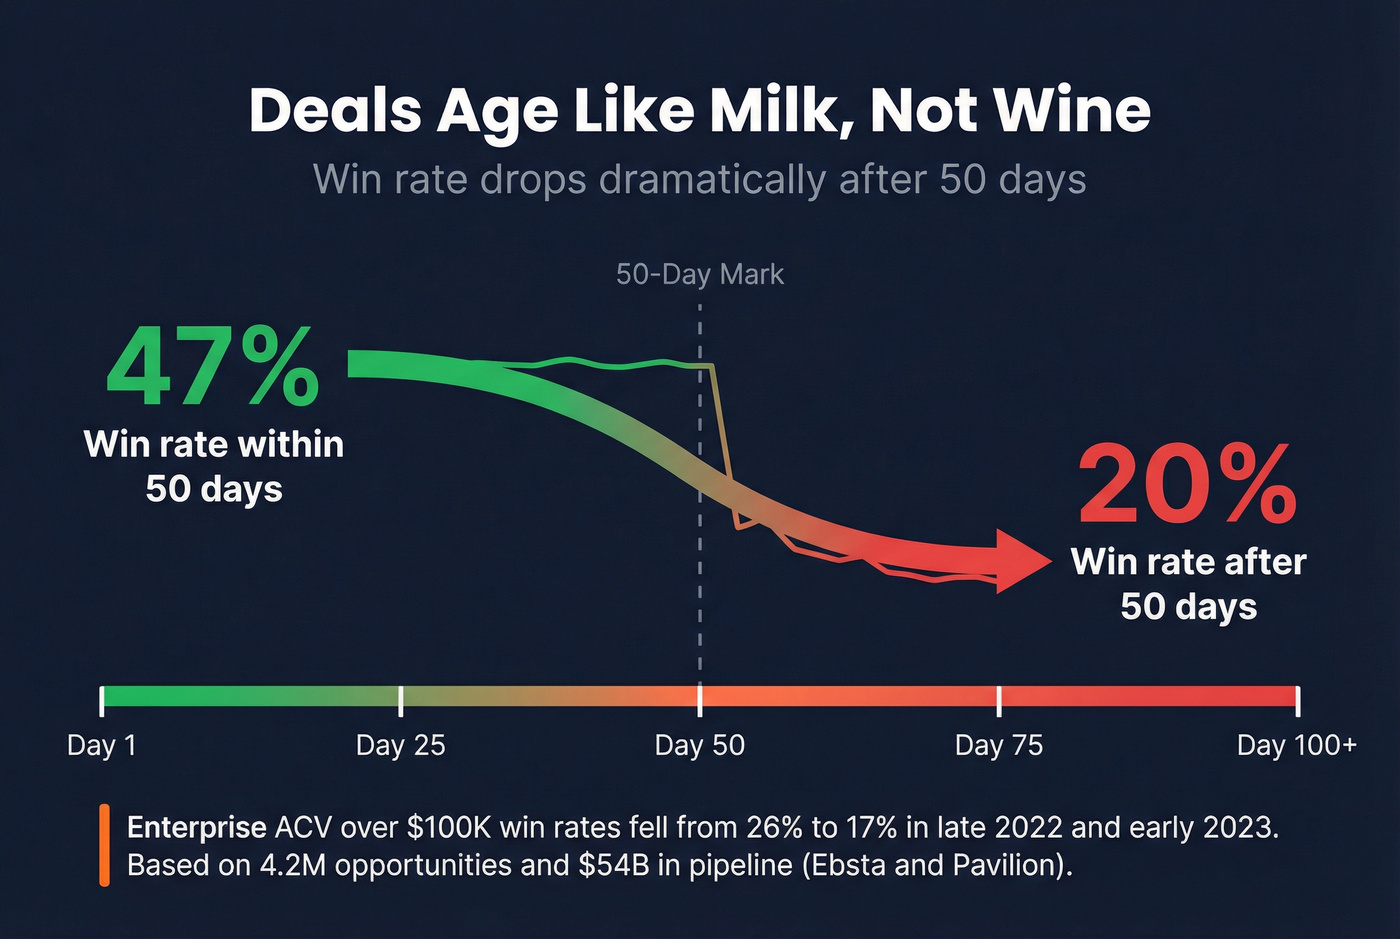
Ebsta and Pavilion's analysis of 4.2M opportunities and $54B in pipeline showed enterprise ACV >$100K win rates fell from roughly 26% to 17% in late 2022/early 2023. They've stabilized since, but the era of easy enterprise closes is over.
Why Your Win Rate Is Probably Wrong
Roughly 80% of CRM data is inaccurate, and 70% of revenue leaders don't trust their own CRM data. If your foundation is rotten, the metrics built on top of it are meaningless.
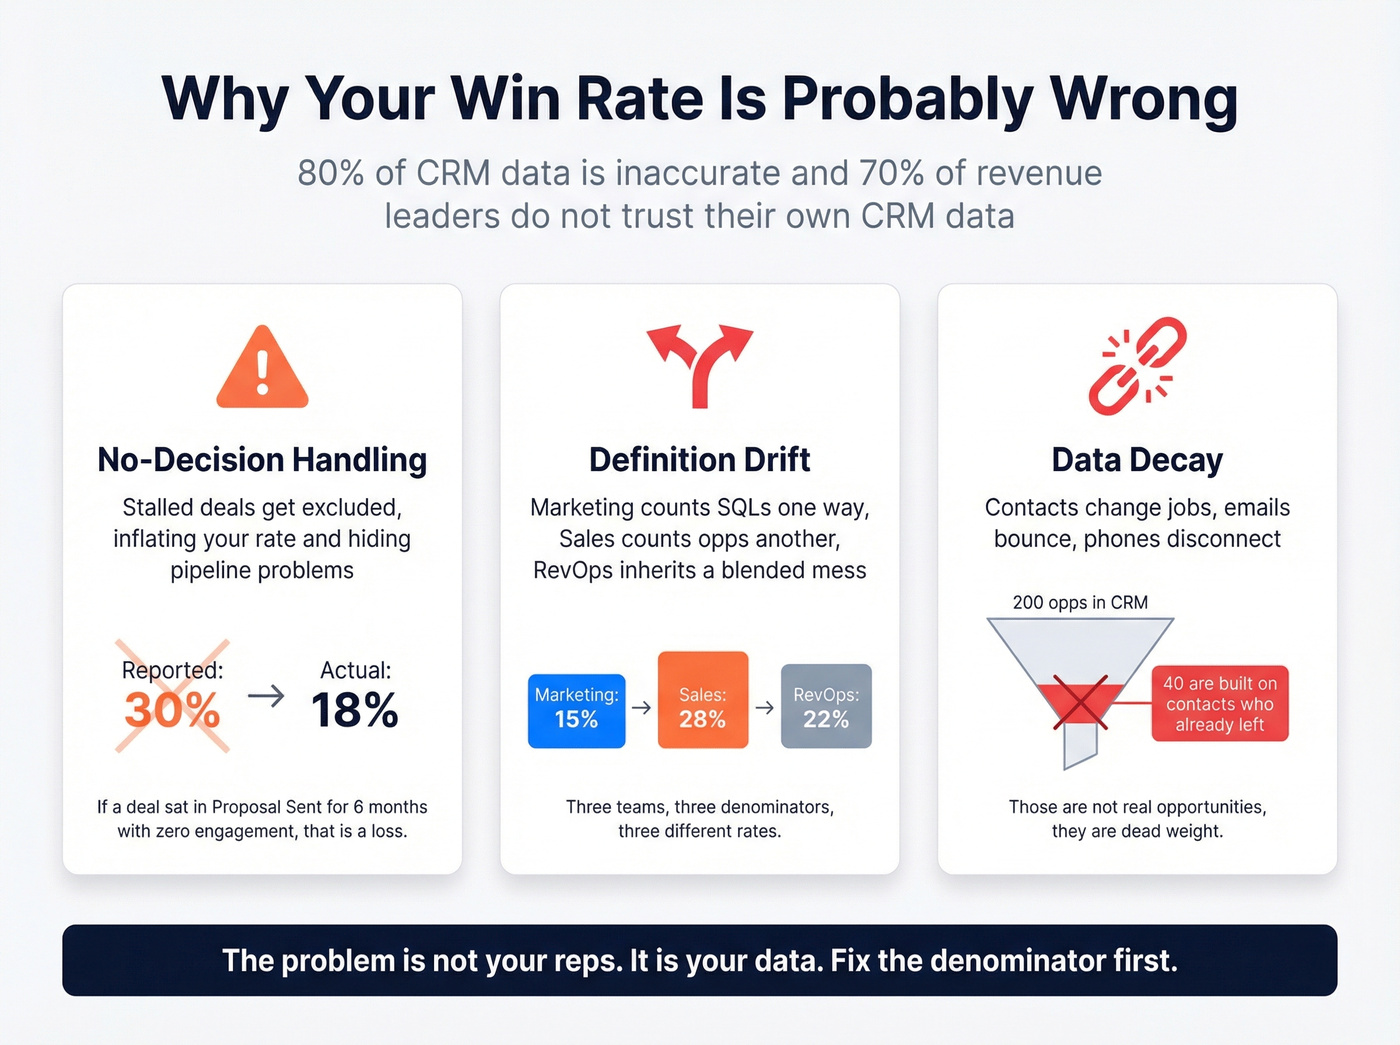
Three distortions show up in almost every pipeline review we've seen:
No-decision handling. Teams exclude stalled deals, which inflates the number and hides pipeline problems. This is one of the most heated debates among RevOps practitioners - and the right answer is clear. If a deal has been sitting in "Proposal Sent" for 6 months with zero engagement, that's a loss. Count it as one.
Definition drift. Marketing counts SQLs one way, sales counts opportunities another, and RevOps inherits a blended mess. Three teams, three denominators, three different rates.
Data decay. Contacts change jobs, emails bounce, phone numbers disconnect. Your CRM says you have 200 active opportunities, but 40 of them are built on contacts who left the company two months ago. Those aren't real opportunities - they're dead weight inflating your denominator.
Teams with low win rates often discover the problem isn't their reps. It's their data. Fixing the denominator is the fastest path to an accurate picture.
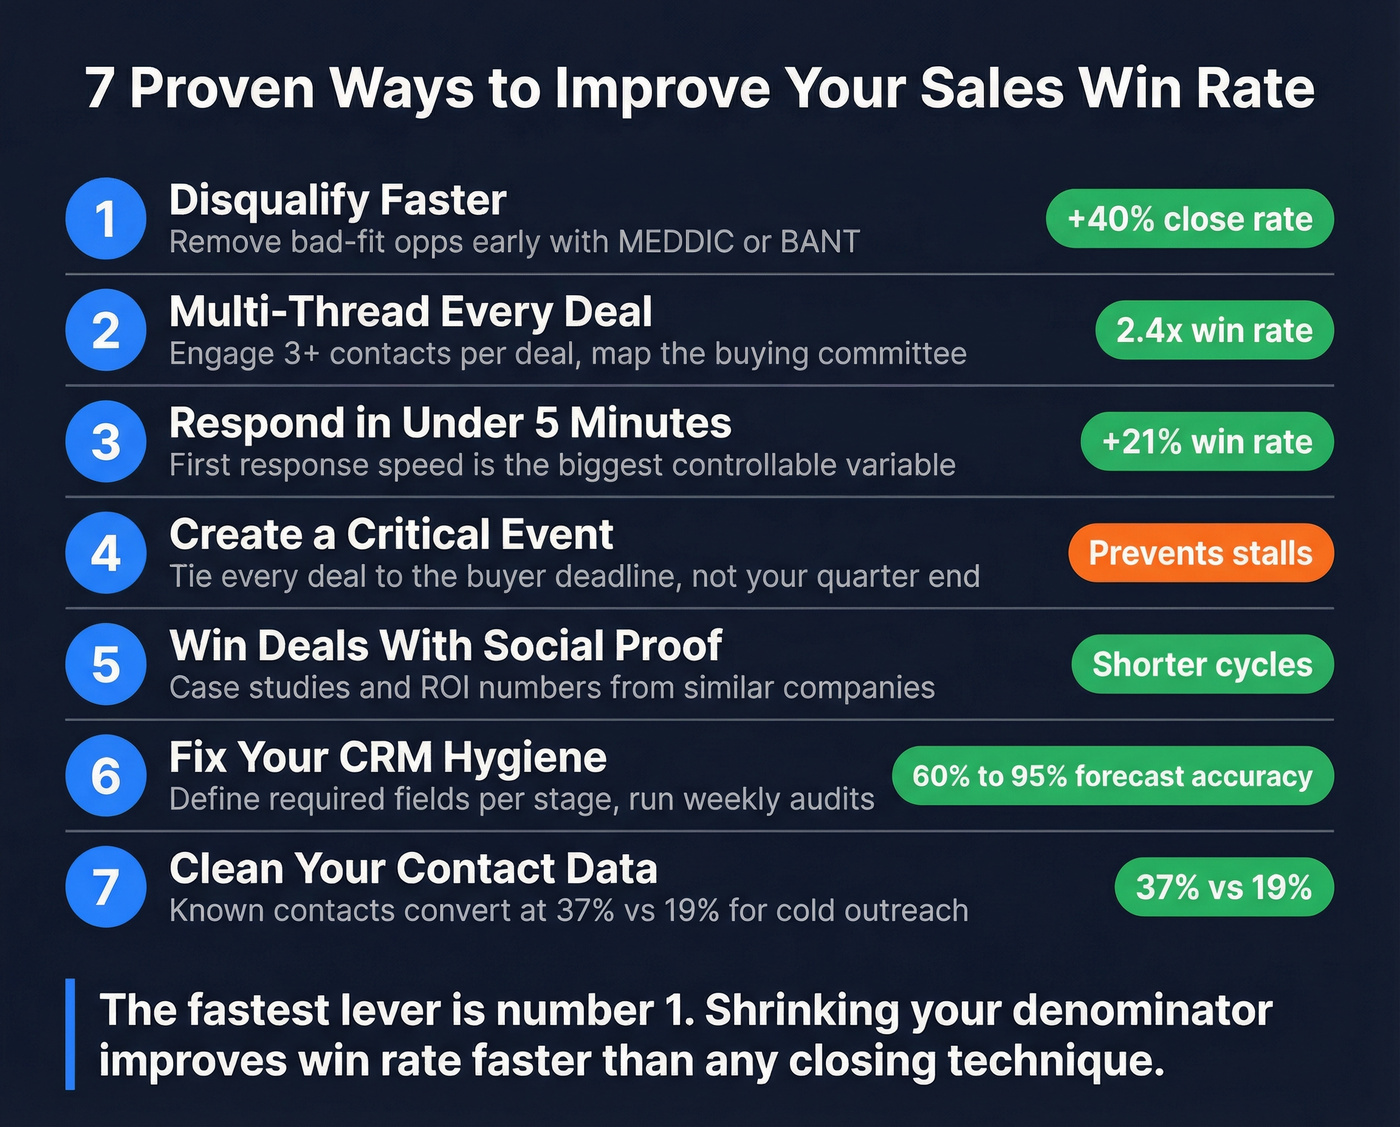
7 Ways to Improve Your Win Rate
1. Disqualify Faster
This is the lever nobody wants to pull. Shrinking your denominator by removing bad-fit opportunities earlier will improve your close ratio faster than any closing technique. Deals over $50K should get a MEDDIC or BANT qualification pass - teams that do this consistently see 40% higher close rates. It feels counterintuitive to kill pipeline, but a smaller, cleaner pipeline converts better and forecasts more accurately, especially on a smaller team where every rep-hour counts.
Look, if your average deal is under $15K, you probably don't need a 12-step qualification framework. A two-question gut check - "Do they have budget?" and "Is there a deadline?" - will get you 80% of the way there. Save MEDDIC for the deals that justify the overhead.
2. Multi-Thread Every Deal
Deals with 3+ contacts engaged close at 2.4x the rate of single-threaded deals. For enterprise, that jumps to 3.1x. Map the buying committee in discovery - champion, economic buyer, technical evaluator - and build relationships with all of them.
Single-threading is the #1 reason deals die in the dark. You're dependent on a single champion who might leave, lose internal influence, or just get busy with something else. In our experience, the teams that consistently win above 25% treat multi-threading as a non-negotiable pipeline hygiene step, not a nice-to-have.
3. Respond in Under 5 Minutes
First response time under 5 minutes correlates with 21% higher win rates. After 24 hours, they drop 60%. That's not a gradual decline - it's a cliff.
If your SDR team takes a day to respond to inbound, you're losing deals before they start. Outbound follow-up follows the same pattern: the faster you act on engagement signals, the more deals you close.
4. Create a Critical Event
Every deal needs a business reason the buyer must act by a specific date. Not your quarter-end - their deadline. A Canva strategic accounts leader calls this the "critical event": a regulatory change, a contract expiration, a board meeting, a product launch. Reference it in every follow-up. Deals without urgency don't close - they stall, and stalled deals are where win rates go to die.
5. Win Deals With Social Proof
Buyers trust peers more than reps. Case studies, customer logos, and specific ROI numbers from similar companies reduce perceived risk and shorten sales cycles. A well-placed customer quote in your sales presentation can lift close rates significantly, especially when the reference matches the prospect's industry and deal size. Social proof is particularly powerful when you're competing as an underdog against a larger, better-known vendor - it neutralizes the "nobody got fired for buying [Big Vendor]" objection.
6. Fix Your CRM Hygiene
Define 3-5 non-negotiable fields per pipeline stage. Run weekly rep self-audits, biweekly manager spot checks, and monthly RevOps audits for duplicates and stale deals.
One Series B SaaS company (25 reps) improved forecast accuracy from 60% to 95% in 8 weeks after implementing this cadence. Stale deals dropped 40% and managers reclaimed 25% more coaching time. Clean CRM data isn't just about accuracy - it's the foundation for every pipeline metric you care about.
7. Clean Your Contact Data
Known contacts convert at 37% versus 19% for cold outreach. Bad emails and disconnected phone numbers inflate your denominator with dead opportunities that were never real to begin with.
This is frustrating because it's so fixable. Prospeo runs a 7-day data refresh cycle with 98% email accuracy across 143M+ verified addresses, so reps work contacts that actually exist. One customer, Snyk, saw AE-sourced pipeline jump 180% after cutting bounce rates from 35-40% to under 5%. Skip this step if your bounce rates are already under 3% - but if they're not, data quality is the highest-ROI fix available.
Bonus: Run Win-Loss Reviews
Review your losses, not just your wins. Pattern-match across deal stage, objection type, competitor involvement, and buying committee composition. Most teams only celebrate closed-won and ignore the 75-80% of deals that didn't make it. That's where the real intelligence lives - the consensus on r/sales is that structured loss reviews are the single most underused coaching tool in B2B, and we'd agree.
Pipeline Planning With Win Rate
Every RevOps leader needs this formula within arm's reach:
Quota / Avg Deal Size / Win Rate = Required Opportunities
Example: $1M annual quota, $50K average deal size, 20% win rate. That's $1M / $50K / 0.20 = 100 opportunities needed in your pipeline. If your rate is actually 15% because your data is stale, you need 133 - and you won't know you're short until it's too late. To close more B2B deals without simply adding headcount, tighten qualification and improve data quality. The math takes care of the rest.
Data decay is silently destroying your win rate. Contacts change jobs, emails bounce, and your pipeline fills with ghosts. Prospeo refreshes 300M+ profiles every 7 days - not the 6-week industry average - so your CRM reflects reality, not last quarter's org chart.
Clean pipeline data closes more deals. Start at $0.01 per email.
FAQ
Is 20% a good sales win rate?
For B2B SaaS mid-market deals ($10-50K ACV), 20-28% is the normal range with a median around 24%. Enterprise deals above $100K typically land between 12-18%. Always segment by deal size before benchmarking - a blended number across segments is misleading.
Should I include no-decision deals in my win rate?
Yes. Excluding stalled deals inflates your number and hides pipeline problems. Count any opportunity with zero engagement for 2x your average sales cycle length as a loss. That gives you an honest baseline to improve from.
What's the difference between win rate and close rate?
Win rate measures closed-won deals against all decided opportunities (won + lost). Close rate divides closed-won by all opportunities including open deals. The same 18 wins can be a 22.5% win rate but a 15% close rate depending on which denominator you use.
How can I improve a low win rate quickly?
Start with the denominator. Disqualify bad-fit deals earlier using MEDDIC or BANT, multi-thread with 3+ contacts per opportunity, and clean your contact data so your pipeline reflects reality. These three changes alone can lift results 30-50% within two quarters.