
Waterfall Pricing: How to Find (and Fix) Hidden Margin Leakage
Your CFO just asked why gross margins are 42% but net margins are 28%. You checked the P&L. You checked COGS. Everything looks right - until you realize fourteen percentage points are leaking through discounts, rebates, freight allowances, and payment terms that nobody's tracking in one place.
That gap has a name: the pricing waterfall.
Understanding waterfall pricing is the first step to fixing it. Bain & Company's research shows companies that master it outperform peers by 5-11 percentage points in profit margin. That's not a rounding error - it's the difference between a healthy business and one that's slowly bleeding out.
What Is a Pricing Waterfall?
Definition and Key Terms
A pricing waterfall is a visual framework that tracks every deduction applied to a product's list price until you arrive at the actual cash your company retains - the pocket price. Each step down represents a discount, rebate, allowance, or cost that chips away at your net price realization.

The terminology matters because different teams use different words for the same concepts:
- List price - the published or catalog price before any adjustments. Your starting point.
- Invoice price - what the customer actually sees on the invoice after on-invoice discounts (volume breaks, promotional pricing, customer-specific deals). Most companies stop their analysis here. That's the mistake.
- Pocket price - the real number. Invoice price minus all off-invoice deductions: rebates, freight allowances, payment terms costs, co-op marketing funds, warranty expenses, technical support. This is what you actually pocket.
- Pocket margin - the final profitability metric: (Pocket Price - Cost) / Pocket Price. This is the number that tells you whether a customer is actually profitable.
The gap between invoice price and pocket price is where margin dies quietly. Pocket price runs 20-30% below invoice price for most B2B companies, and off-invoice leakages can eat up to 33% of list price.
Origin: McKinsey and the Pocket Price Concept
The pricing waterfall isn't new. Michael V. Marn and Robert L. Rosiello of McKinsey introduced the "pocket price" concept in their 1992 Harvard Business Review article, Managing Price, Gaining Profit. Their insight was deceptively simple: companies obsess over list prices and invoice prices but almost never calculate what they actually keep.
They later expanded the framework in The Price Advantage (co-authored with Craig Zawada), which remains the definitive text on the subject. The core argument hasn't changed in three decades: if you don't measure pocket price, you can't manage profitability. You're flying blind.
Here's the thing - thirty-plus years later, most mid-market companies still don't track pocket price. An estimated 60% of companies under $200M in revenue rely on spreadsheets or gut feel for pricing decisions, with no systematic view of where margin actually goes.
Why Price Waterfall Analysis Matters in 2026
The pricing waterfall isn't a strategy. It's a diagnostic tool. And in 2026, the diagnosis is more urgent than ever.

Three forces are compressing margins simultaneously. First, inflation and supply chain instability haven't gone away - they've become the new normal. Input costs shift faster than pricing teams can react, and every month of lag between a cost increase and a price adjustment is margin left on the table. Companies that still run annual pricing reviews are essentially donating profit to their supply chain.
Second, channel complexity is exploding. Global omnichannel retail is projected to grow 14% by 2030, which means more pricing touchpoints, more discount structures, and more places for margin to leak. If you're selling through distributors, direct, and digital channels, each one has its own gross-to-net waterfall - and they rarely look the same.
Third, brand loyalty dropped roughly 25% in 2025. Customers switch faster, which means sales teams discount harder to retain them. Those retention discounts accumulate in the waterfall, and nobody's checking whether they're actually working.
The companies that outperform by 5-11 percentage points in profit margin aren't doing anything exotic. They're just measuring what everyone else ignores. They know their pocket price by customer, by product, by channel. They know which discounts drive revenue and which ones just leak margin.
If you can't tell me your pocket margin for your top 10 accounts right now, you're probably leaving 2-5 percentage points of margin on the table. That's the typical improvement companies see after their first waterfall analysis.
You're hunting margin leaks in your pricing waterfall - but what about your sales pipeline? Bad contact data burns budget just like hidden rebates burn margin. Prospeo's 98% email accuracy and 5-step verification eliminate the bounce-rate tax that silently erodes your outbound ROI.
Stop leaking pipeline dollars on unverified emails at $1/lead.
Anatomy of a Pricing Waterfall - Step-by-Step Breakdown
Let's make this concrete. Here's a worked example that traces a $100 list price down to what you actually keep.
| Step | Amount | Running Total |
|---|---|---|
| List Price | $100.00 | $100.00 |
| Invoice Discount | -$15.00 | $85.00 |
| Invoice Price | - | $85.00 |
| Rebates | -$5.00 | $80.00 |
| Freight Allowance | -$3.00 | $77.00 |
| Payment Terms Cost | -$2.00 | $75.00 |
| Co-op/MDF | -$4.00 | $71.00 |
| Pocket Price | - | $71.00 |
That's 29% price erosion. And this is a conservative example - we've seen waterfalls where the gap hits 40%+ for specific customer segments.
On-Invoice Deductions
These are the visible ones. They show up on the invoice, so at least someone's tracking them:
- Volume discounts - tiered pricing based on quantity. The most common and usually the most defensible.
- Promotional discounts - time-limited price reductions to drive demand. Marketing funds these, sales applies them, and nobody checks whether they actually moved the needle.
- Customer-specific pricing - negotiated rates for key accounts. Often set during the initial deal and never revisited, even when the relationship economics change.
- Order-size discounts - incentives for larger individual orders, separate from annual volume commitments.
- Early-pay discounts - 2/10 net 30 terms that reduce the effective price by 2% if the customer pays within 10 days.
Most companies have decent visibility here. The invoice shows the math. The problem is what comes next.
Off-Invoice Deductions
This is where margin goes to die.
Off-invoice deductions don't appear on any single document. They're scattered across rebate programs, logistics invoices, marketing budgets, and finance accruals:
- Rebates - quarterly or annual volume rebates paid after the fact. Often calculated by finance, invisible to the sales team that negotiated the deal.
- Freight allowances - free or subsidized shipping. Sounds small until you realize it's 3-5% of revenue for many distributors.
- Payment terms costs - the carrying cost of extended payment terms. Net-60 or net-90 terms have a real cost that rarely gets allocated back to the customer.
- Co-op advertising / MDF - marketing development funds paid to channel partners. Marketing owns the budget, but it's effectively a price reduction.
- Warranty costs - post-sale support and replacement costs that vary wildly by customer but get averaged across the portfolio.
- Technical support - dedicated support resources for key accounts. The cost is real; the allocation to specific customers usually isn't.
- Special handling / packaging - custom logistics requirements that add cost without adding revenue.
The pocket margin formula ties it all together: (Pocket Price - Cost) / Pocket Price. If your pocket price is $71 and your cost is $50, your pocket margin is 29.6%. Compare that to the 42% gross margin you'd calculate from the invoice price alone. That's the gap your CFO is asking about.
How to Analyze Your Waterfall - Investments vs. Leakages
The Decision Framework
Not all deductions are bad. The Cortado Group draws a critical distinction between investments and leakages.

Investments are well-executed discounts that drive measurable value - a volume discount that locks in a $2M annual contract, or a co-op program that generates 3x ROI in partner-sourced pipeline. These are strategic. Keep them.
Leakages are poorly executed deductions that destroy value - a freight allowance that was granted as a one-time exception three years ago and is now baked into every order, or a rebate program where nobody checks whether the customer hit their volume targets. These are the enemy.
The classification comes down to two questions for each deduction:
- Is it contractual or discretionary? Contractual deductions were negotiated deliberately. Discretionary ones were granted ad hoc - often by a sales rep trying to close a deal.
- Is it conditional or unconditional? Conditional deductions require the customer to do something (hit a volume target, pay early, participate in a program). Unconditional ones are just... given.
| Conditional | Unconditional | |
|---|---|---|
| Contractual | ✅ Low risk - negotiated with performance requirement | ⚠️ Medium risk - negotiated but no performance trigger |
| Discretionary | ⚠️ Medium risk - ad hoc but at least tied to behavior | 🔴 High risk - pure margin destruction |
The highest-risk leakages sit in the discretionary AND unconditional quadrant. These are discounts that nobody formally agreed to, with no performance requirement attached.
Beyond diagnosis, use the waterfall for scenario modeling. Ask: "What happens to pocket margin if we eliminate this rebate tier?" or "What's the net price realization if we tighten freight allowance eligibility?" The waterfall becomes a simulation tool, not just a rearview mirror.
Diagnostic Questions to Ask
Once you've built your waterfall, run through these:
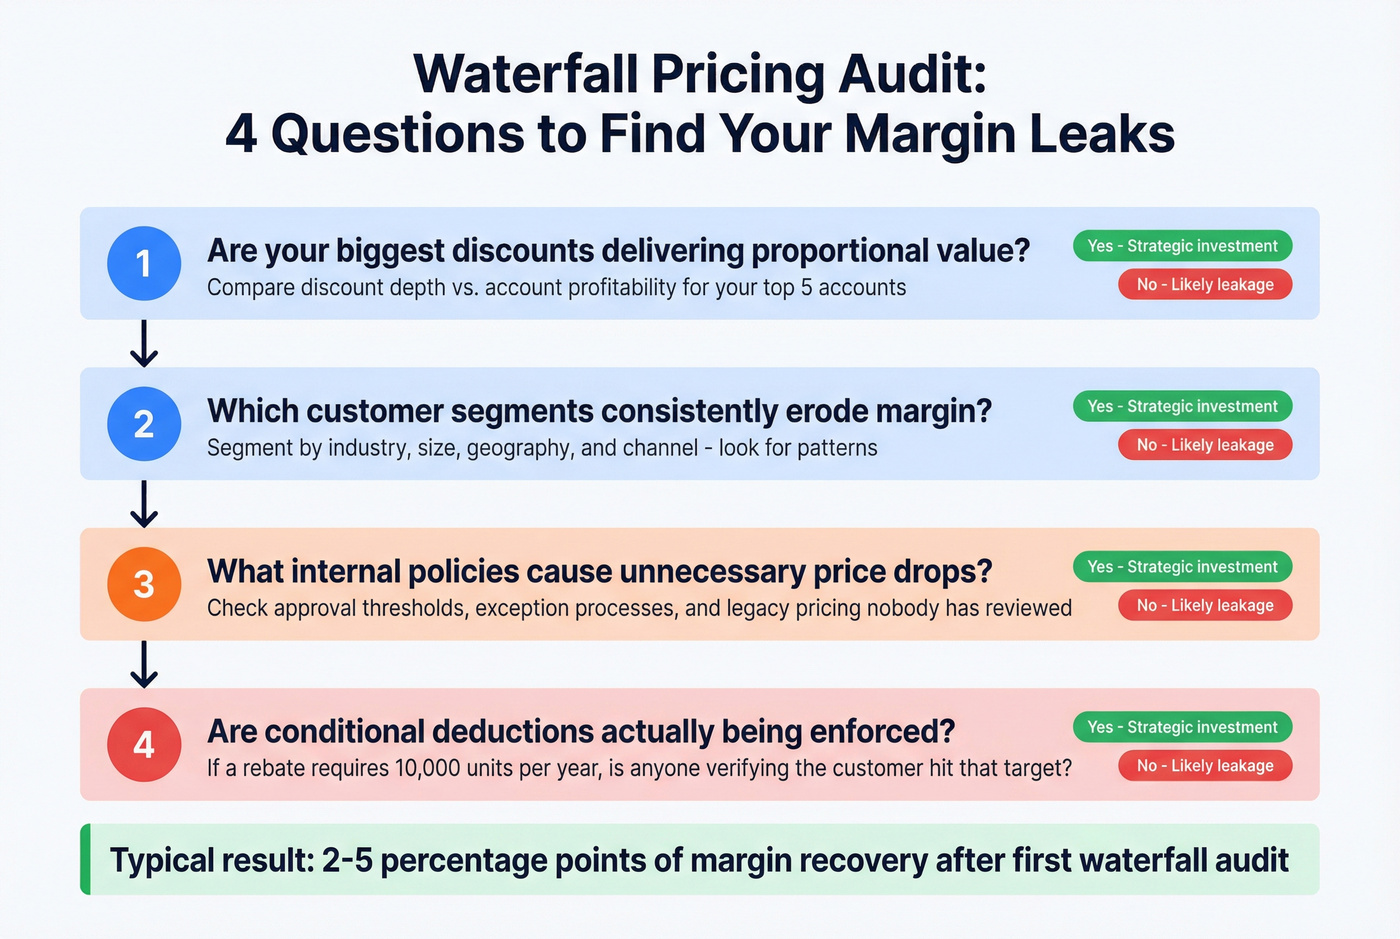
- Are your biggest discounts delivering proportional value? If your top 5 accounts get the deepest discounts, are they also your most profitable?
- Which customer segments consistently erode margin? Segment by industry, size, geography, and channel - the patterns will surprise you.
- What internal policies cause unnecessary price drops? Look for approval thresholds that are too high, exception processes that are too easy, and legacy pricing nobody's reviewed.
- Are conditional deductions actually being enforced? If a rebate requires 10,000 units/year, is anyone checking whether the customer hit 10,000?
I've seen teams discover that their "best" customer - highest revenue, longest relationship, biggest logo - actually has the worst pocket margin in the portfolio. The volume discounts, custom freight terms, extended payment windows, and co-op commitments accumulated over a decade until the account was barely profitable. That's the power of the waterfall: it makes the invisible visible.
How to Build a Pricing Waterfall in Excel
Required Data Structure
You need transaction-level data. Not averages, not summaries - individual transactions. Here's the minimum:
| Field | Description | Example |
|---|---|---|
| Transaction ID | Unique identifier | TXN-20261 |
| Customer | Account name | Acme Corp |
| Product | SKU or product line | Widget-Pro |
| List Price | Catalog price | $100.00 |
| Invoice Discount | On-invoice reduction | $15.00 |
| Invoice Price | List - discount | $85.00 |
| Rebates | Quarterly/annual | $5.00 |
| Freight Allowance | Shipping subsidy | $3.00 |
| Payment Terms Cost | Carrying cost | $2.00 |
| Co-op/MDF | Marketing funds | $4.00 |
| Pocket Price | Final retained | $71.00 |
| Pocket Margin | (Pocket-Cost)/Pocket | 29.6% |
Pulling this data together is the hardest part. Expect 2-4 hours for a single product line, and days to weeks for a full transaction-level analysis across your portfolio. The data lives in at least three systems (ERP, CRM, finance), and getting it into one spreadsheet is an exercise in patience.
Building the Chart (Excel 2016+)
Excel 2016 and later versions have a native waterfall chart. Before that, building one required a painful stacked-bar workaround. Here's the modern approach:
- Prepare your summary row. Aggregate your transaction data into a single row: List Price, then each deduction as a negative value, then Pocket Price as the final total.
- Select your data range and go to Insert -> Charts -> Waterfall.
- Set your total bars. Right-click the List Price and Pocket Price columns -> "Set as Total." This anchors them to the baseline instead of treating them as incremental changes.
- Format colors. Green for increases (if any), red for decreases (your deductions), and gray or blue for totals. This is the standard convention - don't get creative here.
- Add data labels so the exact dollar amounts are visible on each bar.
For weighted averages across multiple transactions, use SUMPRODUCT to calculate the average deduction at each step, weighted by transaction volume. Wrap your pocket margin formula in IFERROR to handle any divide-by-zero situations: =IFERROR((Pocket_Price - Cost) / Pocket_Price, 0).
Stuck on an older Excel version? The workaround involves creating three columns (Base, Fall, Rise), building a stacked column chart, and then hiding the Base series by setting it to no fill and no border. It works, but it's ugly. Upgrade if you can.
Waterfall charts go by several names - cascade charts, bridge charts, even "flying bricks charts." If someone asks you to build a bridge chart, it's the same thing, just with subtotals at key points.
Power BI for Advanced Users
Once you've outgrown a single Excel chart, Power BI's native waterfall visual adds real analytical power. You can break down each deduction by category - territory, product line, customer segment - and set maximum breakdowns to focus on the top contributors.
The killer feature is interactivity. Click on a freight allowance bar and instantly see which territories or customers are driving that cost. In Excel, that analysis requires a new pivot table for each question. In Power BI, it's a click.
For most companies, though, Excel's built-in waterfall chart is the right starting point. Don't overcomplicate this.
B2B vs. B2C Pricing Waterfalls
The waterfall framework works for both B2B and B2C, but the mechanics differ significantly.
| Dimension | B2B | B2C |
|---|---|---|
| Pricing model | Negotiated, customer-specific | Uniform, published |
| Negotiation | Heavy, multi-stakeholder | Minimal or none |
| Data availability | Limited, siloed | Broad, scrapable |
| Competitor intel | Hard to get (prices on request) | Easy (web scrapers) |
| Lost deal data | Often unrecorded | Trackable via cart abandonment |
| Waterfall structure | More standardized | Highly varied |
| Key challenge | Populating with clean data | Diverse pricing approaches |
B2B waterfalls are structurally more consistent - most B2B companies have similar deduction categories (volume discounts, rebates, freight, payment terms). The hard part is getting the data. Customer-specific pricing lives in contracts, rebates live in finance systems, and freight costs live in logistics. Nobody has a single source of truth. B2B companies also lose pricing intelligence because lost deals often go unrecorded - you can't learn from price sensitivity you never measured.
B2C waterfalls are the opposite problem. Data is abundant - you can scrape competitor prices, track promotional cadences, and measure price elasticity with A/B tests. But the waterfall structure varies wildly by retail environment, and the deduction categories (markdowns, coupons, loyalty rewards, return costs, marketplace fees) don't map neatly to the B2B framework.
B2C waterfalls are actually harder to build than B2B because of this structural diversity. But B2C companies can advance faster in pricing maturity because they have more data to work with and larger customer volumes for testing.
If you're in B2B: your biggest challenge isn't the analysis framework. It's getting clean, complete data into the spreadsheet in the first place.
Common Waterfall Pricing Mistakes
Seven mistakes I see companies make repeatedly - and most are avoidable.
1. Stopping at invoice price. This is the cardinal sin. If your "pricing analysis" ends at the invoice, you're ignoring the 15-30% of erosion that happens after the invoice is sent. Rebates, freight, payment terms, co-op - none of these show up on the invoice, and collectively they're where the real margin leakage lives.
2. Manual calculation errors. Flintfox documented a case where an enterprise applied a 20% discount instead of a 2% discount on a high-volume product - and didn't catch it until significant damage was done. When you're managing tiered discounts, customer-specific pricing, and rebate programs across thousands of SKUs, a single decimal error compounds fast.
3. No customer segmentation. Treating all accounts as one pool is like averaging the temperature of a hospital - technically accurate, completely useless. Your waterfall needs to be segmented by customer tier, industry, geography, and channel. The aggregate view hides the outliers, and the outliers are where the problems live.
4. Treating all discounts as equal. Remember the investments vs. leakages distinction? A volume discount that locks in a $5M contract is fundamentally different from a freight allowance that was granted as a one-time favor and never expired. If you're not classifying each deduction, you can't prioritize which ones to fix.
5. Building once and never updating. A waterfall from Q1 is stale by Q3. Discount structures change, new rebate programs launch, freight costs shift. Quarterly refresh is the minimum. Companies with high transaction volumes or frequent promotional cycles should update monthly.
6. Siloed pricing decisions. Sales negotiates discounts. Marketing funds promotions. Finance sets payment terms and rebates. Each decision makes sense in isolation - but collectively, they create invisible margin leakage. No single function sees the full picture, which is the primary reason waterfalls go unmanaged.
7. Ignoring data quality. Garbage in, garbage out. If your CRM has stale contacts, wrong job titles, and incomplete firmographics, your customer segmentation will point to the wrong conclusions. You'll think Segment A is your most profitable when it's actually Segment B - because half the accounts in Segment A are miscategorized. Before running your first waterfall analysis, clean up your customer database so your segments reflect actual account characteristics. Tools like Prospeo can enrich incomplete records with verified firmographics to get you there.
Price Waterfall Software Tools
Excel is perfectly fine for your first waterfall. Don't let anyone sell you a $300K CPQ platform before you've done the basic analysis in a spreadsheet. Enterprise CPQ implementations frequently exceed $300K-$500K in the first year for mid-market companies - that's money you should spend only after you've proven the ROI with a manual analysis.
That said, once you've proven the value and need to automate across thousands of SKUs, dozens of customer segments, and multiple channels, you'll outgrow Excel fast. Here's what's worth evaluating.
Vendavo - The Margin Specialist
Vendavo is the gold standard for margin analysis in manufacturing and distribution. Their Margin Bridge Analyzer automates the price-volume-mix decomposition that takes days in Excel. The Profit Analyzer surfaces leakage with interactive dashboards, and their price waterfall feature includes approval controls so reps can't grant unauthorized discounts.
Pick Vendavo if: you're a $200M+ manufacturer or distributor where a 1% margin improvement pays for the software ten times over. Skip it if: you need a full CPQ platform - Vendavo is an analyst, not a quote engine.
Pricing: Mid-five to six figures annually (~$100K-$300K/yr).
Pricefx - The All-Rounder
Pricefx takes an end-to-end approach with modular Plan/Price/Profit packages. Their CPQ module includes native waterfall visibility and negotiation guidance - reps see the margin impact of every discount in real time, before they submit the quote.
The modular structure means you don't have to buy everything. Start with the analytics module, prove ROI, then add CPQ. If Vendavo is the specialist surgeon, Pricefx is the general practitioner who handles most things well. For companies that need pricing analytics AND CPQ in one platform, it's the strongest option.
Pricing: Custom-quoted, but positioned below legacy platforms. Expect mid-five to low-six figures.
Excel - Where Everyone Should Start
Free with Microsoft 365. Native waterfall charts since 2016. SUMPRODUCT for weighted averages. Pivot tables for segmentation. It's the right tool for companies under $200M in revenue doing their first-pass analysis.
The limitation is obvious: Excel doesn't scale. When you need real-time waterfall visibility across 50,000 transactions, automated approval workflows, and dynamic pricing recommendations, you've outgrown it. But start here. Always start here.
If you'd rather outsource the first analysis entirely, firms like Pryse offer one-time diagnostic engagements starting around $1,500. Not a bad option if you want expert eyes before committing to software.
Comparison Table
| Tool | Best For | Waterfall Features | Pricing | Deploy Time |
|---|---|---|---|---|
| Excel | First-pass analysis | Native chart, manual | Free (M365) | Immediate |
| Vendavo | Mfg/distribution margin analysis | Margin Bridge, approvals | ~$100K-$300K/yr | Months |
| Pricefx | End-to-end pricing | CPQ + waterfall analytics | ~$80K-$200K/yr | Weeks-months |
| DealHub | Post-SFDC CPQ teams | Revenue orchestration | ~$40K-$80K/yr | Weeks |
| PROS | Airlines, large B2B | AI dynamic pricing | ~$150K+/yr | Months |
| Conga CPQ | Complex mfg/telecom | AI-enhanced CLM | ~$100K+/yr | Months |
| Oracle CPQ | Global enterprise | Full CPQ suite | ~$100K+/yr | Months-quarters |
| Revionics | Retail price optimization | Margin simulation | Enterprise custom (~$100K+/yr) | Months |
A quick note on DealHub: with Salesforce sunsetting standalone CPQ (it's been folded into Revenue Cloud), a lot of teams are evaluating alternatives. DealHub delivers 50-70% faster quote generation and deployments in weeks instead of quarters. Worth a look if you're in that migration window.
PROS is the AI play - dynamic pricing for airlines and large B2B enterprises. If you're not doing millions of transactions with real-time price optimization needs, it's overkill.
Conga CPQ and Oracle CPQ are enterprise-only. Complex manufacturing, telecom, global operations. If you know you need them, you already know. If you're not sure, you don't.
Look, here's my honest take: most companies don't need pricing software. They need pricing discipline. Vendavo and Pricefx are the two tools worth evaluating if you've genuinely outgrown Excel. Everything else is either too niche or not waterfall-specific enough to be your primary margin analysis platform. I've watched companies spend six months evaluating software when they could've built a waterfall in Excel in an afternoon and found $500K in leakage by Friday. Do the analysis first. Buy the software second.
Waterfall analysis reveals where every cent goes. Apply the same rigor to prospecting. Prospeo gives you 300M+ verified contacts with 30+ filters - intent data, technographics, funding - so every dollar you spend on outreach actually reaches a real buyer.
Know your pocket ROI on every lead, starting at $0.01 each.
FAQ
What is waterfall pricing?
It's a visual framework mapping every deduction between list price and pocket price - the cash a company actually retains after discounts, rebates, freight, and payment terms. McKinsey introduced the concept in 1992, and most B2B companies discover 20-30% gross-to-net erosion when they first build one.
How is a pricing waterfall different from cost-plus pricing?
Cost-plus pricing sets prices by adding a fixed markup to production costs. A pricing waterfall analyzes existing prices by tracking every deduction from list price to pocket price. One is a pricing method; the other is a diagnostic tool that reveals hidden margin leakage.
How often should you update your pricing waterfall?
Quarterly at minimum - a Q1 waterfall is stale by Q3 as discount structures and freight costs shift. Companies with high transaction volumes should update monthly. Automated tools like Vendavo or Pricefx enable continuous updates; Excel-based waterfalls require manual refreshes each cycle.
What data do you need to build a pricing waterfall?
Transaction-level records including list price, invoice discounts, rebates, freight allowances, payment terms costs, and co-op/MDF spend - broken down by customer, product, and channel. Clean CRM data is essential; enrich incomplete customer records with verified firmographics before you run the analysis so your segments reflect actual account characteristics.