SDR Performance Metrics: Benchmarks Your Team Should Actually Hit
80 calls a day. 50 emails. Three meetings booked this month. Your activity dashboard says reps are busy - but busy doing what? When bounce rates hover near 35-40% and email deliverability craters, your SDR performance metrics aren't measuring output. They're measuring how fast your team burns through bad data.
With 58% of BDR teams expanding in the past year and 79% growing or maintaining headcount, more SDRs are competing for the same prospects. The bar is higher. The framework that separates growing teams from churning ones: track activity operationally, but compensate and coach on outcomes. Three metrics predict SDR success - connect rate, meeting-to-opportunity ratio, and pipeline contribution. Everything else is diagnostic.
Activity Metrics: Necessary but Not Sufficient
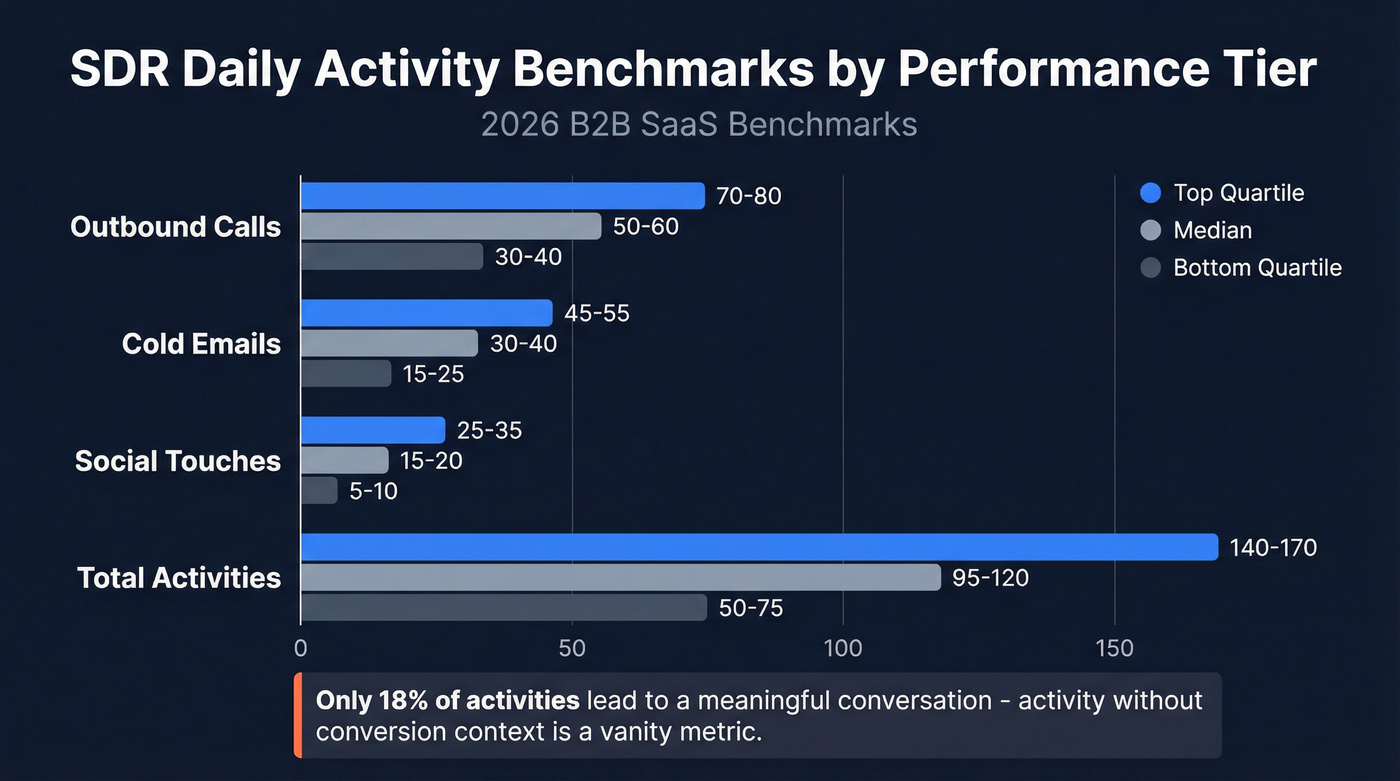
Insia's dashboard breakdown highlights a common pattern: SDRs average 104 activities per day, yet only 18% lead to a meaningful conversation - a real two-way exchange, not a voicemail or no-reply. That's a lot of motion producing very little signal.
| Metric | Top Quartile | Median | Bottom Quartile |
|---|---|---|---|
| Outbound calls/day | 70-80 | 50-60 | 30-40 |
| Cold emails/day | 45-55 | 30-40 | 15-25 |
| Social touches/day | 25-35 | 15-20 | 5-10 |
| Total activities/day | 140-170 | 95-120 | 50-75 |
Activity without conversion context is a vanity metric. A rep making 80 calls into disconnected numbers isn't outperforming a rep making 40 calls with a 12% connect rate. Ask most SDR managers what metric they'd eliminate, and they'll tell you raw dial count - it incentivizes motion over outcomes. The best sales development KPIs tie activity to downstream results, not just volume.
These benchmarks are outbound-focused. Inbound SDRs operate on different physics, especially speed-to-lead. If your team handles both motions, track them separately or you'll muddy every number on your dashboard.
Conversion Rates by Channel
Channel-level conversion rates tell you where your reps' time actually pays off:
| Channel | Conversion to Meeting |
|---|---|
| Cold call | 2.0-3.5% |
| Cold email | 0.8-2.0% |
| Social DM | 2.0-4.5% |
| Multi-touch cadence | 4.0-7.0% |
Multi-touch converts 2-3x higher than single-channel. That's the difference between a rep booking 6 meetings a month and 14.
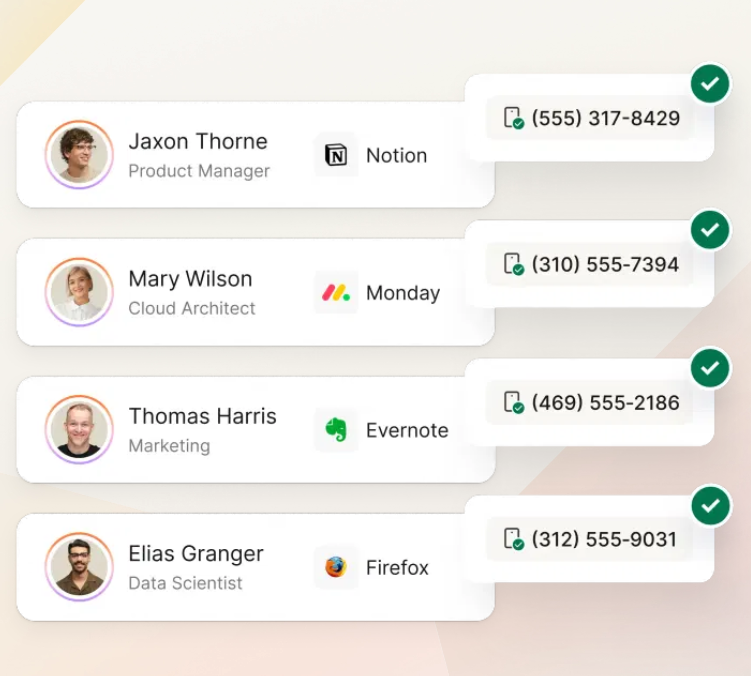
Connect rate is the canary. Healthy is 8-12%. Below 5% signals a data problem, not a coaching problem. If your reps can't get anyone on the phone, the issue is upstream of their pitch - it's the numbers they're dialing. Prospeo's 125M+ verified mobile numbers show a 30% pickup rate, which closes the gap between effort and actual conversations.
Email deliverability deserves first-class metric status. Target inbox placement in the mid-90s. Anything below ~90% means your domain reputation is degrading, and every other email metric - open rate, reply rate, conversion - is built on a crumbling foundation. Track bounce rate weekly, not monthly. If you need a tighter system, use an email deliverability checklist and keep an eye on hard bounce drivers.
Email reply rates run 2-5% for cold outbound. Speed-to-lead matters more than most teams realize: only 7% of companies respond within 5 minutes, while the average response time is 42 hours. That delay costs you the deal - engaging with leads within five minutes can increase conversion rates by 400%.
On cadence structure, 6sense's BDR benchmark survey found reps now average 21 attempts per contact across a 53-day cadence, up from 17 attempts the prior year. Multithreading has exploded too - 90% of BDRs now reach out to roughly 9 contacts per account, up from 6.4.
Here's the thing: if your average deal size is under $15K, you don't need 21 touches across 53 days. That cadence length makes sense for enterprise deals. For mid-market and below, we've found that 12-14 touches over 21-28 days hits the sweet spot before diminishing returns kick in. Longer cadences just give prospects more time to forget you exist.
Below 5% connect rate? That's not a coaching problem - it's a data problem. Prospeo's 125M+ verified mobile numbers deliver a 30% pickup rate, turning your SDRs' 50 daily dials into actual conversations. At $0.01 per email with 98% accuracy, bounce rates drop from 35% to under 4%.
Stop measuring how fast your team burns through bad numbers.
Meeting and Pipeline Benchmarks
Meetings booked gets the most attention and the least context. Use these targets as a starting point, then adjust for your ACV and sales cycle:
| Performance Tier | Meetings/Month |
|---|---|
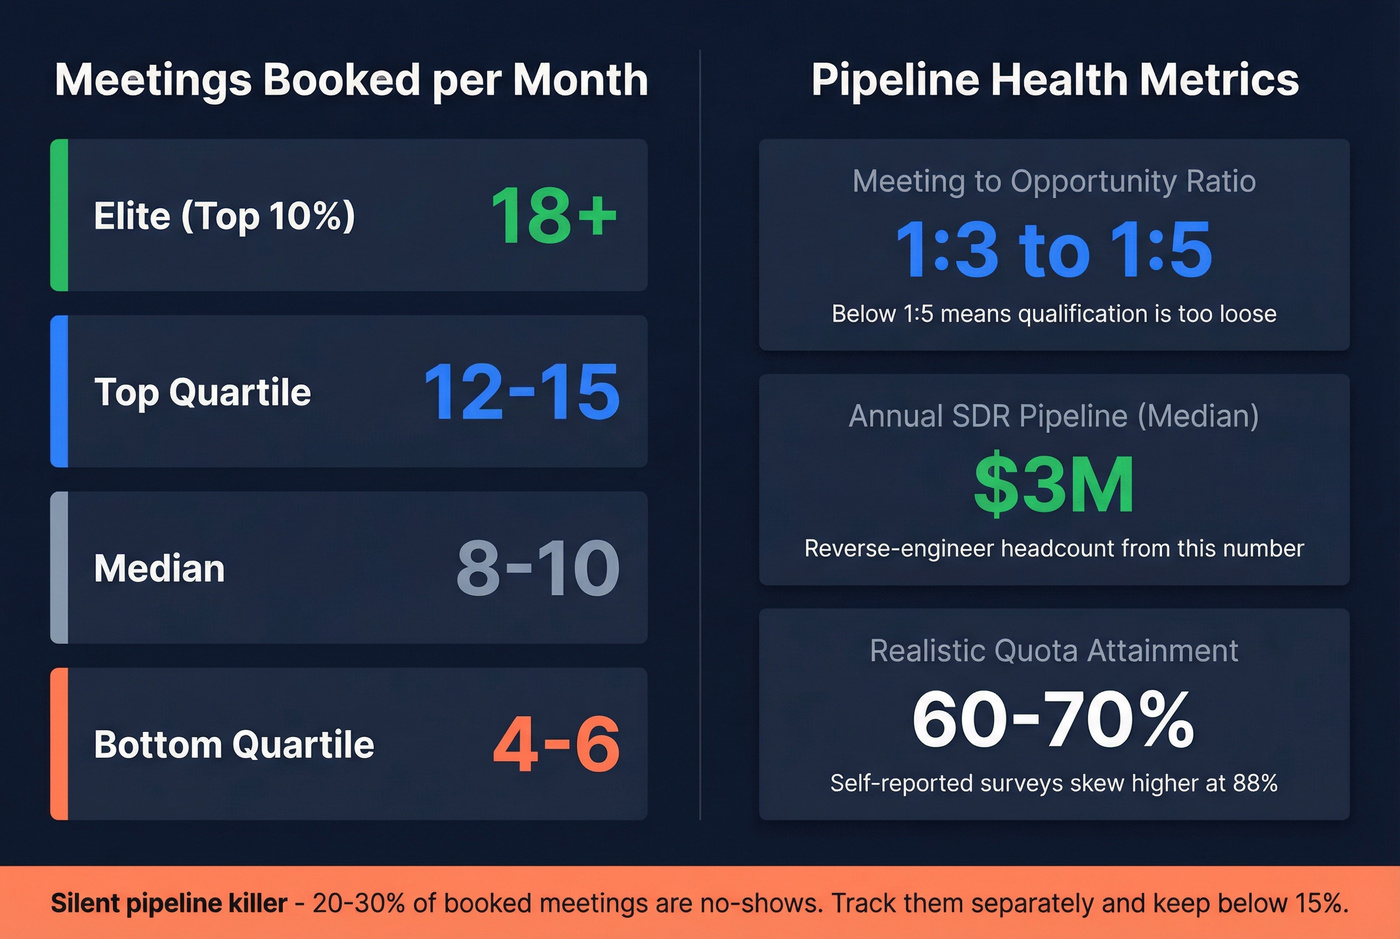
| Elite (top 10%) | 18+ |
| Top quartile | 12-15 |
| Median | 8-10 |
| Bottom quartile | 4-6 |
Meetings alone don't tell you enough, though. Meeting-to-opportunity ratio separates qualification from calendar-stuffing. The best SDRs maintain a 1:3 to 1:5 ratio - for every 3 to 5 meetings booked, one converts to a sales-accepted lead or opportunity. If your team is running worse than 1:5, qualification criteria are too loose and reps are booking meetings that AEs reject. And 74% of high-performing BDR teams hand over prospects as Opportunities rather than Leads or Accounts, which means tighter qualification happens before the handoff, not after.
Meeting booking rate tracking also means accounting for no-shows. This is a silent pipeline killer. If 20-30% of booked meetings never happen, your top-line meeting count overstates actual performance. Track no-shows separately and coach reps on confirmation sequences to keep that number below 15%. (If you need a system, start with a SDR follow-up strategy.)
Pipeline contribution is the metric that earns SDRs a seat at the revenue table. Industry benchmarks put median SDR-generated pipeline at roughly $3M per year. On quota attainment, the numbers vary: Tenbound and Blossom Street Ventures peg it at 56-68%, while 6sense's survey reports 88%. The 6sense number has self-selection bias baked in - teams that respond to benchmark surveys tend to be higher-performing. Plan on 60-70% as a realistic baseline.
Reverse-engineer from revenue to set headcount. If your team needs $12M in annual pipeline and each full-ramp SDR generates ~$3M, you need 4 fully ramped SDRs plus at least one ramping at any given time to cover attrition. Pipeline velocity is the compound metric that ties SDR output to closed revenue: (# of opportunities x average deal size x win rate) / sales cycle length. Track it monthly - then pressure-test it against common sales pipeline challenges.
Ramp, Enablement, and AI Impact
A healthy ramp follows this trajectory:
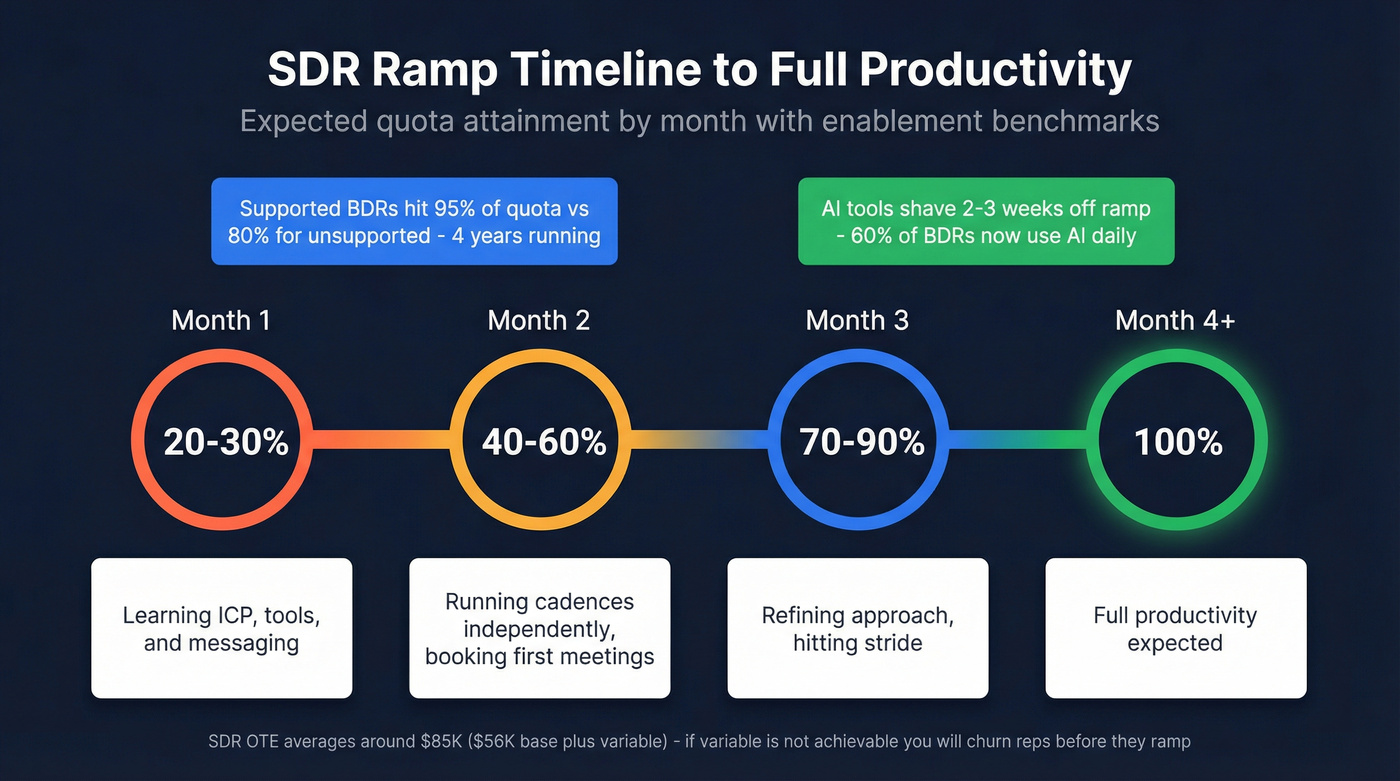
- Month 1: 20-30% of quota - learning ICP, tools, messaging
- Month 2: 40-60% - running cadences independently, booking first meetings
- Month 3: 70-90% - refining approach, hitting stride
- Month 4+: Full productivity expected
Setting clear goals at each ramp stage gives new hires a concrete target instead of an ambiguous "get up to speed." The enablement correlation is striking: BDRs who feel supported hit 95% of quota versus 80% for unsupported reps, a pattern that's held for four consecutive years. Organizational alignment matters too - 80% of BDRs now report to Sales, up from 60% in 2022, which tightens the feedback loop between prospecting activity and closed-won outcomes.
Comp context matters here. SDR OTE runs ~$85K ($56K base plus variable). If the variable component isn't realistically achievable, you'll churn reps before they finish ramping - and you'll pay the ramp cost twice.
AI is reshaping the ramp curve. Roughly 60% of BDRs now use AI tools in their workflow, and 62% say AI enhances their productivity. Only 13% see it as a threat. In our experience, the biggest AI wins aren't in writing emails - they're in prioritizing accounts, summarizing research, and personalizing first lines at scale. Teams that layer AI into their enablement stack are shaving 2-3 weeks off ramp time because reps spend less time on manual research and more time in actual conversations. (If you're building the stack, start with AI for B2B outreach.)
The Metric Most Teams Ignore: Data Quality
Every metric above assumes your contact data is accurate. When bounce rates exceed 5%, a big chunk of your dashboard is lying to you.
We've seen teams spend months coaching reps on call technique when the real problem was bad phone numbers. We've also watched connect rates double - literally double - when teams fixed data quality before touching a single coaching playbook. The r/sales subreddit is full of threads where SDRs blame themselves for low connect rates, only to discover their dialer was burning through recycled data from a provider that hadn't refreshed records in months.
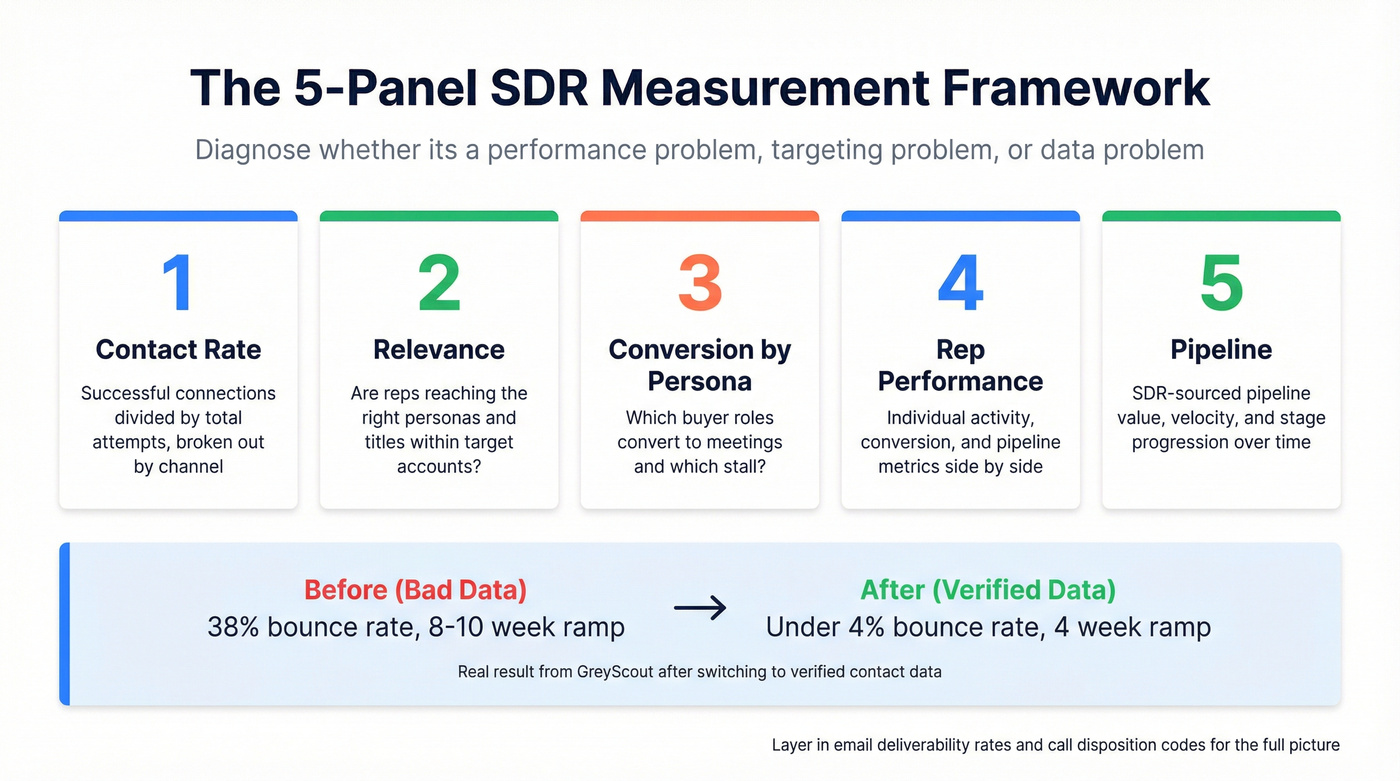
Let's break down what a proper measurement framework looks like. The Insia approach splits SDR measurement into five views:
- Contact rate - successful connections divided by total attempts, broken out by channel
- Relevance - are reps reaching the right personas and titles within target accounts?
- Conversion by persona - which buyer roles convert to meetings, and which stall?
- Rep performance - individual activity, conversion, and pipeline metrics side by side
- Pipeline - SDR-sourced pipeline value, velocity, and stage progression over time
That five-panel view tells you whether your reps have a performance problem, a targeting problem, or a data problem. Layer in email deliverability rates and call disposition codes for the full picture.
One real example: GreyScout dropped their bounce rate from 38% to under 4% and cut rep ramp time from 8-10 weeks to 4 after switching to verified contact data. That's not a coaching win. It's an infrastructure win.
Use this approach if your bounce rate is above 5% or your connect rate is below 8%. Skip it if your connect rate already exceeds 10% and your email deliverability sits above 95% - your data is probably fine, and the problem is downstream.
Before you optimize any SDR performance metrics on this list, audit your contact data. Prospeo verifies emails at 98% accuracy on a 7-day refresh cycle - so your activity metrics reflect rep performance, not data decay. The free tier gives you 75 verified emails per month to test against your current database. If you want the underlying why, start with B2B contact data decay and prospect data accuracy.
SDR pipeline targets mean nothing when 35% of emails bounce and domain reputation tanks. Prospeo's 7-day data refresh cycle and 5-step verification keep inbox placement in the mid-90s - exactly where this article says it needs to be. Snyk's 50 AEs cut bounce rates from 35-40% to under 5% and grew AE-sourced pipeline 180%.
Hit your pipeline benchmarks with data that actually connects.
FAQ
How many meetings should an SDR book per month?
Median is 8-10 qualified meetings per month for B2B SaaS. Top-quartile SDRs hit 12-15. If your team is consistently below 6, investigate data quality and targeting before coaching harder - the problem is usually upstream of rep skill. Bridge Group's annual SDR metrics report is a solid external benchmark to compare against.
What's a good SDR connect rate?
Healthy outbound connect rate is 8-12%. Below 5% signals bad phone data or poor timing, not bad reps. Audit your contact database before changing your coaching cadence.
How do you improve SDR results without adding headcount?
Fix data quality first - get bounce rates under 3-5%. Shorten speed-to-lead below 5 minutes. Run multi-touch cadences, which convert at 4-7% versus ~2% for single-channel. Keep contact data on a weekly refresh cycle so reps stop wasting dials on dead numbers. Gartner's SDR efficiency research backs up the data-first approach.
Which SDR performance metrics matter most?
Three metrics matter above all others: connect rate tells you if your data is good, meeting-to-opportunity ratio tells you if qualification is tight, and pipeline contribution tells you if effort translates to revenue. Track activity for operational visibility, but coach and compensate on these three outcomes.