TAM Calculation: The Step-by-Step Guide for Founders and Revenue Teams
You're building your Series A deck and the VC partner leans forward: "What's your TAM?" You pull up a slide with a big number from a Gartner report. She asks how you got there. You don't have a good answer.
That's how deals die. 42% of startups cite "no market need" as their top failure reason - and most of them never ran a proper TAM calculation to begin with.
The Short Version
- Use bottom-up as your primary method. ICP, account count, ACV. Top-down is a sanity check, not a strategy.
- Free data sources get you 80% there. Census Bureau, BLS, SEC filings. Layer a B2B database for actual account counts filtered by industry, headcount, revenue, and geography.
- The 3x divergence rule. If your top-down and bottom-up estimates diverge by more than 3x, at least one input is wrong. Fix it before you present to anyone.
What Is TAM?
TAM (Total Addressable Market) is the total revenue opportunity available if you captured 100% of your market. It's a theoretical ceiling - useful for framing, useless for planning. What actually matters is how you narrow it.
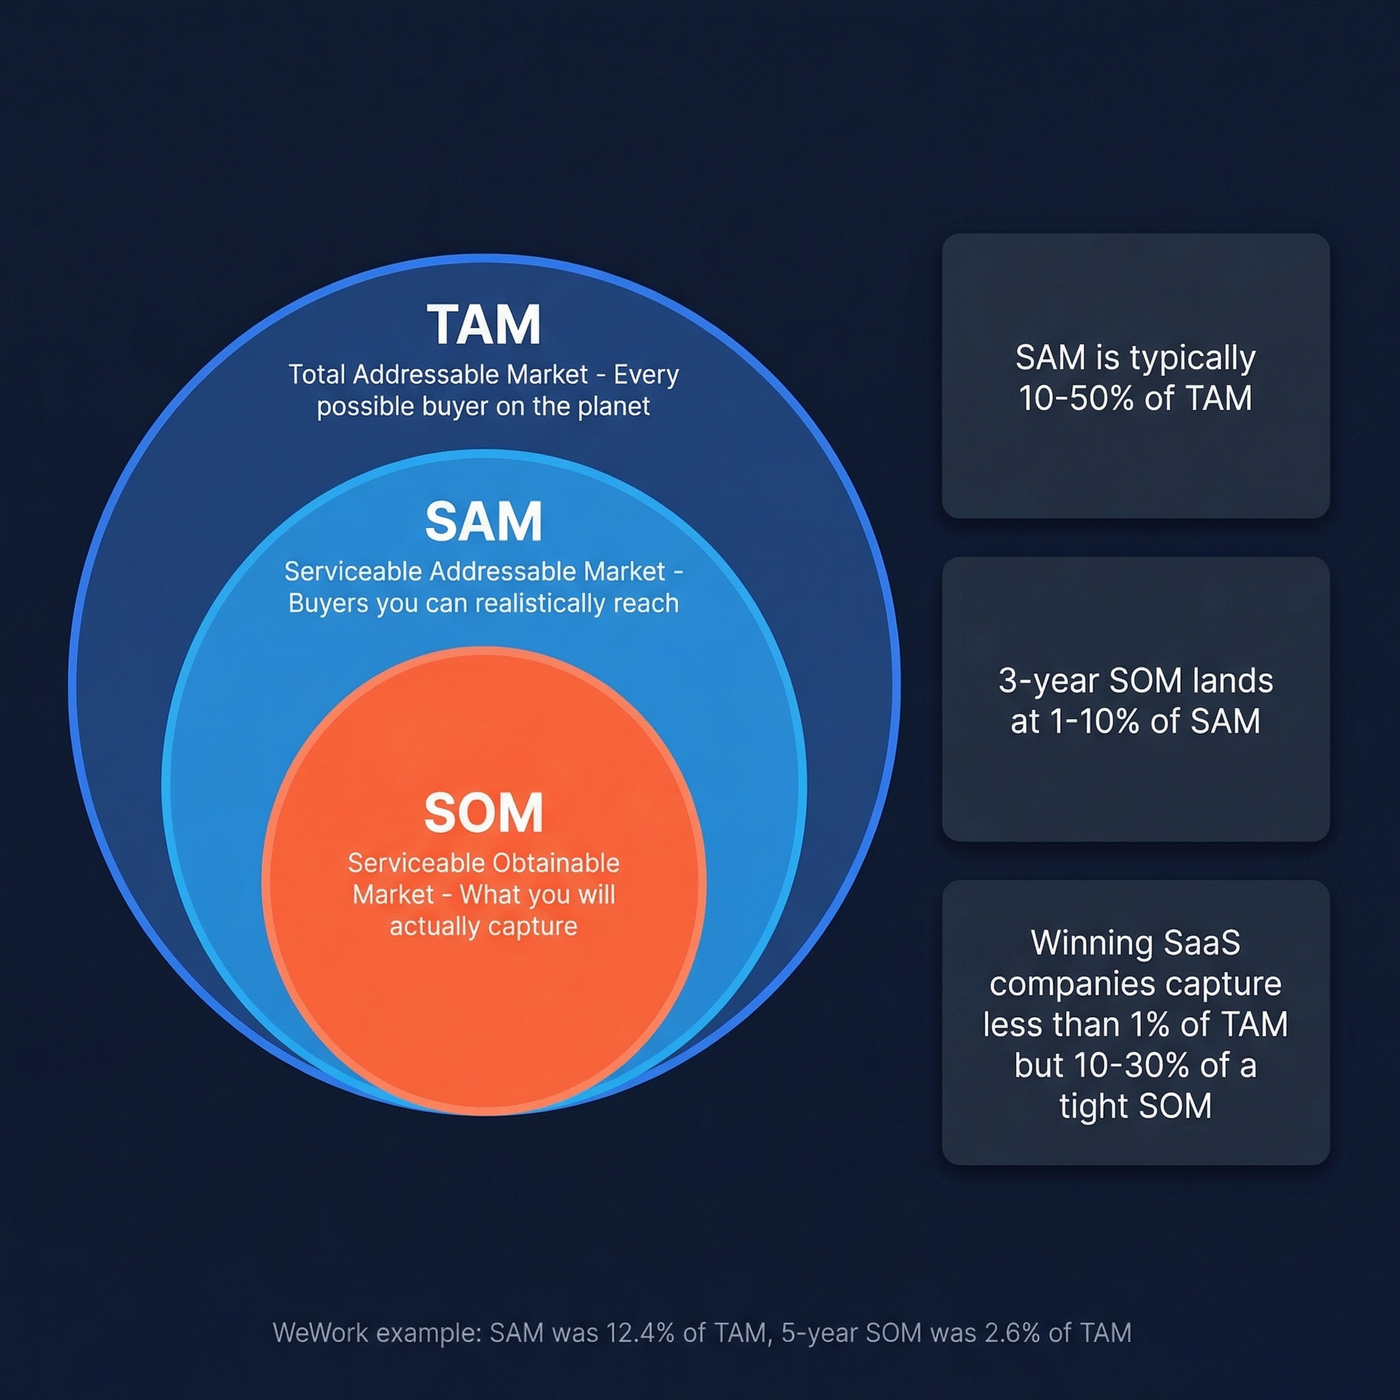
Think of three concentric circles. TAM is the outer ring: every possible buyer on the planet. SAM (Serviceable Addressable Market) is the middle ring: the subset you can realistically reach given your product, geography, and go-to-market motion. SOM (Serviceable Obtainable Market) is the bullseye - what you'll actually capture in a defined timeframe.
The ratios matter more than the raw numbers. WeWork's market sizing is a useful reference: SAM ran about 12.4% of TAM, and their five-year SOM landed at roughly 2.6% of TAM. As a general heuristic, SAM typically runs 10-50% of TAM, and a three-year SOM lands between 1-10% of SAM. Successful SaaS companies capture less than 1% of TAM but 10-30% of a well-defined SOM. The tighter your SOM definition, the more credible your pitch.
Three Methods to Calculate TAM
There's no single right method. But there's a clear hierarchy of investor credibility.
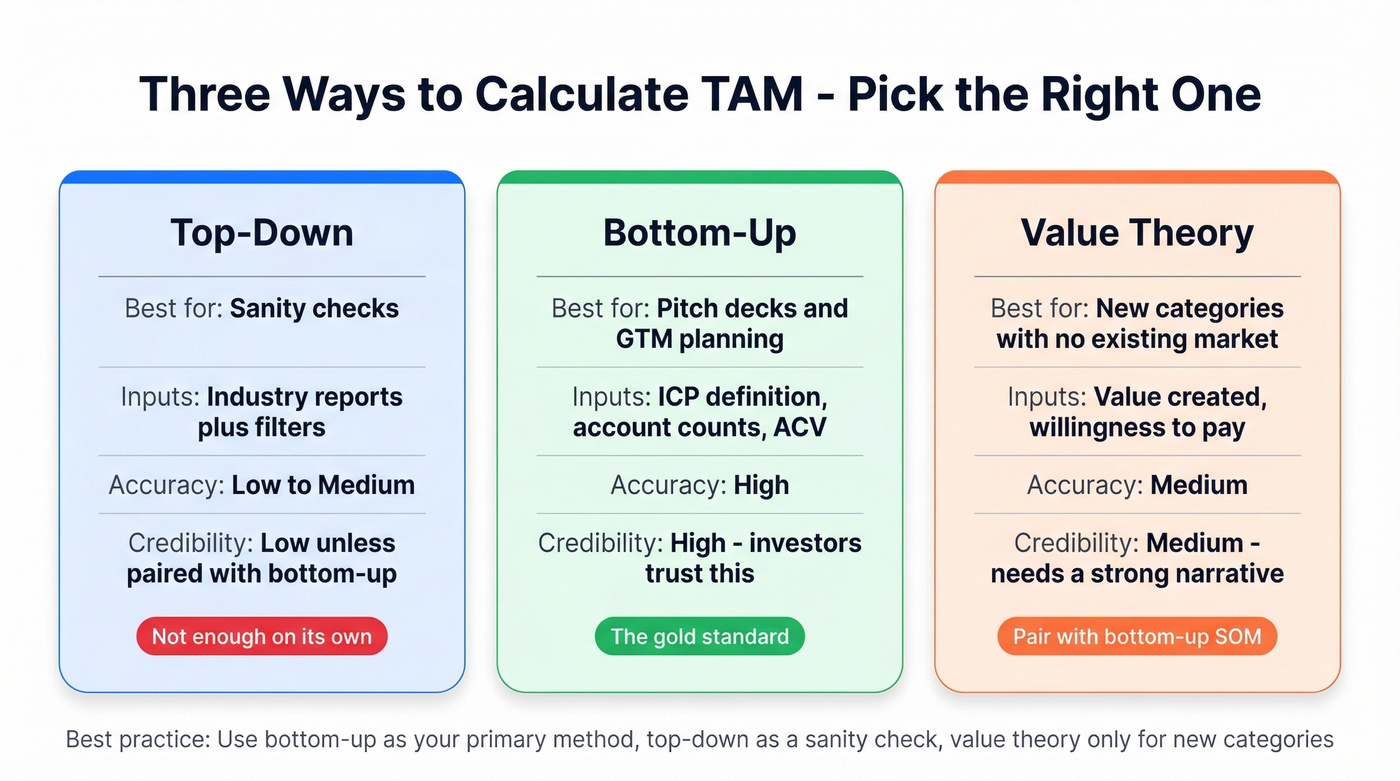
| Method | Best For | Key Inputs | Accuracy | Credibility |
|---|---|---|---|---|
| Top-Down | Sanity checks | Industry reports, filters | Low-Medium | Low (unless paired) |
| Bottom-Up | Pitch decks, GTM | ICP, account counts, ACV | High | High |
| Value Theory | New categories | Value created, WTP | Medium | Medium (needs narrative) |
Top-Down: The Sanity Check
Start with an industry-level number and narrow. Global software market, then your region, then your segment, then your buyer profile. It's fast and gives you a ceiling.
The problem: every narrowing step is an assumption, and investors will challenge every single one. If you say your segment is 5% of a big category, the first question is "why 5% and not 2%?" There's also a Goldilocks problem - a TAM that's too large signals you haven't done the work, while a TAM that's too small signals the opportunity isn't venture-scale.
Here's a quick example. Start with a broad HR software market estimate from an industry report, narrow to North America, narrow again to mid-market companies with 500-5,000 employees, then narrow once more to the specific HR workflows you actually support. The output is a useful frame, but it's not a strategy until you can defend every filter.
Bottom-Up: The Gold Standard
This is the method that earns investor trust because it's grounded in countable accounts and realistic pricing. We've seen founders struggle most with this step - finding reliable account counts for niche segments feels like detective work. Here's the workflow:
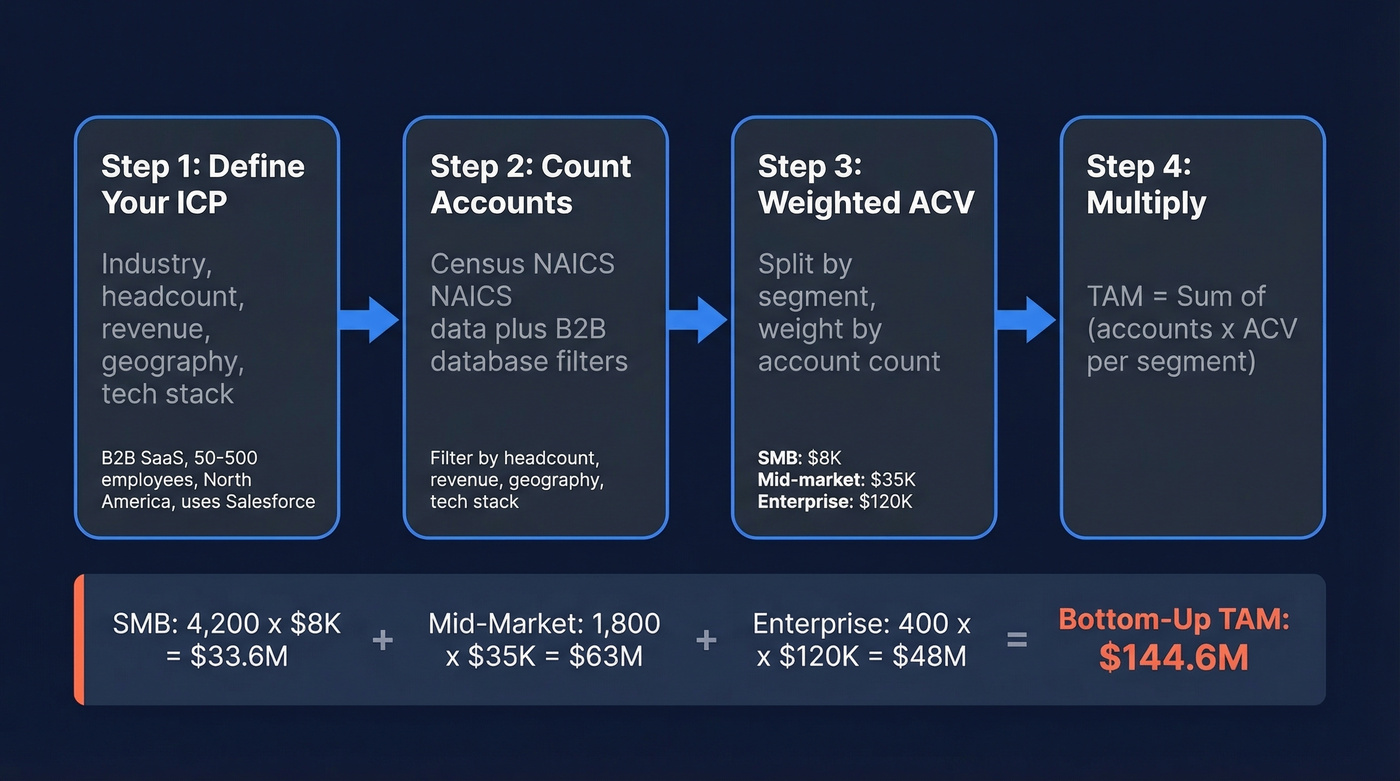
Define your ICP. Industry, headcount range, revenue band, geography, tech stack, department structure. "B2B SaaS companies with 50-500 employees in North America using Salesforce" is an ICP. "Technology companies" is not.
Count potential accounts. Start with Census Bureau NAICS data for industry-level counts, then use a B2B database to filter by headcount, revenue, geography, and tech stack. You're counting real companies, not estimating from a report.
Determine weighted ACV. Don't use a single average. Split by SMB, mid-market, and enterprise, then weight by account count.
Multiply. The formula: TAM = Σ(accounts per segment x ACV per segment).
Say you sell compliance automation SaaS to financial services firms in the US:
- SMB (50-200 employees): 4,200 accounts x $8K ACV = $33.6M
- Mid-market (200-2,000): 1,800 accounts x $35K ACV = $63M
- Enterprise (2,000+): 400 accounts x $120K ACV = $48M
- Bottom-up TAM: $144.6M
That's a number you can defend line by line.
Value Theory: For New Categories
When there's no existing market to size - you're creating a new category - top-down and bottom-up both break down. Value theory estimates TAM by quantifying the economic value your product creates and assuming you can capture a portion of it.
WeWork used this approach. Total value of office space globally: $1.35T (TAM). The "creative class" subset willing to pay for flexible workspace: $168B (SAM). What WeWork could realistically capture in five years: $33.8B (SOM), representing 20.9% of SAM. Use value theory when the buying behavior doesn't exist yet, but pair it with a bottom-up SOM estimate to stay grounded.
Why TAM Is Dynamic
In 2014, NYU professor Aswath Damodaran valued Uber by sizing the existing taxi and limousine market in a public blog exchange. Bill Gurley pushed back hard: Uber wasn't competing for the taxi market - it was expanding the transportation market. By 2022, Uber's gross bookings exceeded $26.4B per quarter. The original taxi-market estimate was off by an order of magnitude.
Here's the thing: if you're selling sub-$15K deals to SMBs, you probably don't need a TAM expansion thesis. Just nail the bottom-up math. Market expansion stories are for founders whose products genuinely change behavior - Uber, Zoom, Tesla. Most B2B SaaS companies win by capturing a well-defined SOM, not by reinventing a category.
The best founders present a credible bottom-up number for today's market and then articulate a plausible expansion thesis. "Here's our $200M TAM today. Here's why it becomes $2B if we succeed." That's a story worth funding.
Step 2 of your bottom-up TAM - counting potential accounts - is where most founders get stuck. Prospeo's B2B database lets you filter 300M+ profiles by industry, headcount range, revenue band, geography, and tech stack. Get actual account counts for your ICP, not estimates from a two-year-old report.
Turn your ICP definition into a real account count in minutes.
Where to Find TAM Data
You don't need a $30K Gartner subscription to get numbers you can defend.
| Source | Good For | Cost | Limitation |
|---|---|---|---|
| US Census Bureau | Business counts by industry/size | Free | 1-2 years behind |
| Bureau of Labor Statistics | Employment by role/industry | Free | US-only |
| SEC EDGAR | Public company financials | Free | Public companies only |
| UN Data | Global population, trade | Free | Macro-level only |
| ITC Trade Map | Import/export data | Free | Trade-focused |
| Crunchbase | Startup/tech company data | ~$49/mo+ | Tech-heavy bias |
| IBISWorld | Industry reports by NAICS | ~$500-1,200/report | Generic segments |
Before you trust any source, run a quick quality check. Is the data timely (within 2 years)? Is it relevant to your specific segment, not just a broad category? Is the methodology transparent?
Triangulate. If three independent sources converge on a similar number, your confidence should be high. If they diverge wildly, dig into why.
How to Validate Your Estimates
Apply the 3x divergence rule. Run both top-down and bottom-up. If they diverge by more than 3x, find the broken assumption. Common culprits: overly broad industry definitions in top-down, or undercounting accounts in bottom-up.
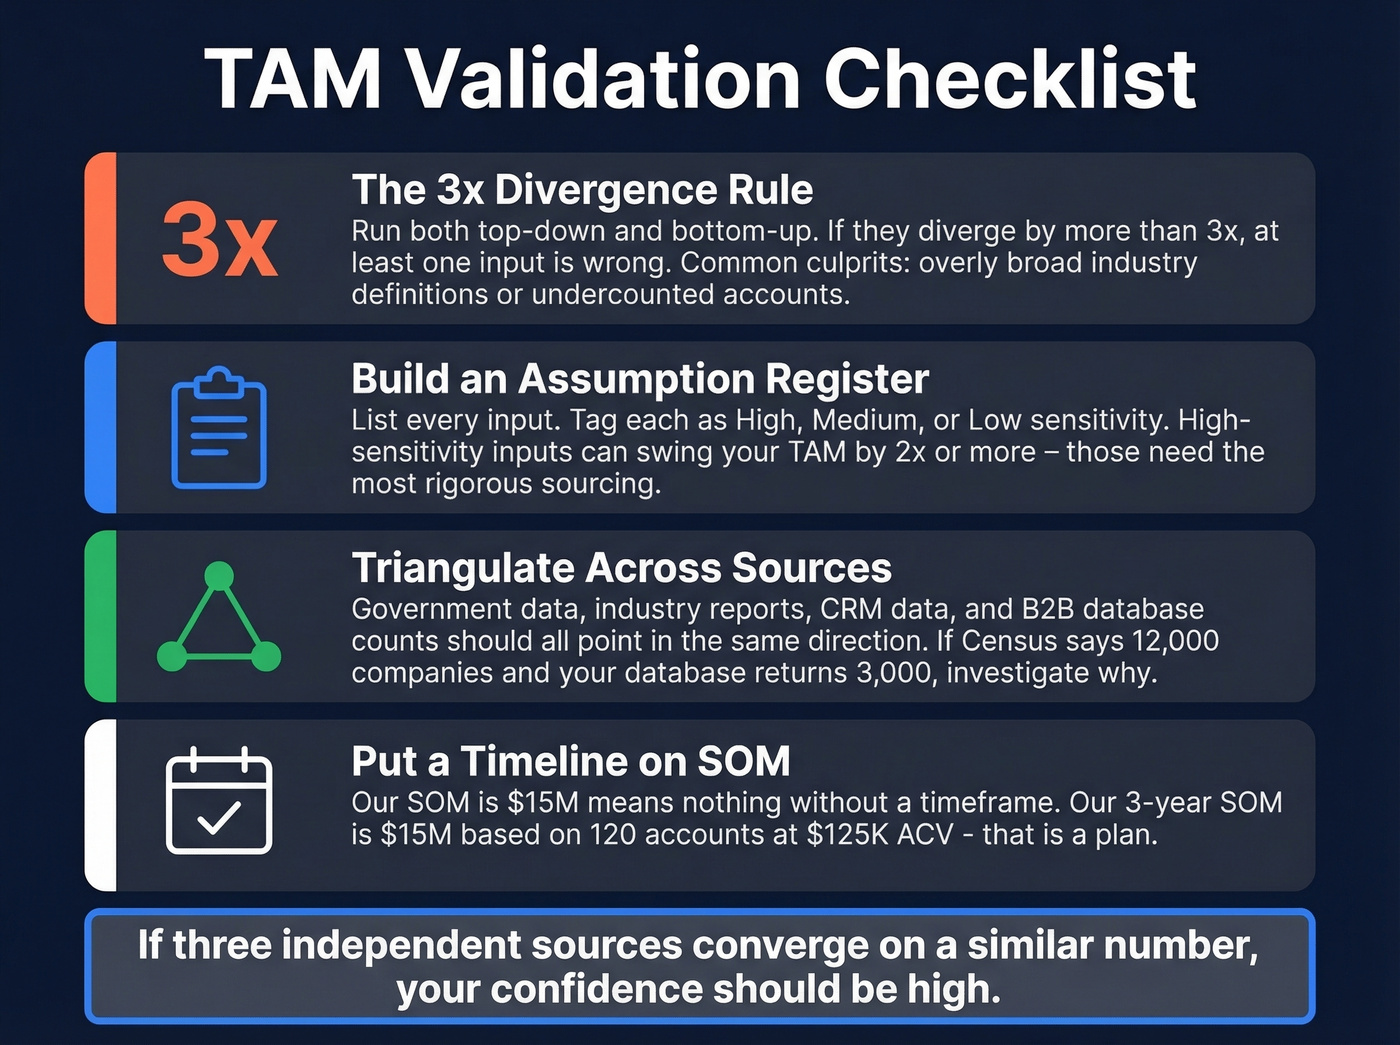
Build an assumption register. List every input and tag each as High, Medium, or Low sensitivity. High-sensitivity inputs can swing your total addressable market by 2x or more - those need the most rigorous sourcing. We've seen founders present a $500M TAM that collapses to $80M when you change one segment-share assumption from 15% to 3%. That's not a rounding error. That's a different business.
Triangulate across sources. Government data, industry reports, your own CRM data, and B2B database counts should all point in roughly the same direction. If Census says there are 12,000 companies in your NAICS code and your database search returns 3,000, either your filters are too tight or Census is counting entities you shouldn't include.
Put a timeline on SOM. "Our SOM is $15M" means nothing without a timeframe. "Our 3-year SOM is $15M based on 120 accounts at $125K ACV" is a plan.
Five Mistakes That Kill Deals
1. The "1% Fallacy." "If we capture just 1% of a $50B market..." Investors hear this and immediately check out. They interpret the 1% argument as laziness, not ambition.
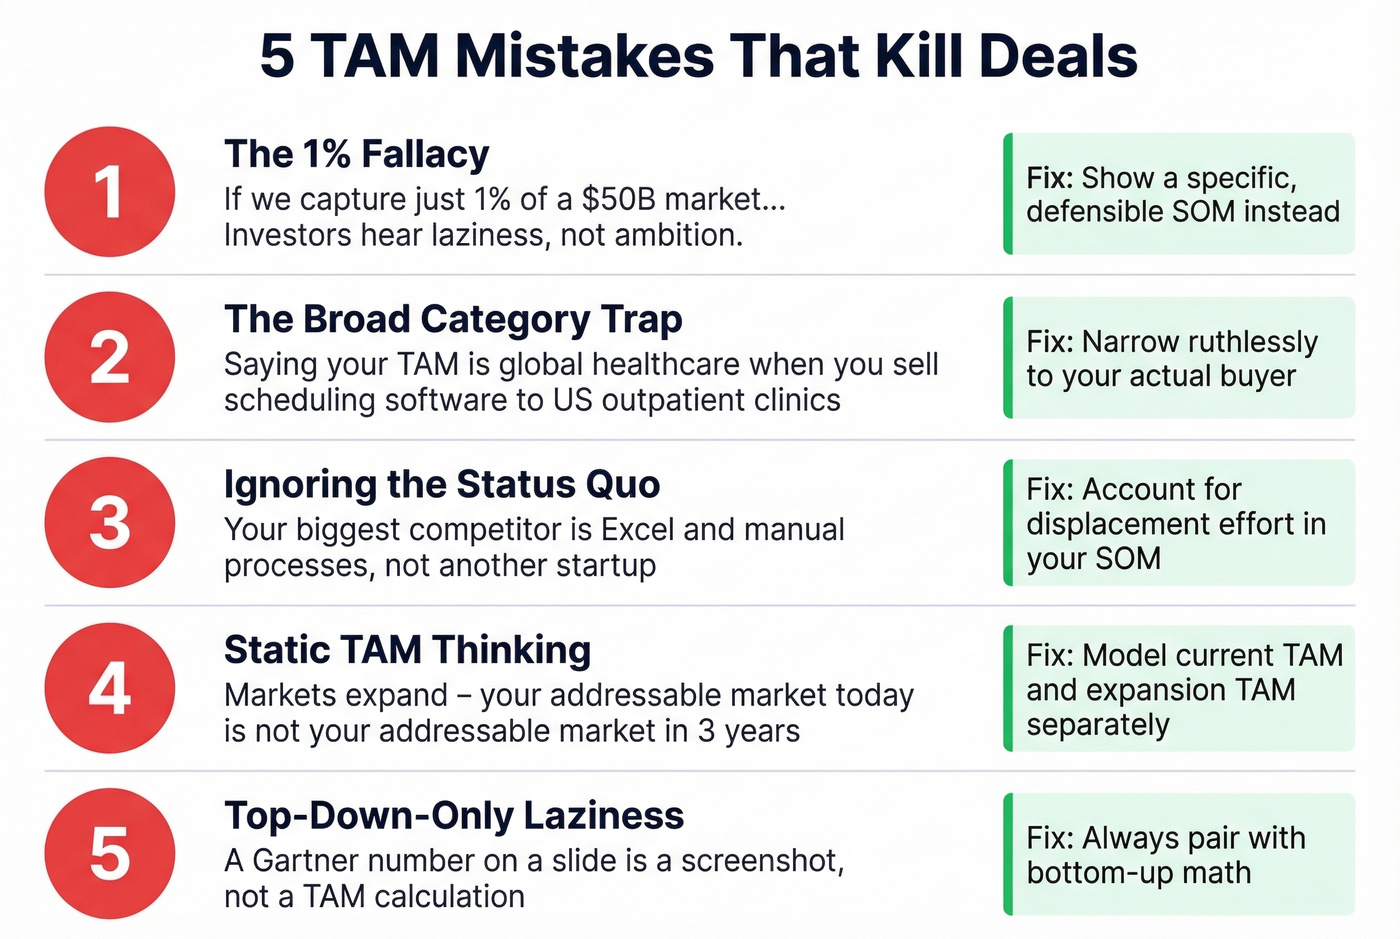
2. The broad category trap. Saying your TAM is "global healthcare" when you sell scheduling software to outpatient clinics in the US is a credibility killer. Narrow ruthlessly.
3. Ignoring the status quo. Your biggest competitor isn't another startup - it's Excel, manual processes, and "we've always done it this way." If your SOM doesn't account for the effort required to displace inertia, it's fiction.
4. Static TAM thinking. Markets expand. If your product genuinely changes buyer behavior, your addressable market today isn't your addressable market in three years. Model both.
5. Top-down-only laziness. A Gartner number on a slide isn't a TAM calculation. It's a screenshot. Flawed market sizing leads to misallocated capital, unrealistic growth targets, and sales teams chasing accounts that never convert - because the bottom-up math would have shown a fraction of those accounts actually fit the firmographic filters.
From TAM to Target Account List
Let's be honest about the gap most teams ignore. The distance between "I know my TAM is $145M" and "I have a list of companies to call on Monday" is where revenue actually happens. The same firmographic filters you used for your market sizing - industry, headcount, revenue, geography, tech stack - are the exact filters you need to build a target account list.
Prospeo's B2B database lets you apply 30+ of those filters across 300M+ profiles, layer in buyer intent across 15,000 topics to prioritize in-market accounts, and export verified emails at 98% accuracy. The free tier gives you 75 emails and 100 Chrome extension credits per month - enough to validate your ICP before committing budget.

The TAM calculation isn't the destination. It's the first step in a targeting workflow that ends with booked meetings.
If you want the next step after the list, pair it with proven sales prospecting techniques and a tight B2B cold email sequence.
You just calculated a TAM you can defend. Now build the target account list behind it. Prospeo gives you 30+ filters - including headcount growth, technographics, and buyer intent across 15,000 topics - so your SOM isn't a slide, it's a pipeline with 98% accurate emails attached.
Go from TAM slide to live pipeline for $0.01 per verified email.
FAQ
Is SAM Global for a SaaS Product?
No. Even if your product works anywhere with an internet connection, constrain SAM to geographies where you have language support, payment infrastructure, and go-to-market resources. A global SAM in a seed-stage deck signals naivety - investors expect you to scope SAM to regions you can actually serve in the next 12-18 months.
How Do I Find Account Counts for a Niche Segment?
Start with Census Bureau NAICS data for industry-level business counts, then layer a B2B database to filter by headcount, revenue, and tech stack. Cross-reference with industry association membership numbers when available. For a well-defined mid-market niche in the US, expect somewhere between 2,000 and 15,000 accounts.
What's the Best Method for TAM Calculation?
Bottom-up. It's the only method grounded in countable accounts and real pricing. Use top-down as a sanity check and value theory only when you're creating a genuinely new category. Investors trust bottom-up because every input is traceable and defensible.
How Do I Calculate TAM If I'm Pre-Revenue?
Define your ICP using firmographic criteria, count matching accounts through free sources like Census Bureau NAICS data, and assign an ACV based on competitive pricing benchmarks or willingness-to-pay surveys. The bottom-up formula still works - substitute assumed ACV for observed ACV. Run sensitivity analysis on pricing so you can show investors a range ($120M-$180M), not a single number that implies false precision.