TAM SAM SOM Examples That Actually Show You the Math
It's 11 PM, your pitch deck is due tomorrow, and you're staring at a blank market-sizing slide. Every article you've found gives definitions and zero actual numbers. Let's fix that right now.
B2B project management SaaS (quick worked example): If there are 120,000 target companies you could sell to and your average revenue per account (ARPA) is $15,000/year, your TAM is $1.8B. If your product and GTM realistically cover 15% of that universe in Year 1-2 (geo, language, integrations, support hours, sales coverage), your SAM is $270M. Apply a 1% Year 1 capture rate and your SOM is ~$2.7M.
That's the shape of the exercise. Now let's go deeper.
TAM, SAM, SOM in 30 Seconds
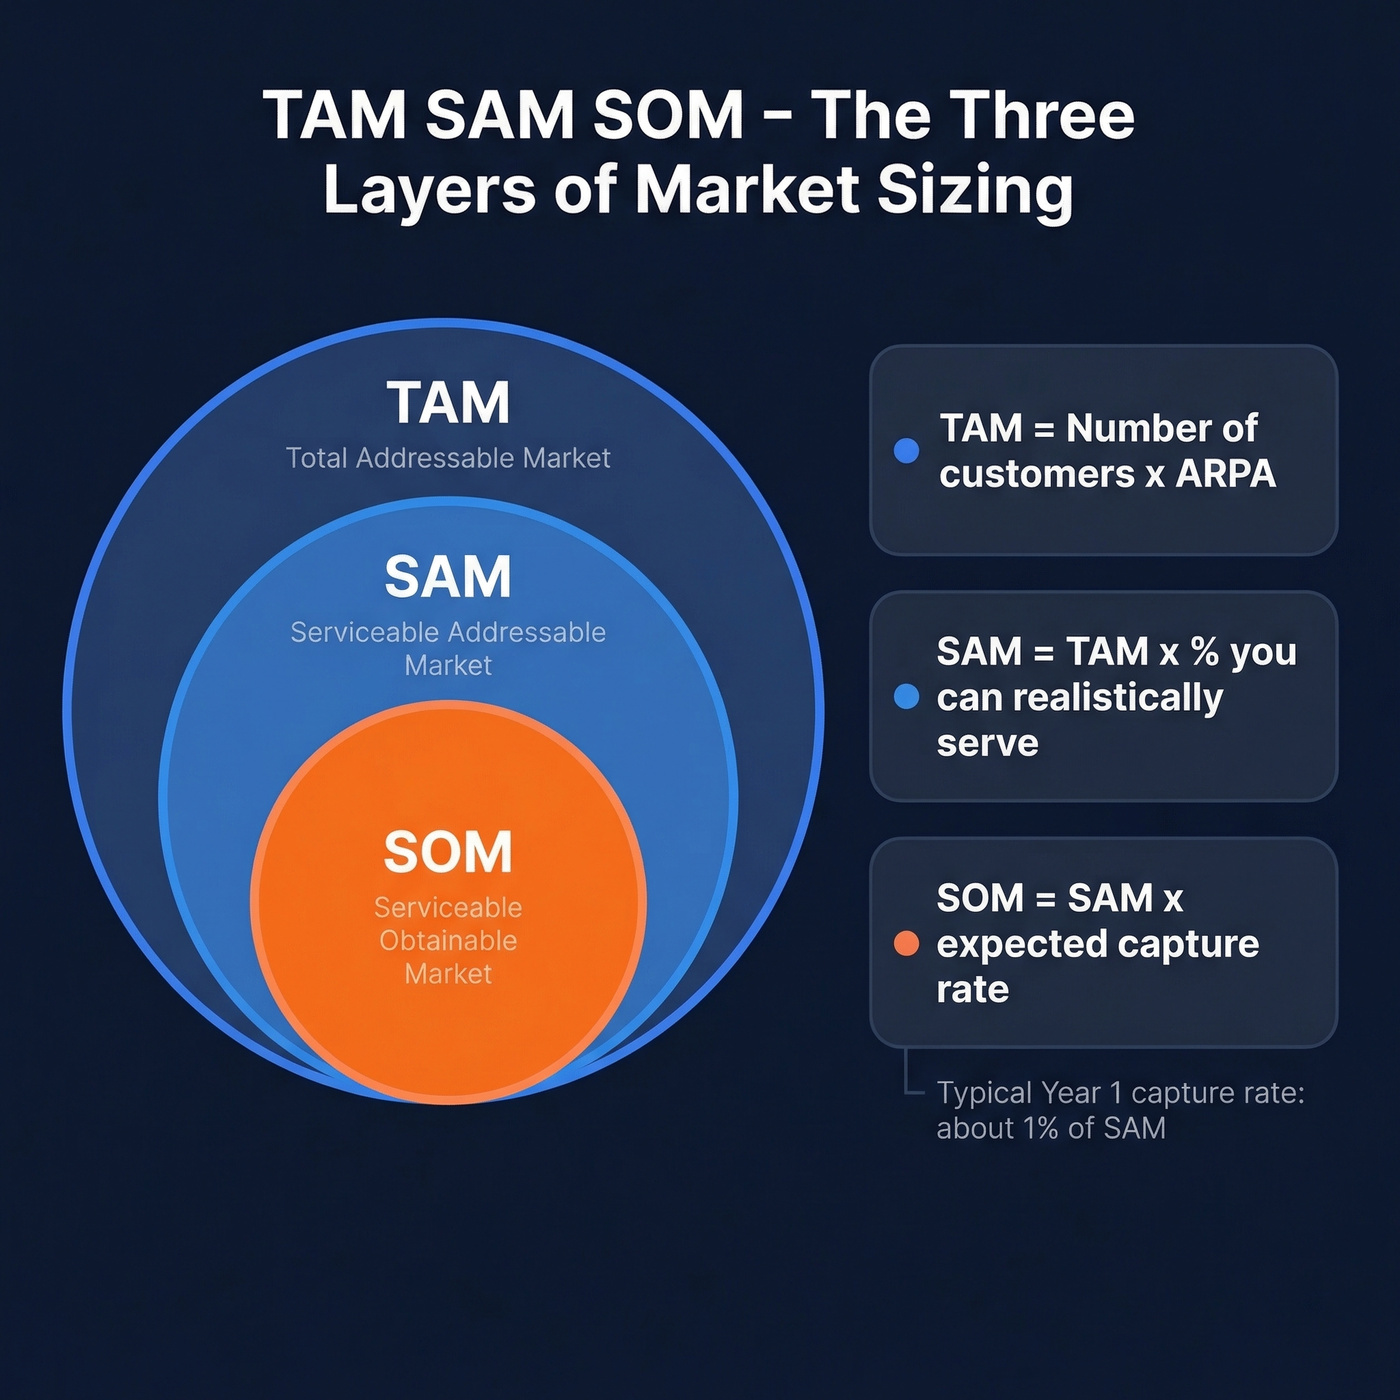
Think of three concentric circles. The outer ring is TAM - Total Addressable Market - the entire revenue pool if you had 100% market share and zero constraints. The middle ring is SAM - Serviceable Addressable Market - the slice you could realistically serve given your product, geography, and go-to-market. The inner circle is SOM - Serviceable Obtainable Market - what you'll actually capture in the next one to three years.
Here's how investors read them: TAM signals ambition. SAM signals focus. SOM signals execution credibility.
- TAM = number of potential customers x average revenue per account (ARPA)
- SAM = TAM x % you can realistically serve
- SOM = SAM x expected market share (often ~1% in Year 1, ~3% in Year 2, ~5% in Year 3)
Three Calculation Methods
Every market-sizing exercise uses one of three methods - or ideally, two triangulated against each other. We've walked through hundreds of these with founders, and the pattern is always the same: the method you pick shapes how credible your slide looks.
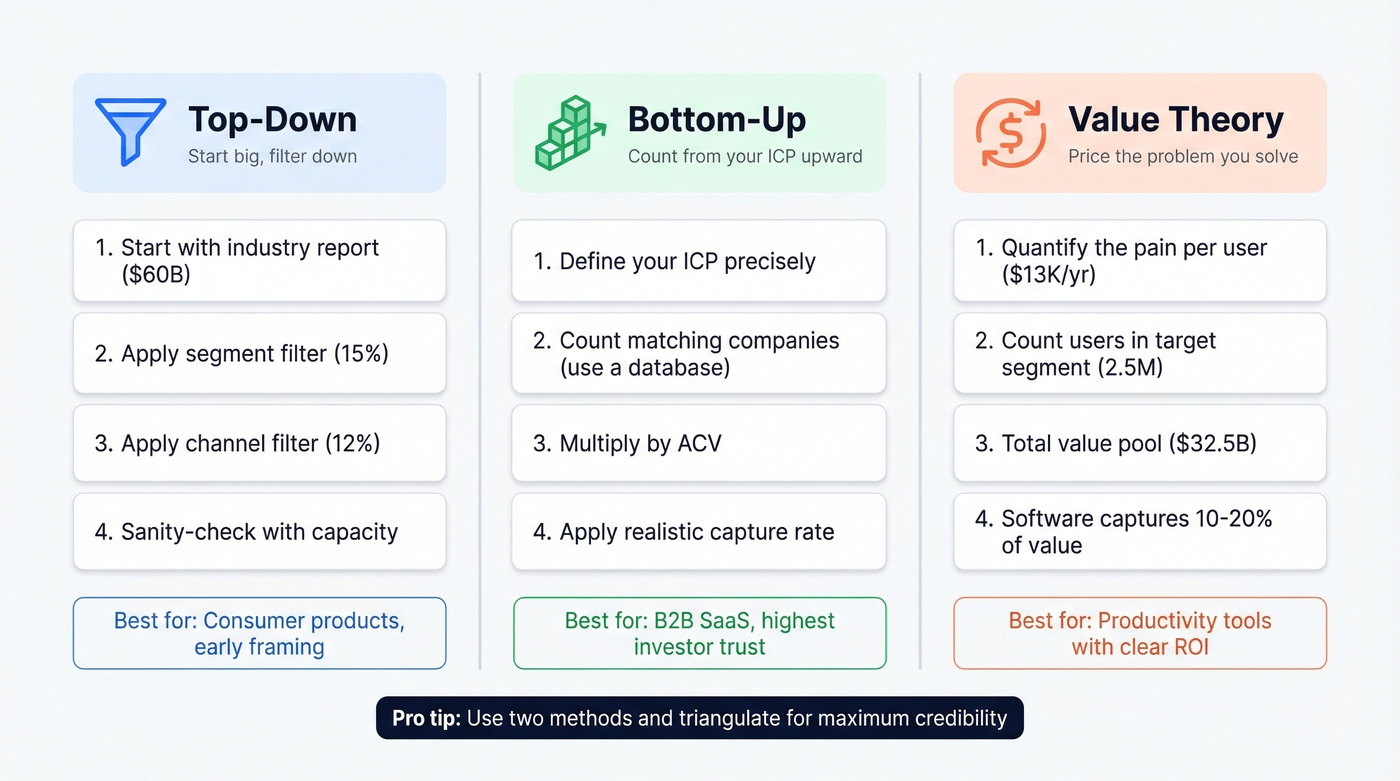
Top-Down (Consumer Product)
Start big, filter down. Say you're launching an organic, direct-to-consumer dog food brand in the US.
- Start with a big market number from an industry report.
- Apply a segment share ("organic/natural").
- Apply a channel share ("online DTC").
- Sanity-check against what you can actually sell in Year 1.
If the total US pet food market is $60B, the organic segment is 15%, and the DTC channel is 12%:
- TAM (segment) = $60B x 15% = $9B
- SAM (channel) = $9B x 12% = $1.08B
For SOM, don't "pick a percentage." Model capacity. If your Year 1 ad budget and fulfillment support $2.5M in revenue, that's your SOM.
Top-down is fast and great for framing, but it's only as good as the industry report you start with. Always triangulate with bottom-up.
Bottom-Up (B2B SaaS)
This is the method investors trust most. You start from your ICP and count upward.
Say you're building a compliance automation platform for mid-market fintech companies. Define your ICP - fintech firms with 100-1,000 employees in the US and EU. Count how many companies match. Multiply by your ACV.
- 45,000 matching companies x $25K ACV = $1.125B TAM
- Narrow to one region and one compliance regime: 8,000 companies
- 8,000 x $25K = $200M SAM
- Apply a 1% Year 1 capture rate (80 customers):
- 80 x $25K = $2M SOM
The hardest step is getting a real account count. Most founders guess - and investors can tell. A B2B database with 30+ filters lets you filter by industry, headcount, tech stack, revenue, and geography to get an actual number in minutes rather than extrapolating from a stale analyst report.
One thing SaaS founders often miss: your SAM should still be geographic even if anyone can technically sign up. Your GTM - language, support hours, payment methods, sales team time zones - limits where you'll actually win customers in Year 1.

Value Theory (Productivity Software)
This is the most under-used method, and the strongest for SaaS products with a clear ROI story.
You're building a meeting-scheduling tool for enterprise sales teams. Each rep spends 5 hours per week on scheduling - that's $250/week at a blended $50/hr cost, or $13,000/year per rep in time cost.
Assume there are 2.5 million reps in your target segment. The total value pool is:
- 2.5M x $13,000 = $32.5B/year in time cost
Software often captures 10-20% of the value it creates, so your TAM lands around $3.25B-$6.5B. SAM narrows to the subset matching your product constraints. SOM is what you can actually sell in the next 12-36 months given pipeline capacity.
Value theory works because it forces you to articulate why customers pay, not just how many exist.
Five Industry Examples With Real Numbers
Definitions are easy. Doing the math with real numbers is where founders get stuck. These five examples span different industries, each with the method and key assumptions spelled out so you can mirror the approach for your own deck.
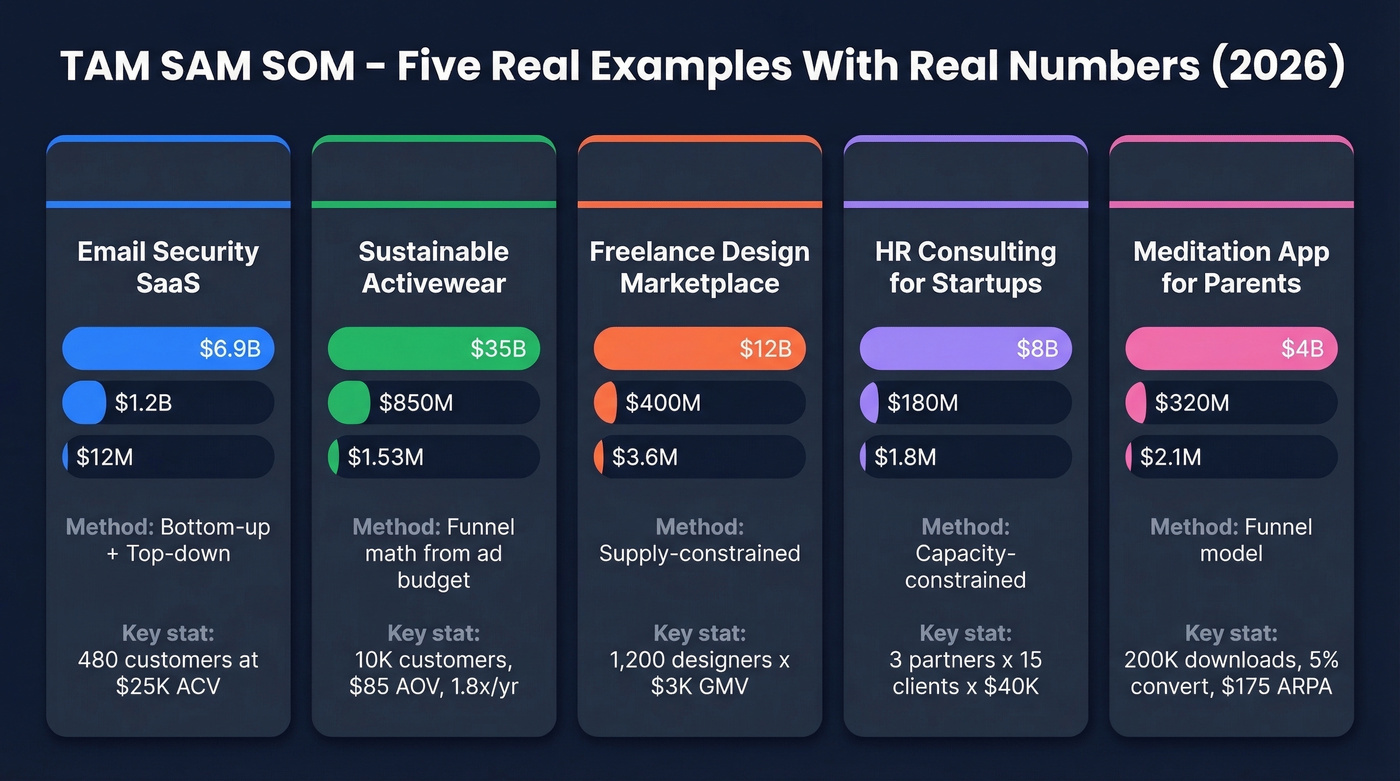
SaaS - Email Security Platform
| Layer | Value | Logic |
|---|---|---|
| TAM | $6.9B | Global email security market, 2026 est. |
| SAM | $1.2B | SMBs with 50-500 employees using cloud email (US + UK) |
| SOM | $12M | 1% capture rate, Year 1 |
Bottom-up check: ~48,000 target companies x $25K ACV = $1.2B SAM. At 1% capture (480 customers), SOM is $12M. The top-down and bottom-up numbers converge here, which is exactly what you want an investor to see.
E-Commerce - Sustainable Activewear
This one works best as a funnel calculation, so forget the table and follow the money backward.
For SOM, work from your ad budget:
- $300K in Year 1 spend at a $30 CPA acquires 10,000 customers
- At an $85 AOV and 1.8 purchases per year:
- 10,000 x $85 x 1.8 = $1.53M in Year 1 revenue
This bottom-up funnel math is far more credible than "if we get 0.003% of the market."
Marketplace - Freelance Design Platform
Marketplace SOM is almost always supply-constrained. Lead with that number.
If you acquire 1,200 designers in Year 1 averaging $3K in annual platform GMV, your SOM is $3.6M. The supply side is your bottleneck - and showing investors you understand that earns more credibility than any TAM number ever will.
B2B Services - HR Consulting for Startups
Three partners. Fifteen clients each. $40K average engagement. That's your entire SOM calculation: $1.8M.
We've seen dozens of pitch decks where founders start with a giant market number and then wave their hands. Don't do that. For a services business, SOM is entirely capacity-constrained, and investors know it. Count your partners, multiply by max active clients, multiply by average engagement value. Done.
Consumer App - Meditation for Parents
Model your funnel:
- 200K downloads in Year 1 x 5% premium conversion x $175 annual ARPA = $1.75M
- Plus ad revenue of $350K = $2.1M SOM
Notice how niche targeting (parents only) slashes SAM versus TAM. That's normal and healthy - it shows focus, not weakness.
Your bottom-up market sizing is only as good as your account count. Prospeo's B2B database lets you filter 300M+ profiles by industry, headcount, tech stack, geography, and 30+ other attributes - so you get an actual number of target companies, not a guess extrapolated from a stale analyst report.
Get a real ICP count in minutes, not a fabricated one in hours.
What Investors Actually Look For
Here's the thing: investors don't fund TAM. They fund SOM. Everything else is context.
When a partner at a seed fund looks at your market-sizing slide, they're running a mental model. TAM tells them whether the market is big enough to produce a venture-scale outcome. SAM tells them whether you understand where to focus. SOM tells them whether you've actually thought about execution - how many reps you'll hire, what your CAC will be, how many deals you can close in 12 months.
| Metric | What It Signals | Investor Question |
|---|---|---|
| TAM | Ambition | "Could this be a $1B+ company?" |
| SAM | Focus | "Do they know their beachhead?" |
| SOM | Execution | "Can they actually hit these numbers?" |
If your Year 1 goals assume capturing 5% of SAM without proof, it raises eyebrows. SOM should be grounded in bottom-up assumptions - CAC, pipeline capacity, conversion rates, team size.
Some founders go further, and the smart ones do: if your SOM is $5M with 25% EBITDA margins, that's $1.25M EBITDA. At an 8x exit multiple, that's a $10M outcome from Year 1 alone - and investors can model the trajectory from there. Showing this math signals you think like an operator, not just a storyteller.
Stage matters too. At pre-seed, investors want to see you understand your market directionally - a defensible bottom-up estimate beats a polished top-down slide with fake precision. By Series A, you need bottom-up math with defensible assumptions and ideally some actual revenue data validating your SOM projections.
Realistic SOM Benchmarks
One of the most common questions founders ask is "what's a realistic SOM percentage?" It depends on your GTM model, but there are useful benchmarks.
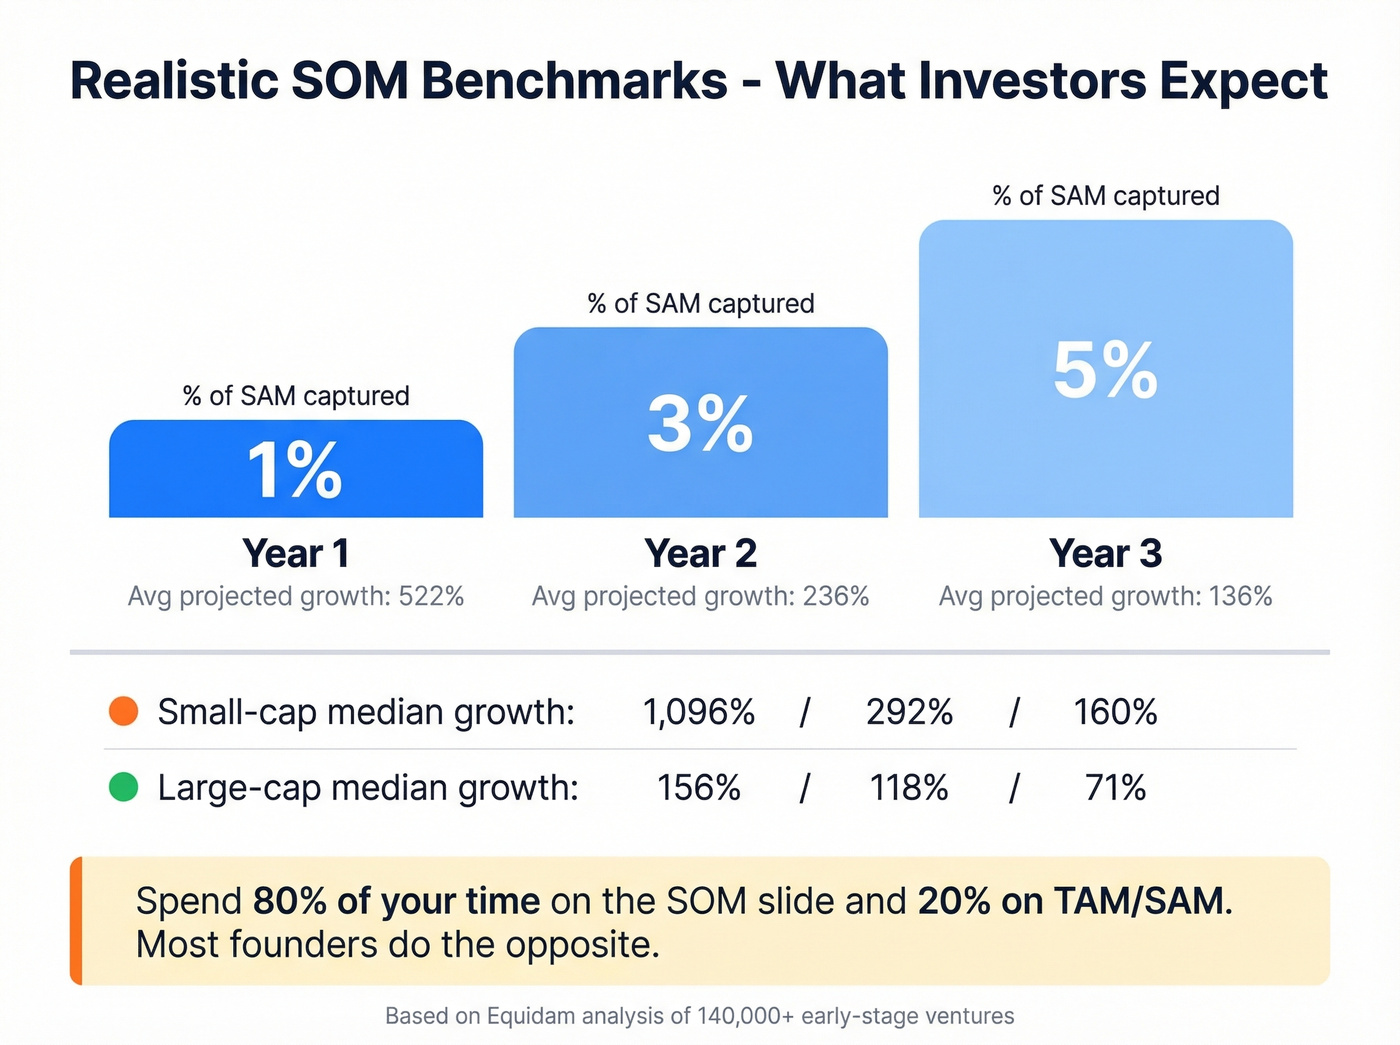
A common progression is 1% of SAM in Year 1, 3% in Year 2, 5% in Year 3. These aren't laws of physics - they're sanity checks. A PLG product with viral loops will exceed these; a sales-led enterprise product with 12-month cycles will fall below them initially.
For context, Equidam analyzed 140,000+ early-stage ventures and found average projected growth rates of 522% in Year 1, 236% in Year 2, and 136% in Year 3. These are forecasts, not realized outcomes - but they tell you what the median pitch deck looks like.
| Benchmark | Year 1 | Year 2 | Year 3 |
|---|---|---|---|
| SOM % of SAM | ~1% | ~3% | ~5% |
| Avg. projected growth | 522% | 236% | 136% |
| Small-cap median growth | 1,096% | 292% | 160% |
| Large-cap median growth | 156% | 118% | 71% |
If your SOM implies growth rates wildly above these ranges, revisit your assumptions. You're either in a genuinely explosive market or you're fooling yourself.
Spend 80% of your time on the SOM slide and 20% on TAM/SAM. Most founders do the opposite, and it shows.
Five Mistakes That Kill Your Slide
1. The 1% Fallacy. "If we capture just 1% of a $100B market, that's $1B." Investors read this as laziness, not ambition. Replace it with a capacity-based SOM that shows how you'll capture share.
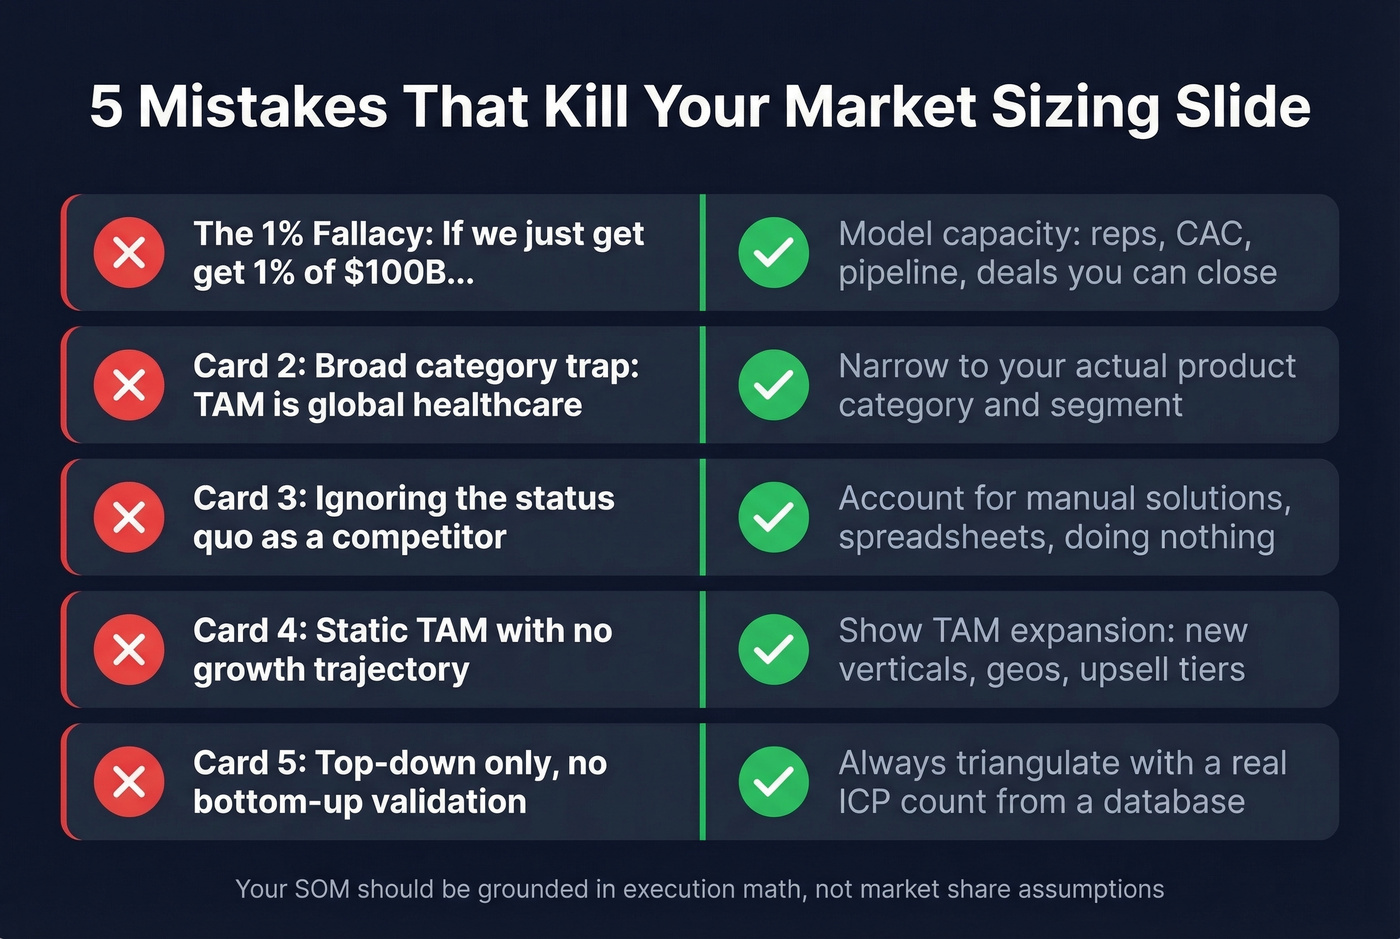
2. The broad-category trap. Saying your TAM is "global healthcare" when you're building a narrow diagnostics tool destroys credibility instantly. Narrow your TAM to the actual category your product competes in.
3. Ignoring the status quo. Excel spreadsheets, interns, and "doing nothing" are your biggest competitors in most markets. If 60% of your target accounts solve the problem manually, your SAM needs to account for that adoption barrier.
4. Static TAM. Strong founders show how TAM expands over time. If your product has a natural expansion path - new verticals, new geos, upsell tiers - show the TAM trajectory, not just a snapshot.
5. No bottom-up validation. A top-down number without bottom-up validation is a guess. Triangulate both methods and explain any discrepancies. If your top-down says $500M and your bottom-up says $180M, the bottom-up is probably closer to reality - and investors will respect you for saying so.
Where to Find the Data
The number-one complaint we hear from founders doing market sizing: "Where do I actually get the numbers?" Here's a practical checklist.
Free sources for market-level data:
- US Census Bureau and Bureau of Labor Statistics - industry employment, business counts, consumer spending
- SEC filings (10-K reports from public competitors) - revenue breakdowns by segment
- Industry associations - many publish annual market reports for free
- HubSpot's TAM SAM SOM breakdown - useful for methodology
Paid sources for deeper data:
- Statista, IBISWorld - paid subscriptions with varying price tiers
- Gartner, Forrester, IDC - enterprise-grade research; check if your accelerator or university has access before paying
B2B account counts: For B2B market sizing, you need an actual count of companies matching your ICP - not an estimate. Prospeo's B2B database lets you filter by industry, size, tech stack, and 30+ other criteria. The free tier (75 emails/month) is enough to validate your market-sizing assumptions before committing to a paid plan.
Consumer data: Census data plus a couple of solid industry reports usually gets you most of the way there. For niche segments, look for trade association surveys and public company earnings calls where executives discuss market size.
You just built your TAM SAM SOM slide. Now build the pipeline to hit that SOM number. Prospeo gives you verified emails (98% accuracy) and direct dials for every account in your serviceable market - at $0.01 per email, with data refreshed every 7 days.
Turn your SOM from a pitch deck number into actual revenue.
FAQ
What's the difference between TAM, SAM, and SOM?
TAM is total market demand for your product category. SAM is the segment you can realistically serve given product, geography, and go-to-market constraints. SOM is what you'll actually capture in one to three years. Think concentric circles narrowing from ambition to execution.
What's a realistic SOM percentage?
A common early-stage benchmark is ~1% of SAM in year one, growing to ~3-5% by year three. Anything above 5% in year one needs strong justification - proven traction or a genuinely underserved niche with minimal competition.
Do I need TAM SAM SOM for a pre-seed pitch?
Yes, but the bar is lower than you think. A defensible bottom-up estimate with clear assumptions beats a polished top-down slide from a single analyst report. Most investors still expect at least a directional market-sizing framework, even at the earliest stages.
Should I use top-down or bottom-up?
Both. Bottom-up is more credible because it's grounded in countable customers and real pricing. Top-down provides context. Triangulate the two - if they're within the same order of magnitude, you're in good shape.
How do I count target companies for bottom-up sizing?
Use a B2B database to filter by ICP criteria - industry, headcount, revenue, tech stack, geography - and get an actual account count. Multiply your filtered count by ACV for a defensible SAM.