Top-Down TAM: The Fast Way to Size a Market (and the Fast Way to Get It Wrong)
In CB Insights' analysis of 101 startup post-mortems, 42% cited "no market need" as a reason for failure. Not a bad product, not a team meltdown - the market simply wasn't there. Top-down TAM is the fastest way to figure out if your market is real or if you're building a company on a fantasy number pulled from an analyst report.
The short version: top-down TAM takes broad market data, runs it through filters, and spits out your addressable slice. It's fast but fragile. Always present SAM and SOM alongside it - investors dismiss TAM-only slides - and validate with a bottom-up analysis. If the two numbers converge, you've got a credible story.
What Is Top-Down TAM?
Top-down TAM starts with the biggest number you can find - total industry revenue, total population in a segment, total economic output - and filters it down through layers of assumptions until you reach your addressable market. Broad at the top, narrow at the bottom. This is the default in analyst reports and early-stage pitch decks alike.
The bottom-up approach works the opposite direction: count actual customers, multiply by your price, build up. A third approach, value theory, estimates what buyers would pay based on the value your product creates.
Top-down is best when you're early-stage, need a back-of-the-envelope number fast, or you're sizing a large diversified market where counting individual customers isn't practical yet. It's the starting point, not the finish line.
How to Calculate Top-Down TAM
The Formula
The core math is deceptively simple. Wall Street Prep frames it as:
Forecasted Revenue = Market Size x Market Share Assumption (%)
But here's where people get lazy. You need to segment your customer universe before applying that share assumption. Wall Street Prep's walkthrough uses a segmented universe - 2,000 large enterprises, 8,000 SMEs, and 40,000 SMBs - to show why one blanket assumption misleads. Segment first, then price each segment. This matters especially for B2B market sizing, where deal sizes vary dramatically across company tiers and a single average price will overcount small buyers while undercounting enterprise ones.
WeWork's TAM Funnel
The WeWork S-1 filing is one of the cleanest top-down examples ever published - and one of the most instructive cautionary tales.
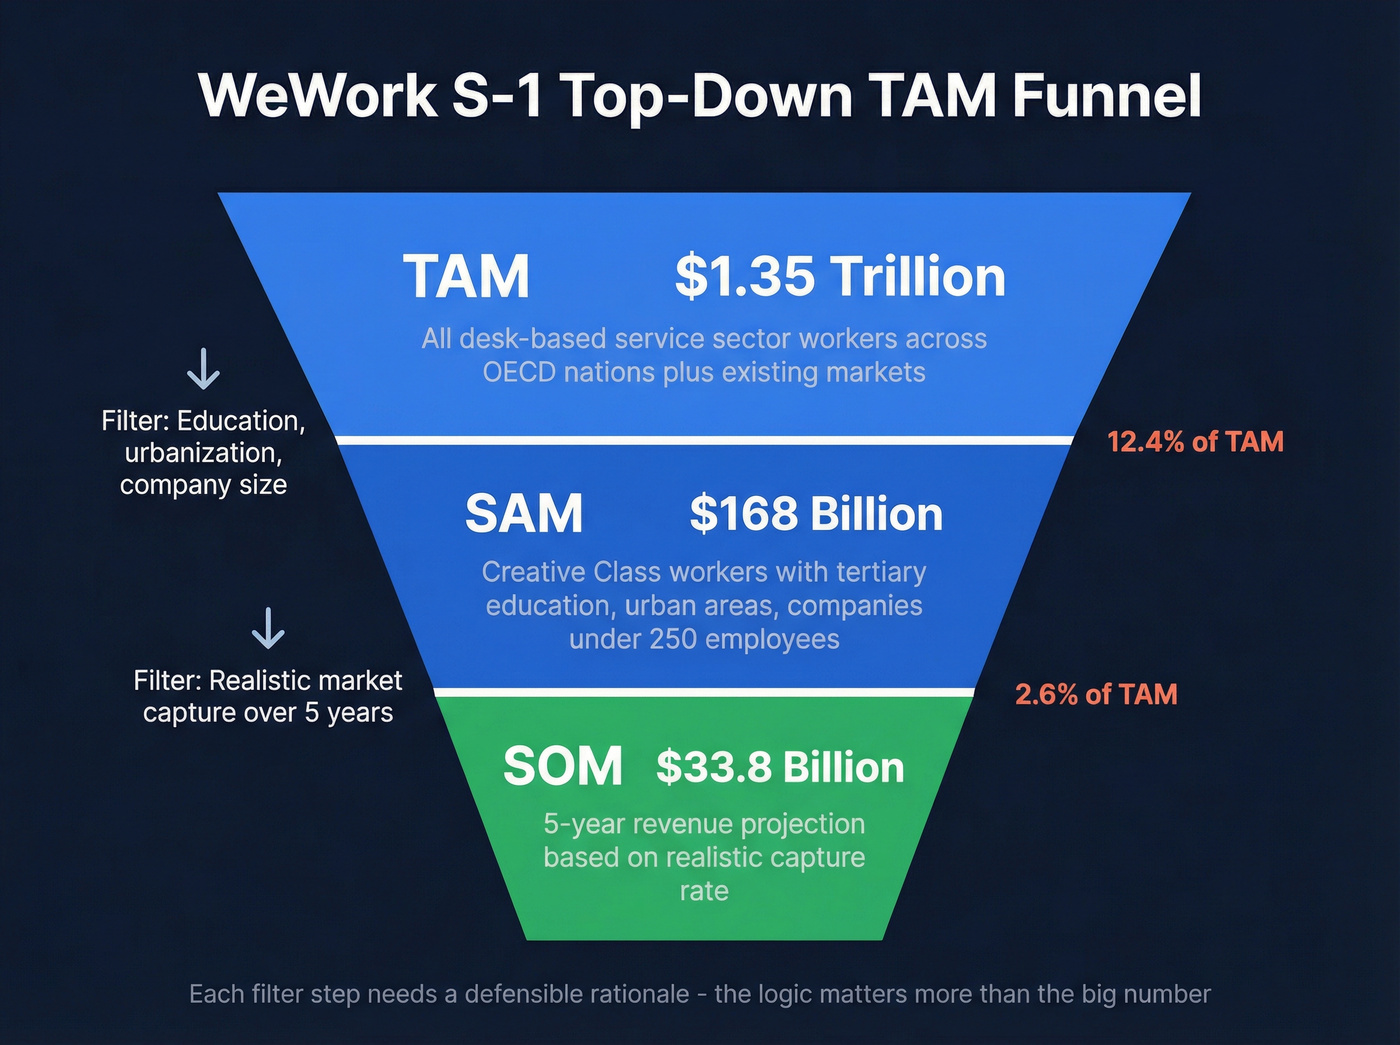
They started with all desk-based service sector workers across OECD nations plus their existing markets, producing a TAM of $1.35 trillion. Then they filtered: only "Creative Class" workers with tertiary education, living in urban areas, at companies with fewer than 250 employees. That narrowed to a SAM of $168 billion - just 12.4% of TAM. Their five-year revenue projection landed at a SOM of $33.8 billion, roughly 20.9% of SAM and about 2.6% of the original TAM.
Each filter step had a defensible rationale. That's what makes the top-down method work: not the big number, but the logic behind each reduction. We know how the WeWork story ended, but the sizing methodology itself was solid - the execution and business model were the problems.
For something simpler: a graduate recruitment agency targeting London. Start with London's population of 8.9 million, filter to the 18-24 age bracket (11.6%), and you get roughly 1,032,399 potential candidates. Layer in employment status, industry, and willingness to use a recruitment service to reach SAM and SOM.
Where to Get Market Data
| Source | What It Covers | Access |
|---|---|---|
| OECD | Economic data | Free |
| UN | Population, demographics | Free |
| World Bank | Industry, development | Free |
| CIA World Factbook | Country-level stats | Free |
| Statista | Industry sizing | ~$199+/mo |
| IBISWorld | Industry reports | ~$1,000-1,500/report |
| Gartner | Tech market sizing | ~$30,000-$100,000+/yr |
| Forrester | Tech market sizing | ~$25,000-$75,000/yr |
Gartner charging $30k+ a year is genuinely frustrating when you're a seed-stage founder trying to size a market. Before paying out of pocket, check if your accelerator, university, or co-working space has institutional subscriptions. Many do, and nobody advertises it.
Data-as-a-service platforms are also emerging as more affordable alternatives. Tools that aggregate firmographic and intent data let you build market estimates from live datasets rather than static PDF reports - and they double as prospecting tools once you move past the sizing phase.
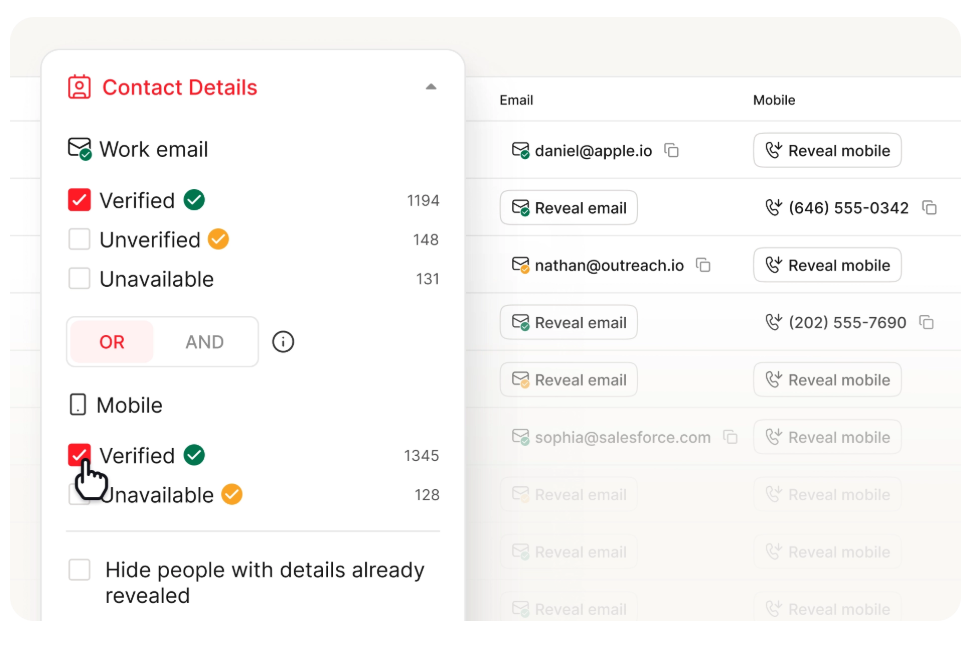
You don't need a $30K Gartner subscription to size your market. Prospeo's database of 300M+ profiles with 30+ filters - industry, headcount, revenue, funding, technographics - lets you build a live market estimate from real company data, then convert it directly into a prospect list with 98% verified emails.
Stop sizing markets from static PDFs. Build your TAM from live data.
Top-Down vs. Bottom-Up TAM
| Top-Down | Bottom-Up | |
|---|---|---|
| Speed | Fast | Slow |
| Data needed | Industry reports | Unit economics + customer counts |
| Investor credibility | Lower | Higher |
| Best for | Early validation | Pitch decks, fundraising |
| Risk | Inflated numbers | May miss expansion |
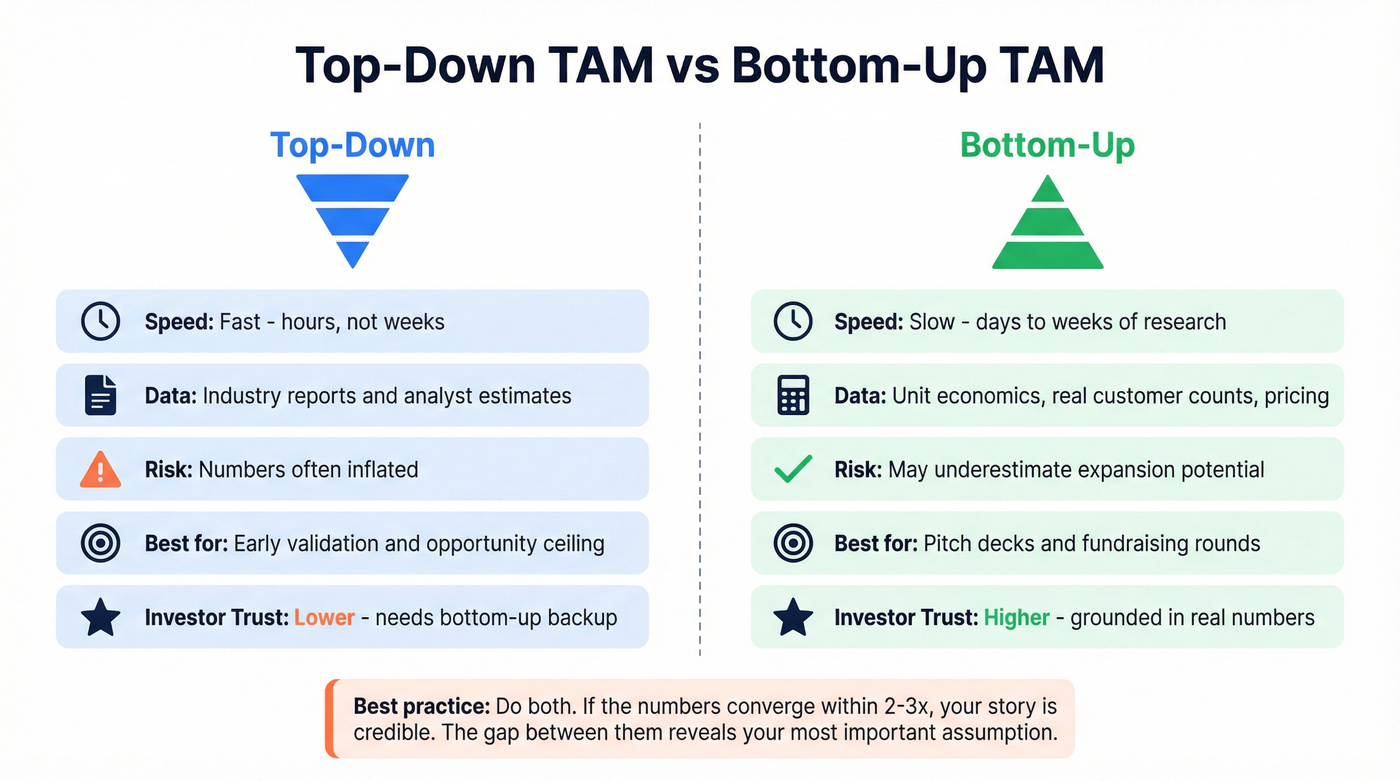
Let's be honest: if you only have time for one, do bottom-up. A bottom-up calculation forces you to ground every assumption in real unit economics - how many customers exist, what they'll pay, and how often they buy. If you have time for two, do both and see if they converge.
In our experience, the gap between top-down and bottom-up estimates usually reveals the most important assumption you haven't questioned. When a top-down estimate says $500M and your bottom-up says $80M, one of your assumptions is badly wrong - and finding which one will teach you more about your market than either number alone. The consensus on r/startups and r/venturecapital threads is the same: show both numbers, explain the delta, and you'll earn more credibility than a single polished figure ever could.
The distinction matters even more in B2B vs B2C. B2B markets typically have fewer buyers at higher price points, which makes bottom-up analysis more tractable - you can actually count the companies. B2C markets often rely more heavily on top-down because the buyer universe is too large to enumerate.
Three Mistakes That Kill Credibility
The "Just 1%" Fallacy
"If we capture just 1% of this $50 billion market..." Every VC has heard this line. Every VC tunes out immediately after.
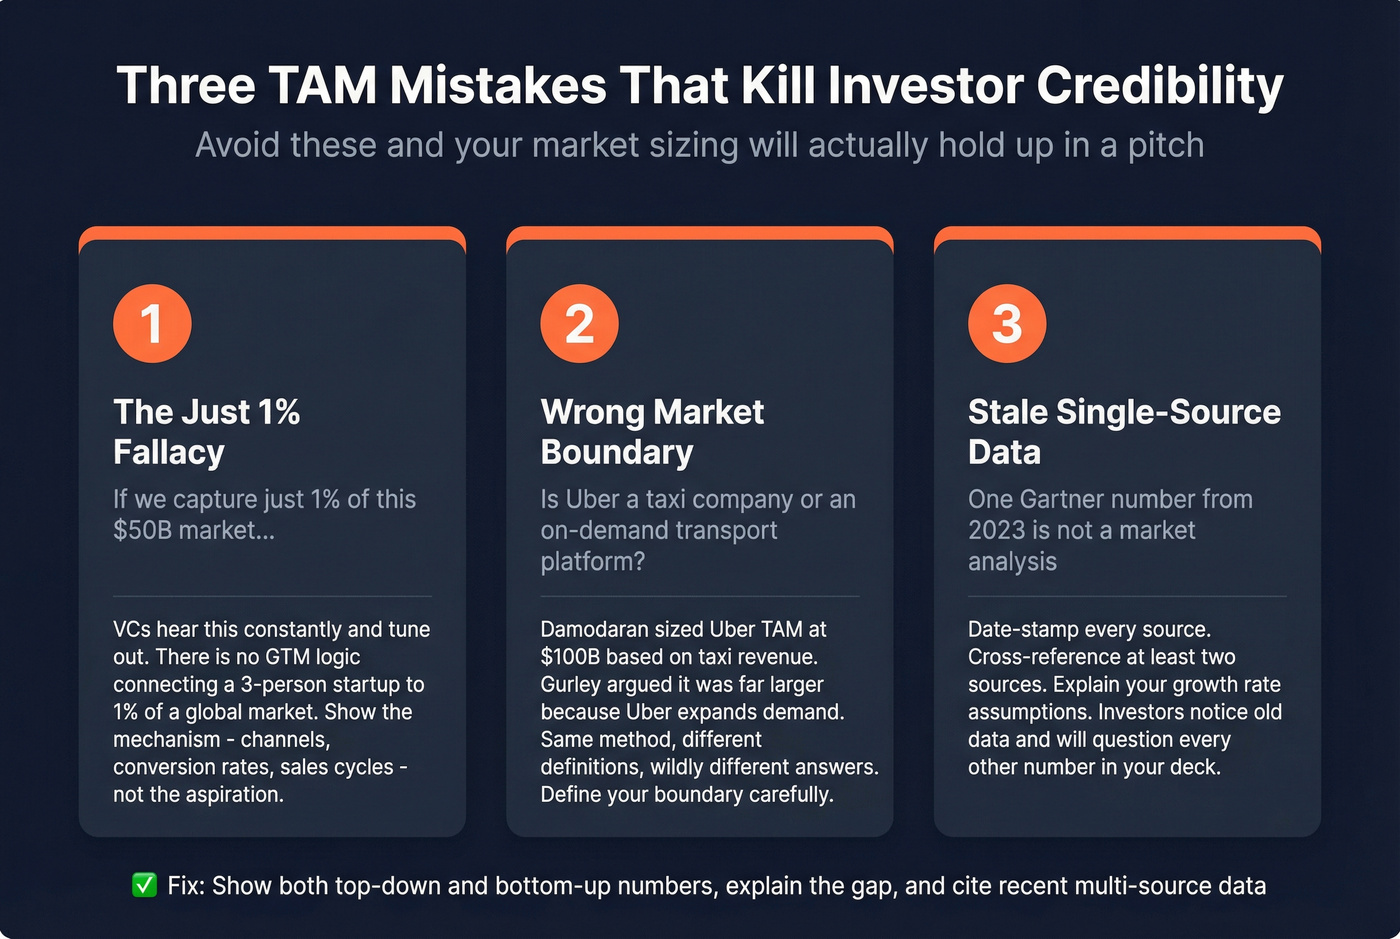
The problem isn't the math - it's the absence of a defensible path. There's no GTM logic connecting your 3-person startup to 1% of a global market. Show the mechanism, not the aspiration. Name the channels, the conversion rates, the sales cycle length. That's what turns a fantasy into a forecast.
Market Definition Risk
The famous Damodaran vs. Gurley debate over Uber's TAM illustrates this perfectly. Damodaran valued Uber's TAM at roughly $100 billion based on existing taxi and limo revenue. Gurley argued that definition was far too narrow - Uber wasn't replacing taxis, it was expanding demand for on-demand transportation. Same method, different market definitions, wildly different answers. Your total addressable market is only as good as your market boundary.
If your average deal size is under $15k, you probably don't need a $1B+ TAM to build a great business. A $200M TAM with a clear path to 5% capture is a stronger pitch than a $5B TAM with hand-waving. VCs who only fund billion-dollar TAMs aren't the only VCs.
Stale Single-Source Data
Grabbing one Gartner number from 2023 and building your entire pitch around it is a recipe for investor skepticism. Markets shift. Date-stamp every source, cross-reference at least two, and explain your growth rate assumptions.
We've seen founders present three-year-old market data as current - investors notice, and they'll question every other number in your deck once they catch it. This is particularly risky when sizing regional markets like DACH or Southeast Asia, where local economic conditions can diverge sharply from global trends.
From TAM to Prospect List
You've sized the market. Now what?
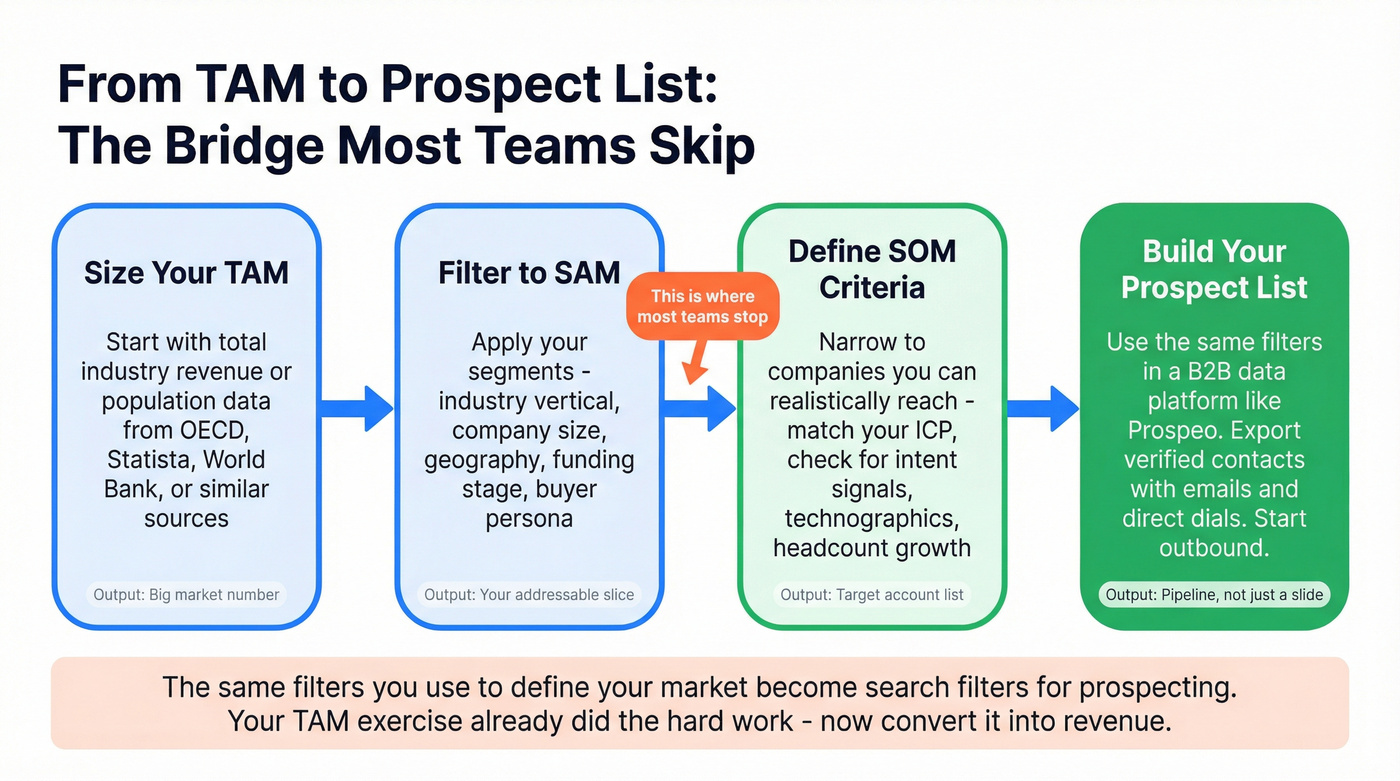
This is where most B2B market sizing exercises stall. The number goes on a slide, and nobody turns it into pipeline. But the same filters you used to define your market - industry, company size, geography, funding stage - become search filters in a sales prospecting platform. Skip this step if you're purely doing academic market research or investor modeling with no near-term outbound plans, but for anyone building pipeline, the TAM-to-list bridge is where sizing becomes revenue.
Prospeo's database covers 300M+ professional profiles with 30+ search filters including intent data tracking 15,000 topics, technographics, headcount growth, and funding data. You can take your TAM segment criteria, plug them directly into a search, and export a verified contact list with 98% email accuracy and direct dials included. The free tier gives you 75 verified emails a month - enough to test whether your TAM segments actually contain reachable buyers before you commit budget.

Your top-down TAM is only useful if you can turn it into pipeline. Once you've defined your SAM, Prospeo lets you filter 300M+ profiles by company size, industry, job title, buyer intent, and 25+ other criteria - then export verified contacts at $0.01 per email. No annual contracts, no sales calls.
Go from market sizing to booked meetings without switching tools.
Top-Down TAM FAQ
Is Top-Down or Bottom-Up Better for Investors?
Bottom-up carries more weight because it's grounded in observable unit economics - real customer counts, real pricing, real conversion rates. Top-down TAM is useful for establishing the opportunity's ceiling, but most VCs expect both methods presented side by side. If the numbers converge within 2-3x, your story is credible.
What's a Good TAM for a Startup Raising VC?
Most VCs want $1B+ TAM for SaaS, but TAM alone doesn't close a round. They evaluate LTV:CAC, payback period, and net revenue retention alongside market size. A $500M TAM with proven willingness to pay and a clear capture path beats a $10B TAM with no mechanism to reach buyers.
How Do I Turn My TAM Into Actual Leads?
Filter your TAM segments by industry, company size, geography, and funding stage using a B2B data platform. Apply the same criteria you used to size your market - now you've got a prospect list, not just a number. A free tier on a tool like Prospeo (75 verified emails/month) lets you validate that your segments contain real, reachable buyers before scaling outbound.
When Should I Use Bottom-Up Instead?
Use bottom-up when you have enough data to count real customers and price real deals - typically after initial customer discovery or when you have early revenue. If you're pre-revenue and entering a new category, start with a top-down calculation to establish the opportunity, then layer in bottom-up data as you learn more about your actual buyer universe.