Weighted Pipeline: What It Is, Why It Breaks, and How to Fix It
It's week 8 of the quarter. Your VP of Sales pulls up the pipeline report, squints at a $2.1M weighted number, and tells the board you're on track. Three weeks later, you miss by 30%.
Four in five sales and finance leaders missed a quarterly forecast in the past year, and over half missed two or more times. That's not a rounding error. That's a systemic problem with how teams build their numbers.
A weighted pipeline is the simplest way to turn a bloated opportunity list into a realistic revenue estimate. But simple doesn't mean accurate - not without the right inputs. The #1 fix: stop guessing probabilities and calibrate them from at least two quarters of closed-deal CRM data.
What Is a Weighted Pipeline?
This forecasting method multiplies each deal's value by its probability of closing based on its current stage. Sum all weighted values across open deals and you get an expected revenue estimate that strips the optimism out of a raw pipeline number.
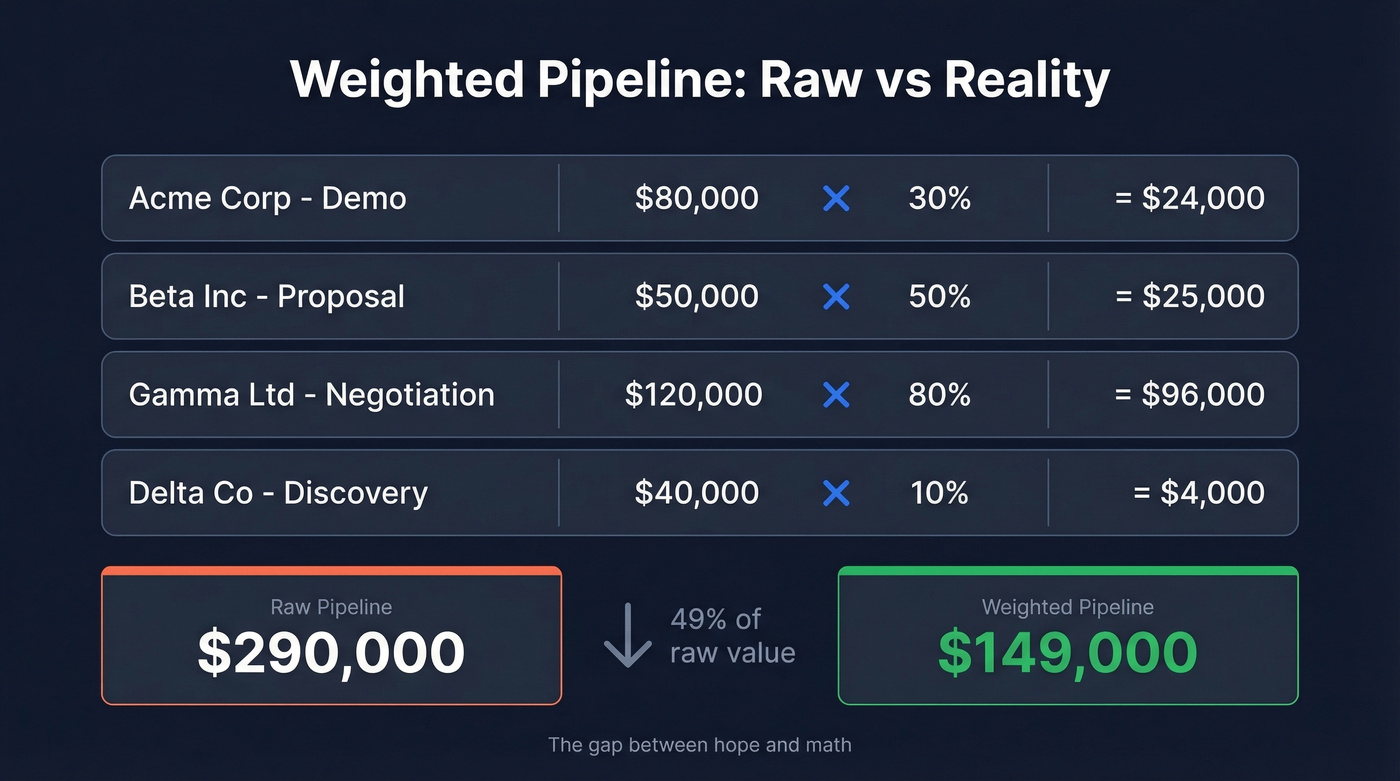
Weighted Value = Deal Value x Stage Probability
| Deal | Stage | Value | Probability | Weighted Value |
|---|---|---|---|---|
| Acme Corp | Demo | $80,000 | 30% | $24,000 |
| Beta Inc | Proposal | $50,000 | 50% | $25,000 |
| Gamma Ltd | Negotiation | $120,000 | 80% | $96,000 |
| Delta Co | Discovery | $40,000 | 10% | $4,000 |
| Total | $290,000 | $149,000 |
Your raw pipeline says $290K. The weighted view says $149K. That gap is the whole point - it's the difference between what you hope and what the math says. Looking at unweighted pipeline coverage alone, the raw opportunity amount before any probability adjustment, would suggest you're in great shape. The probability-adjusted view tells a very different story.
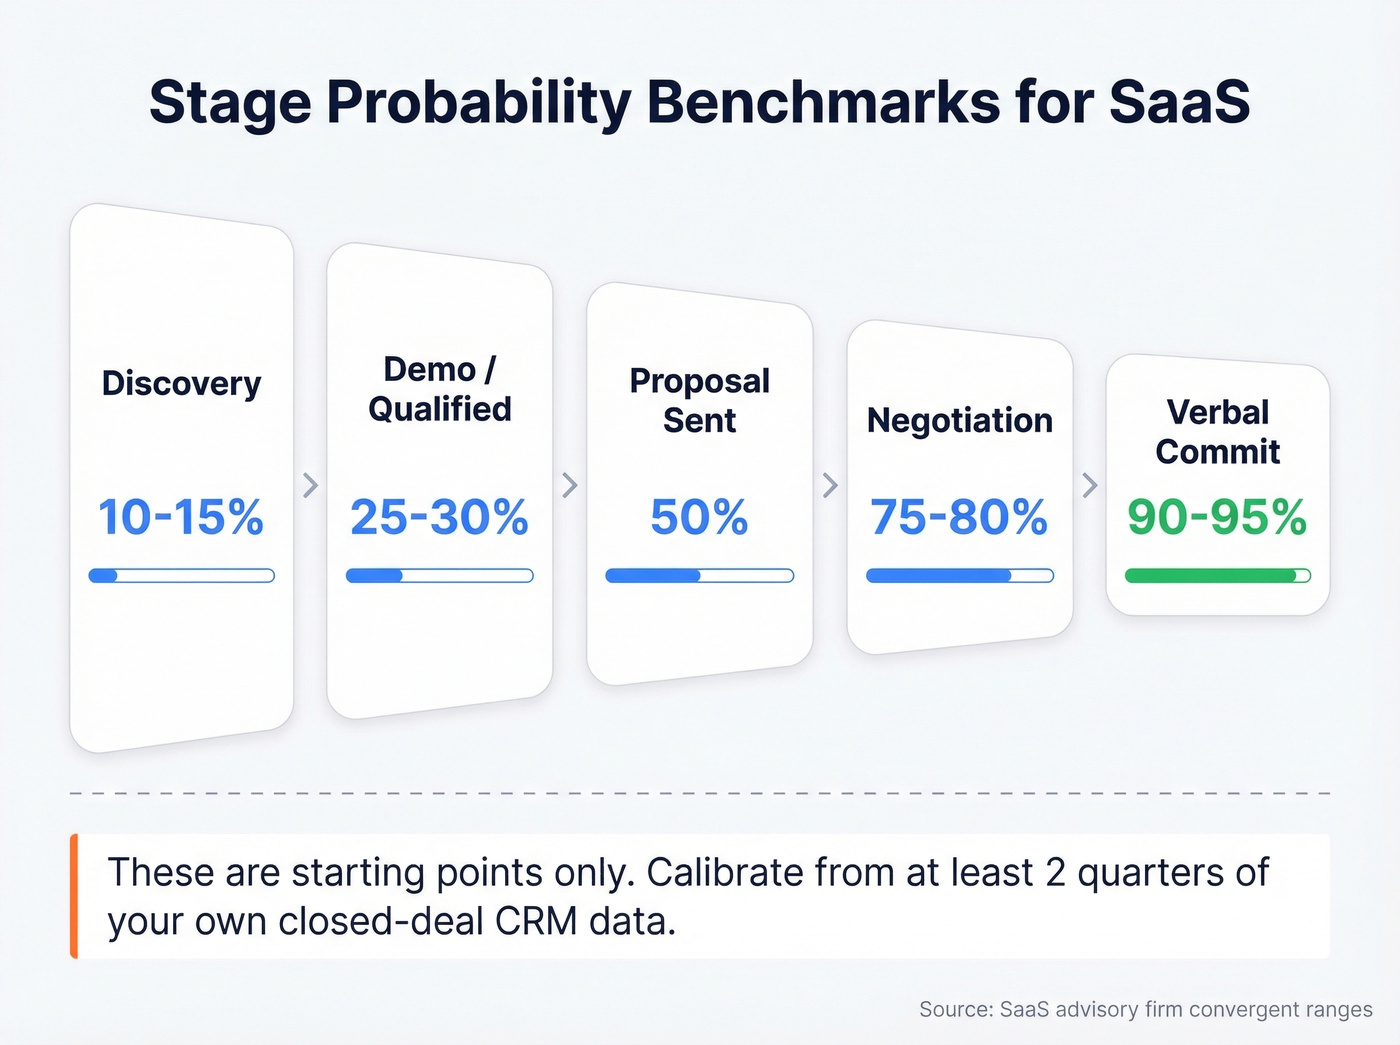
Sample Stage Probabilities
These are convergent ranges across SaaS advisory firms and CRM defaults. Use them as a starting point, then calibrate from your own data:
| Stage | Probability |
|---|---|
| Discovery | 10-15% |
| Demo / Qualified | 25-30% |
| Proposal Sent | 50% |
| Negotiation | 75-80% |
| Verbal Commit | 90-95% |
Why Most Forecasts Are Wrong
The formula is simple. The inputs are where everything falls apart.
Made-up probabilities. Most teams never calibrate stage probabilities from actual close data. They pick round numbers that feel right - 20%, 50%, 80% - and never revisit them. Those numbers are fiction.
Stale CRM records. A deal sitting in Proposal for six months isn't a 50% deal. It's dead. But it's still inflating your forecast because nobody moved it. We've seen reps leave probabilities at 90% after weeks of no contact - a pattern that quietly poisons every downstream number.
Large-deal skew. Your top AE has a $300K deal in Negotiation at 80%. It's been there for 11 weeks. The contact's email bounced last Tuesday. One deal shouldn't have that much power over a quarterly number.
No segmentation. New business, expansion, and renewal deals close at different rates. Treating them all the same destroys your probabilities.
Rep sandbagging and inflation. Some reps lowball to look like heroes when they close. Others inflate to keep managers off their backs. Both wreck the model. In r/SalesOperations, analysts with irregular deal cycles regularly question whether stage-based forecasting even works for their motion - and the answer is usually that their inputs, not the method, are broken.
Ignoring deal age. A deal that entered Negotiation yesterday and one that's been there for 90 days don't have the same probability. Time-in-stage matters, and most CRMs don't account for it.
Here's the thing: pipeline accuracy starts upstream with contact data quality. If your reps are building pipeline on bounced emails and outdated phone numbers, your stage conversion rates are garbage before you even start forecasting. Prospeo verifies emails at 98% accuracy on a 7-day refresh cycle, so deals entering the pipeline are built on real contact data from day one. If you're tightening the top of funnel, start with proven sales prospecting techniques and a clean lead generation workflow.

Garbage data in, garbage forecast out. If reps build pipeline on bounced emails and dead numbers, your stage probabilities are fiction before you even calculate weighted value. Prospeo delivers 98% email accuracy on a 7-day refresh cycle - so every deal entering your pipeline is built on verified contact data.
Stop forecasting on top of bad data. Start with contacts that actually connect.
How to Calibrate Stage Probabilities
Stop guessing. Here's the data-driven approach we recommend:
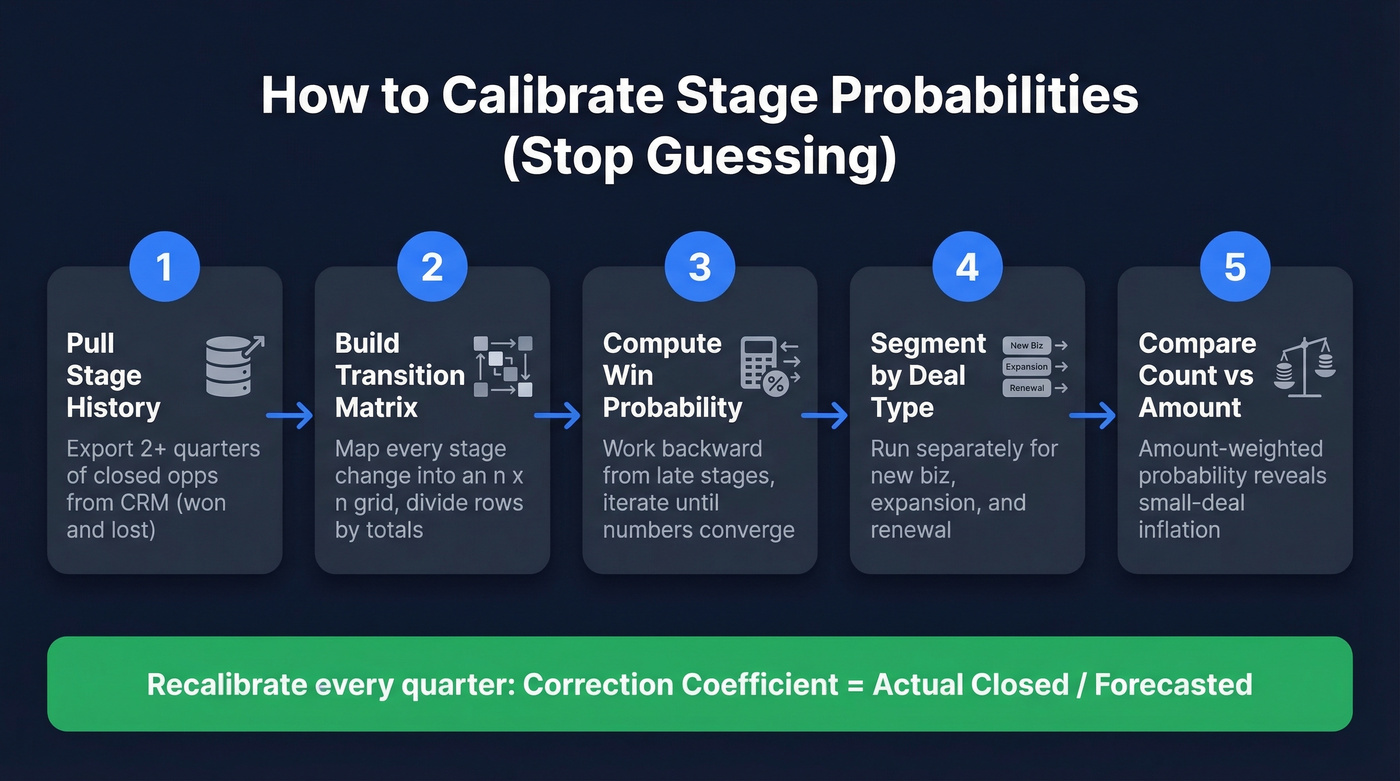
1. Pull stage history from your CRM. In Salesforce, use the Opportunity Stage History object. You need at least two quarters of closed opportunities, both won and lost. Two-thirds of leaders cite reporting systems that can't access historical CRM data as a roadblock - which is exactly why most teams never do this.
2. Build a stage transition matrix. Map every stage-change event into an n x n grid (Stage From x Stage To). Divide each row by its total to get transition probabilities.
3. Compute conditional win probability per stage. Work backward from your latest stages. If Stage 5 has a 40% direct-win rate and a 50% chance of advancing to Stage 6 (which has a 70% win rate), then Stage 5's true win probability is 40% + (50% x 70%) = 75%. Iterate until the numbers converge.
4. Segment by deal type. Run this separately for new business, expansion, and renewal. Lump them together and you destroy accuracy. If you want a tighter model, pair this with pipeline health tracking and a consistent set of sales operations metrics.
5. Compare count-based vs amount-weighted probability. Count-based probability treats a $10K deal and a $500K deal equally. Amount-weighted probability often reveals that early-stage probabilities are inflated by small deals that close easily. Reviewing the opportunity amount by stage in your CRM helps surface these distortions before they reach the forecast.
Note: HubSpot lacks a native report for stage-probability analysis - you'll need to export and compute externally.
Add a recalibration loop each quarter. Compare forecasted revenue against actual closed revenue, compute a correction coefficient (actual / forecasted), and apply it forward. This catches systematic bias from deal mix shifts, seasonality, and rep behavior changes that stage probabilities alone won't capture.
Coverage Ratio Benchmarks
Your weighted pipeline tells you expected revenue. The coverage ratio tells you whether that's enough.
Coverage Ratio = Weighted Pipeline / Revenue Gap
Benchmarks vary by sales motion. SMB teams with short cycles can operate at 1.5-2x coverage. Enterprise teams with long cycles and lower win rates need 4-5x coverage to hit quota reliably. If your probability-adjusted pipeline is $500K and your quarterly gap is $400K, your 1.25x coverage is dangerously thin for an enterprise motion. You need to generate more pipeline or accept you're likely to miss. For more context, compare against broader sales pipeline benchmarks and your baseline sales conversion rate.
Weighted vs Unweighted Coverage
Many teams track unweighted pipeline coverage - total raw pipeline value divided by quota - alongside the weighted version. Unweighted coverage is useful for gauging top-of-funnel health: do you have enough total opportunity volume entering the pipe? But it treats a Discovery deal and a Negotiation deal as equally likely to close, which makes it a poor forecasting tool on its own.
Weighted pipeline coverage adjusts for stage probability, giving you a realistic view of whether you'll actually hit the number. Use unweighted coverage to diagnose pipeline generation problems; use weighted coverage to make the quarterly call.
The timing trap most teams fall into: stage probability tells you a deal will eventually close - not that it'll close this quarter. A $200K deal at 80% probability means nothing if the close date is five months out. Always filter by expected close date within the forecast period. This is the single most common reason the forecast overstates quarterly revenue.
When to Use Something Else
Skip stage-weighted forecasting entirely if you have low deal volume per quarter or your average deal cycle exceeds 6 months. The math needs volume to be meaningful.
Commit/Upside Forecasting
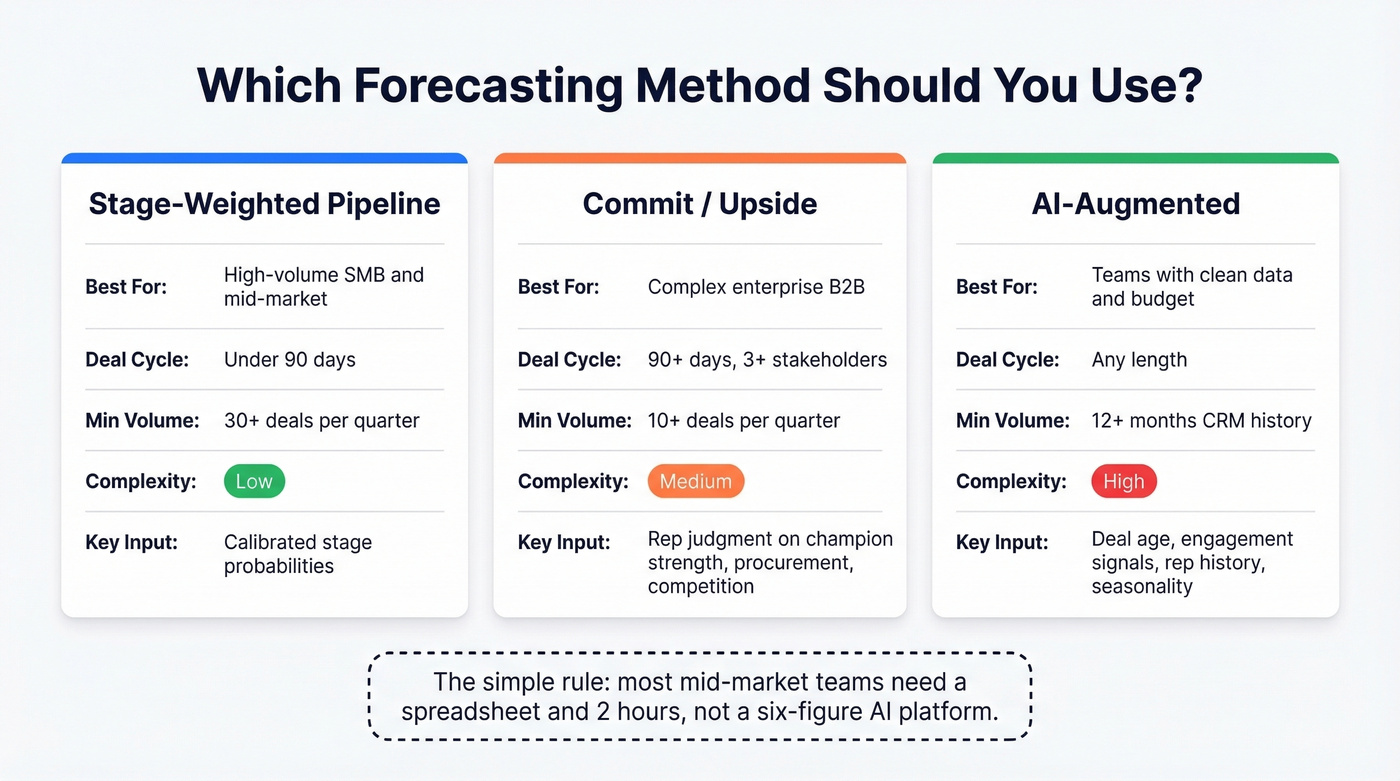
For complex B2B with deal cycles over 90 days or 3+ stakeholders, stage probability alone misses too much deal-specific context. Commit/Upside adds qualitative judgment: Commit (roughly 90% confidence), Best Case (60-80%), Upside (30-50%). This is where reps assess champion strength, competitive dynamics, and procurement timelines - things a stage label can't capture.
An important distinction: forecast categories like Commit, Best Case, and Upside measure confidence of closing within the period, while pipeline stages measure deal progress. The best enterprise teams use both - stages for pipeline health, categories for the quarterly call.
Qualification-Based Forecasting
Instead of advancing deals by activity milestones, MEDDIC or BANT gates replace stage-based probability entirely. Deals advance when qualification criteria are met - identified economic buyer, quantified pain, defined decision process. The probability reflects qualification depth, not just motion through a funnel. If you're standardizing qualification, a dedicated MEDDIC sales qualification framework helps keep stages honest.
AI-Augmented Forecasting
Uses deal age, time in stage, rep performance history, engagement signals, and seasonality to dynamically update probabilities. Gartner research suggests AI-powered forecasting can improve accuracy by up to 15% compared to traditional methods. But AI forecasting needs 12+ months of clean CRM history to work well, and implementation can run $75K-$500K+ for enterprise-grade deployments.
Let's be honest: a weighted pipeline is the foundation AI builds on, not what AI replaces. If your stage probabilities are garbage, AI just learns your garbage faster.
In our experience, most mid-market teams don't need AI forecasting. They need someone to spend two hours building a stage transition matrix in a spreadsheet. That alone will improve accuracy more than any six-figure platform. This Salesforce guide on pipeline management walks through the CRM mechanics if you need a starting point. If you're evaluating platforms anyway, start with a shortlist of sales forecasting solutions and compare feature depth vs process maturity.
The simple rule: stage-weighted forecasting for high-volume SMB/mid-market. Commit/Upside for enterprise. AI-augmented for teams with clean data and budget.
Your weighted pipeline coverage ratio means nothing if half those deals are built on stale contacts. Prospeo refreshes 300M+ profiles every 7 days - not every 6 weeks - so your reps reach real buyers and your stage conversion rates reflect reality.
Real coverage ratios start with real contact data at $0.01 per email.
FAQ
How do you calculate weighted pipeline value?
Multiply each deal's value by its stage probability, then sum all weighted values. A $50K deal at 30% probability contributes $15K. Use historically calibrated probabilities - not guesses - for this to mean anything. Recalibrate quarterly against actual closed revenue.
What's a good coverage ratio?
SMB teams with short cycles need 1.5-2x weighted pipeline coverage (weighted pipeline / revenue gap). Enterprise teams with long cycles need 4-5x. Below 1.5x in any motion means you're short on pipeline. Compare against unweighted coverage to determine if the gap is a volume or conversion problem.
How often should you recalibrate stage probabilities?
Quarterly at minimum. Compare forecasted revenue against actual closed revenue, compute a correction coefficient, and update your probabilities. Segment by deal type - new business, expansion, and renewal close at different rates and should never share the same probability table.
How does bad contact data affect pipeline accuracy?
Bounced emails and wrong phone numbers inflate early-stage conversion rates because reps can't actually engage prospects - deals stall silently instead of being disqualified. Clean contact data ensures deals entering the pipeline are real from the start, giving your stage probabilities a foundation that isn't built on phantom opportunities.