What Is Email Engagement (and Why Half Your Data Is Fake)?
It's Monday morning. Your email dashboard says 42% open rate. The team's feeling good. Then someone checks the click-through rate: 1.2%. That gap isn't a content problem - it's a measurement problem. And it's costing you decisions, budget, and pipeline.
Understanding email engagement - what it actually is, not what your dashboard pretends it is - starts with separating real signals from noise.
What Is Email Engagement?
Email engagement measures how recipients interact with your messages: opens, clicks, replies, conversions, forwards, and how long they actually read. It's the difference between sending emails and sending emails that do something.
The scale matters. There are 4.48 billion email users worldwide, sending and receiving 376.4 billion messages daily. Email still returns roughly $36 for every $1 spent. But that ROI only materializes if people engage. A sent email that lands in spam or gets counted by a bot-inflated "open" isn't engagement - it's noise.
What You Need (Quick Version)
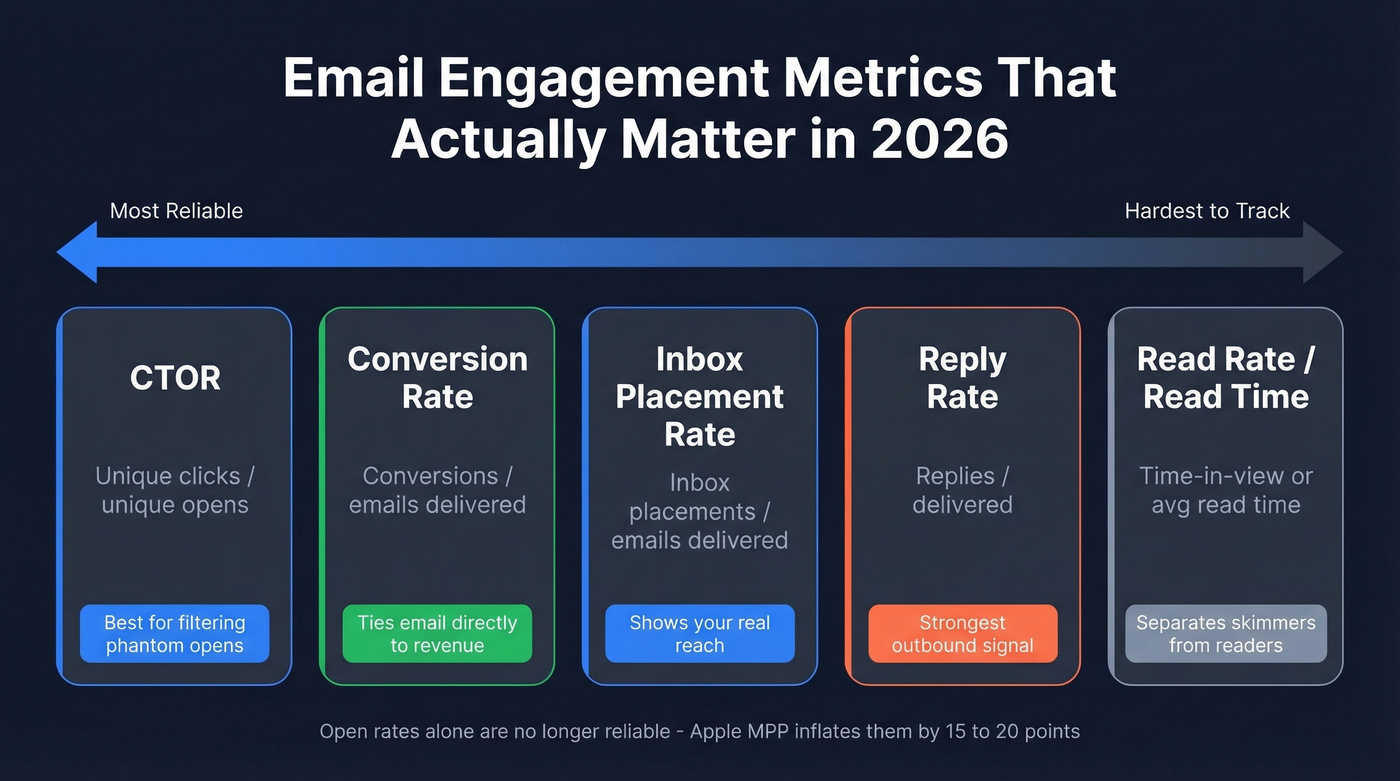
- Track CTOR (click-to-open rate), conversion rate, and inbox placement rate. These three are the most reliable starting point.
- Open rates are broken. Apple Mail Privacy Protection inflates them by 15-20 points. Stop making decisions based on opens alone.
- One action item right now: set up a welcome sequence. They generate 4x more opens and 10x more clicks than standard campaigns - one of the highest-leverage moves for most teams.
Metrics That Actually Matter
The post-privacy era demands a different measurement stack.
| Metric | Formula | Why It Matters |
|---|---|---|
| CTOR | Unique clicks / unique opens | Filters out phantom opens |
| Conversion rate | Conversions / emails delivered | Ties email to revenue |
| Inbox placement | Inbox placements / emails delivered | Shows real reach |
| Reply rate | Replies / delivered | Strongest signal in outbound |
| Read rate / read time | Time-in-view (glanced/read) or average read time | Separates skimmers from readers |
CTOR is the metric practitioners keep coming back to. It divides unique clicks by unique opens, which strips out a chunk of Apple MPP distortion. The distinction between unique opens and total opens matters enormously now - one human opening your email three times shouldn't count the same as three humans opening it once.
For ecommerce teams, repeat-purchase rate belongs on this list too. Teams using AI-powered dynamic content and personalized recommendations often see ~20% lifts in click-to-conversion rates, and tracking whether email recipients buy again is the clearest signal that your engagement translates to lifetime value. Break open and click rates out by domain (Gmail, Yahoo, Outlook) - domain-level diagnostics reveal rendering and deliverability problems that aggregate numbers hide completely.
If you're building a measurement stack for outbound, a sales engagement platform can also help standardize tracking across sequences and channels.
Tracking CTOR and conversion rates only works if your emails actually reach real inboxes. Prospeo's 5-step verification catches spam traps, honeypots, and invalid addresses - delivering 98% email accuracy and keeping bounce rates under 3%. Stop optimizing engagement on a dirty list.
Fix the data before you fix the copy.
Benchmarks by Industry
WebFX's benchmark data provides useful context:
| Industry | Open Rate | CTR | Unsub Rate | Bounce Rate |
|---|---|---|---|---|
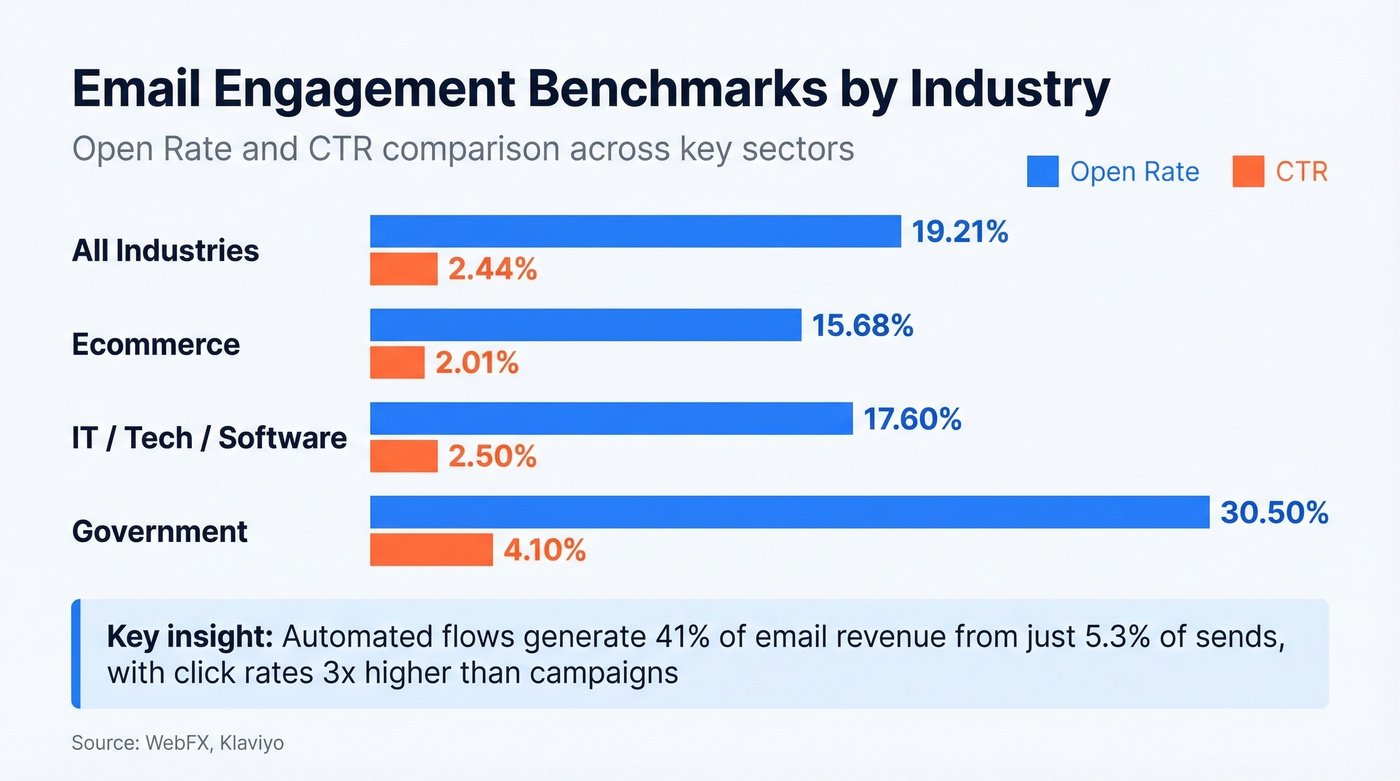
| All industries | 19.21% | 2.44% | 0.89% | 2.48% |
| Ecommerce | 15.68% | 2.01% | 0.27% | 0.19% |
| IT / Tech / Software | 17.60% | 2.50% | 0.20% | 0.90% |
| Government | 30.50% | 4.10% | 0.20% | 1.30% |
The standout insight comes from Klaviyo's dataset of 183,000+ ecommerce customers: automated flows generate 41% of total email revenue from just 5.3% of sends. Flow click rates hit 5.58% versus 1.69% for campaigns - roughly 3x. If you're still batch-and-blasting everything, that gap is your opportunity cost.
If you want a deeper baseline, compare against a standard email open rate and sanity-check what "good" looks like post-privacy.
Why Your Open Rates Are Lying
Apple Mail Privacy Protection preloads your tracking pixel through a proxy server before anyone reads a word. No human opened that email. A machine did.

As of early 2025, 49.29% of all email opens were Apple proxy opens, and the number has likely grown since. With Apple Mail holding 50.20% of email client market share (Gmail at 27.79%, Outlook at 8.10%), this isn't a niche problem - it's the majority of your data. The inflation runs 15-20 percentage points. Pre-MPP, a 25-30% open rate was strong. Post-MPP, teams report 40-45% with zero actual interaction change.
It gets worse. Apple's Link Tracking Protection can break parts of click attribution in Apple Mail, pushing teams even further away from open-based reporting. Gmail and Outlook security systems also pre-click links to scan for malware - "dark clicks" that inflate CTR and trigger automations meant for real humans.
Here's the thing: Campaign Monitor's survey of 400+ people found the number one reason emails go unopened is that the recipient doesn't recognize the sender. That's a list quality problem, not a subject line problem. And on r/Emailmarketing, the frustration is real - teams face internal pressure to report open rates everyone knows are inflated, but nobody's found a clean replacement for the executive dashboard yet.
If you're still reporting opens, at least align stakeholders on what "good" means now: what is a good email open rate.
The Engagement-Deliverability Loop
Most teams treat engagement and deliverability as separate problems. They're not. They're a feedback loop.
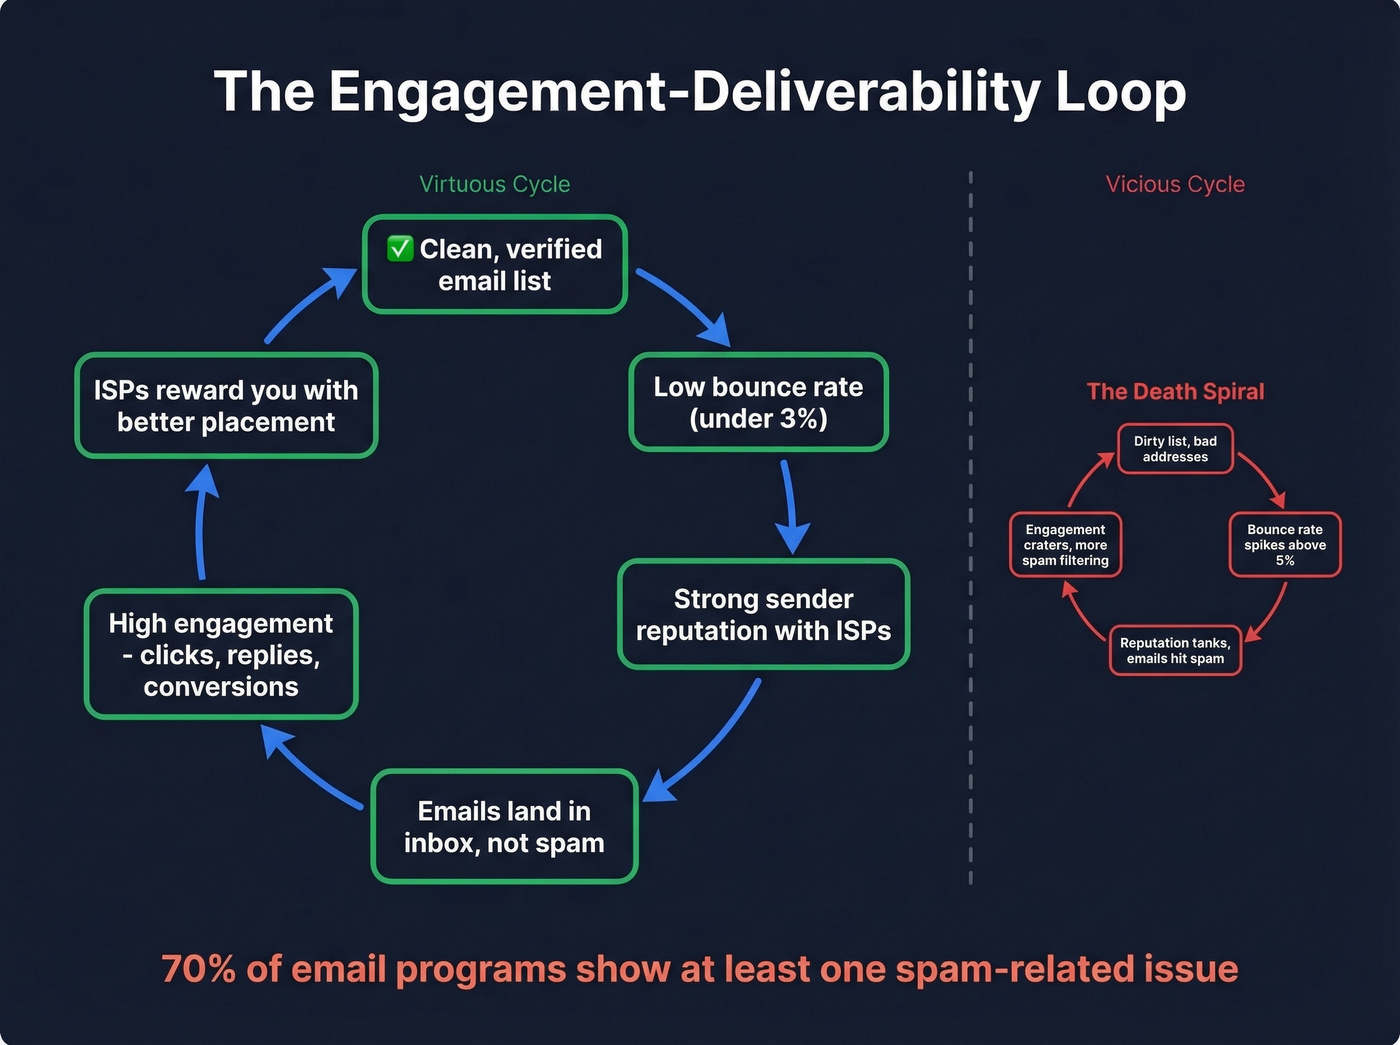
ISPs like Gmail, Yahoo, and Outlook use engagement signals - opens, clicks, spam complaints, deletes - to decide whether your next email hits the inbox or the spam folder. Low engagement trains ISPs to treat your domain as spam. High engagement builds trust and inbox placement. And the distinction between delivery ("accepted by the mail server") and deliverability (where it actually lands) matters: 70% of email programs show at least one spam-related issue.
Trace the chain backward. Your bounce rate spikes to 8%. ISPs notice. Sender reputation drops. Future emails start landing in spam. Engagement craters. The root cause wasn't your subject line - it was bad data.
In our experience, teams that verify their lists before optimizing anything else get to meaningful improvements much faster. Prospeo's 5-step email verification catches invalid addresses, spam traps, and honeypots before they hit your sending platform - at 98% accuracy, it keeps bounces under 3%. You can A/B test subject lines all day, but if your list is dirty, none of it matters.
To go deeper on the mechanics, see our email deliverability guide and how to improve sender reputation.
How to Improve Email Engagement
1. Launch a welcome sequence immediately. Welcome emails generate 4x more opens and 10x more clicks than standard campaigns. Krispy Kreme saw +53% leads after implementing automated lifecycle programs.
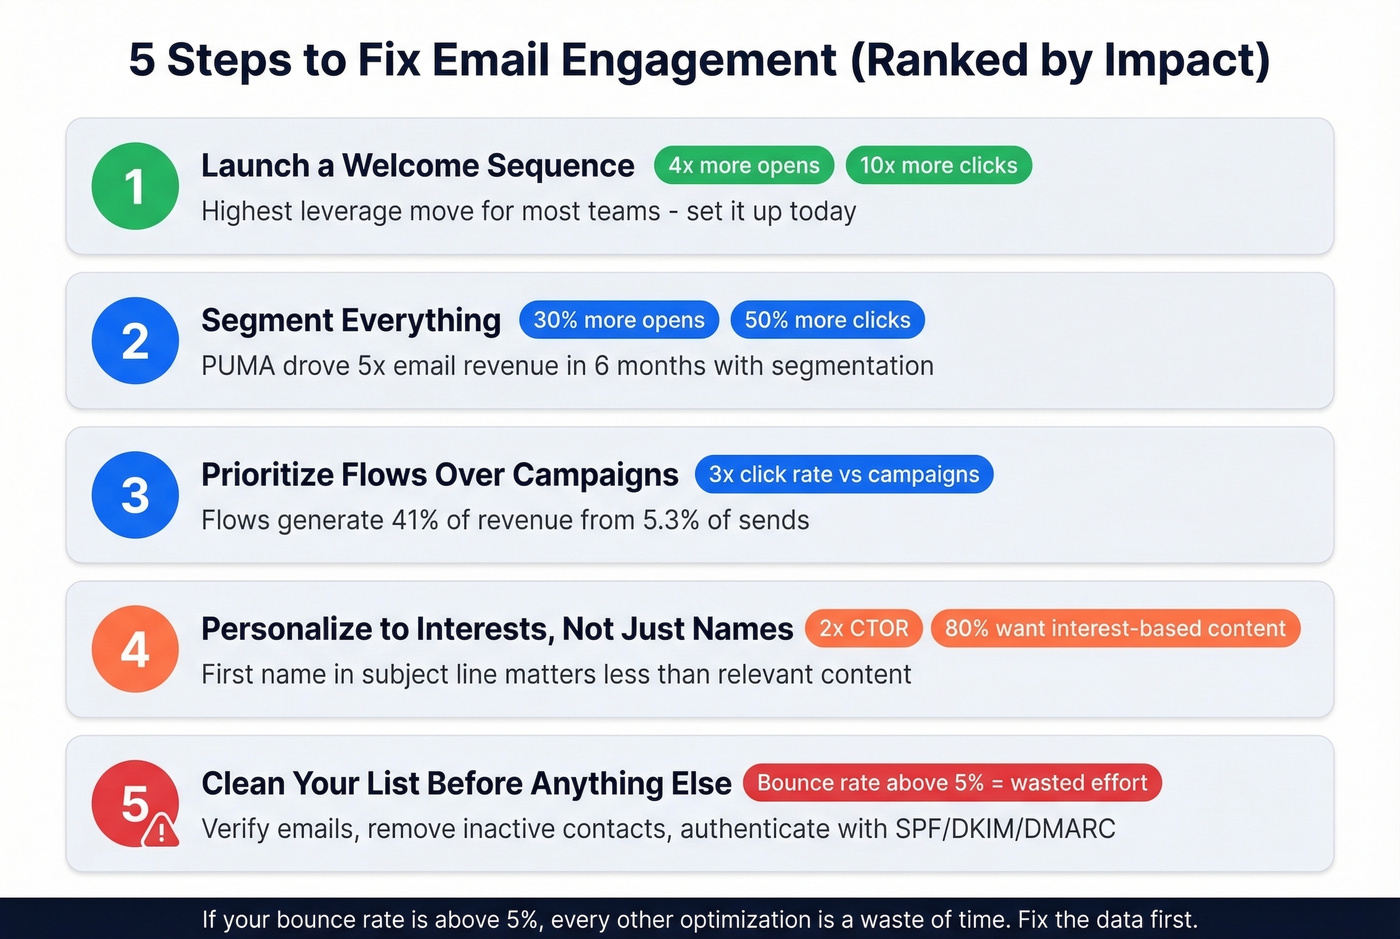
2. Segment everything. Segmented campaigns deliver up to 30% more opens and 50% more clicks versus batch sends. PUMA drove 5x email-attributed revenue over six months with segmentation and send-time optimization.
3. Prioritize flows over campaigns. Klaviyo's data is unambiguous: flows produce ~3x the click rate of campaigns, from a fraction of the send volume. If you're sending the same blast to your entire list every Tuesday, you're leaving money on the table.
4. Personalize to interests, not just names. A Mailjet survey of 2,000+ consumers found 80%+ value content personalized to their interests, while only ~60% care about seeing their first name in the subject line. John Frieda doubled their CTOR and reached 4x more contacts by shifting to interest-based personalization - 88% of those customers purchased two or more products.
5. Clean your list before you optimize anything else. We've seen teams spend weeks A/B testing subject lines while sending to a list with a 12% bounce rate. Fix the foundation first - verify emails, remove inactive contacts, authenticate with SPF/DKIM/DMARC. And stop overloading emails with multiple CTAs or skipping mobile optimization - those are the silent killers that no amount of clever copy will overcome.
If you need a tighter playbook for bounces and remediation, start with email bounce rate benchmarks and fixes.
Let's be honest: if your bounce rate is above 5%, every other optimization you're running is a waste of time. Fix the data first. Everything else is rearranging deck chairs.
The engagement-deliverability loop punishes bad data harder than bad subject lines. Teams using Prospeo's verified emails send 4x more volume with bounce rates under 3% - protecting sender reputation and keeping every campaign in the inbox, not the spam folder.
Break the spam loop at the source - start with verified contacts.
FAQ
What is a good email engagement rate?
Across industries, average open rates sit around 19% and CTR around 2.4%. CTOR - clicks divided by opens - is the better benchmark because it filters out Apple MPP inflation. Aim for 10-15% CTOR and investigate immediately if inbox placement drops below 90%.
Why are my open rates high but clicks low?
Apple Mail Privacy Protection preloads tracking pixels via proxy servers, inflating open rates by 15-20 points without any human reading your email. Gmail and Outlook security bots also pre-click links, further distorting data. Track CTOR and conversions instead - those require real human action.
How does list quality affect email engagement?
Bad email addresses cause bounces, which damage sender reputation with ISPs like Gmail. Once reputation drops, even well-crafted emails land in spam. Keeping bounces under 3% through verification protects inbox placement - tools like Prospeo, NeverBounce, and ZeroBounce all handle this.
What's the fastest way to improve engagement in 2026?
Set up an automated welcome sequence - they generate 4x more opens and 10x more clicks than standard campaigns. Pair that with list segmentation and proper email authentication (SPF/DKIM/DMARC). Most teams see measurable improvement within two to four weeks.