What Is Incremental Revenue? The Formula Is Easy - Measuring It Is the Hard Part
Your CMO asks the question nobody wants to answer: "Did that Q3 campaign actually generate new revenue, or would we have hit those numbers anyway?" Everyone looks at the dashboard. Nobody's confident. That's the incremental revenue problem - and according to Skai's State of Retail Media report, 44% of CPG brand marketers say measuring incrementality accurately is a top challenge.
The concept is simple subtraction. The baseline is the battlefield.
Quick Definition and Formula
Incremental revenue is the additional revenue directly caused by a specific action - a campaign, a pricing change, a new channel - above what would've happened without it.
The formula:
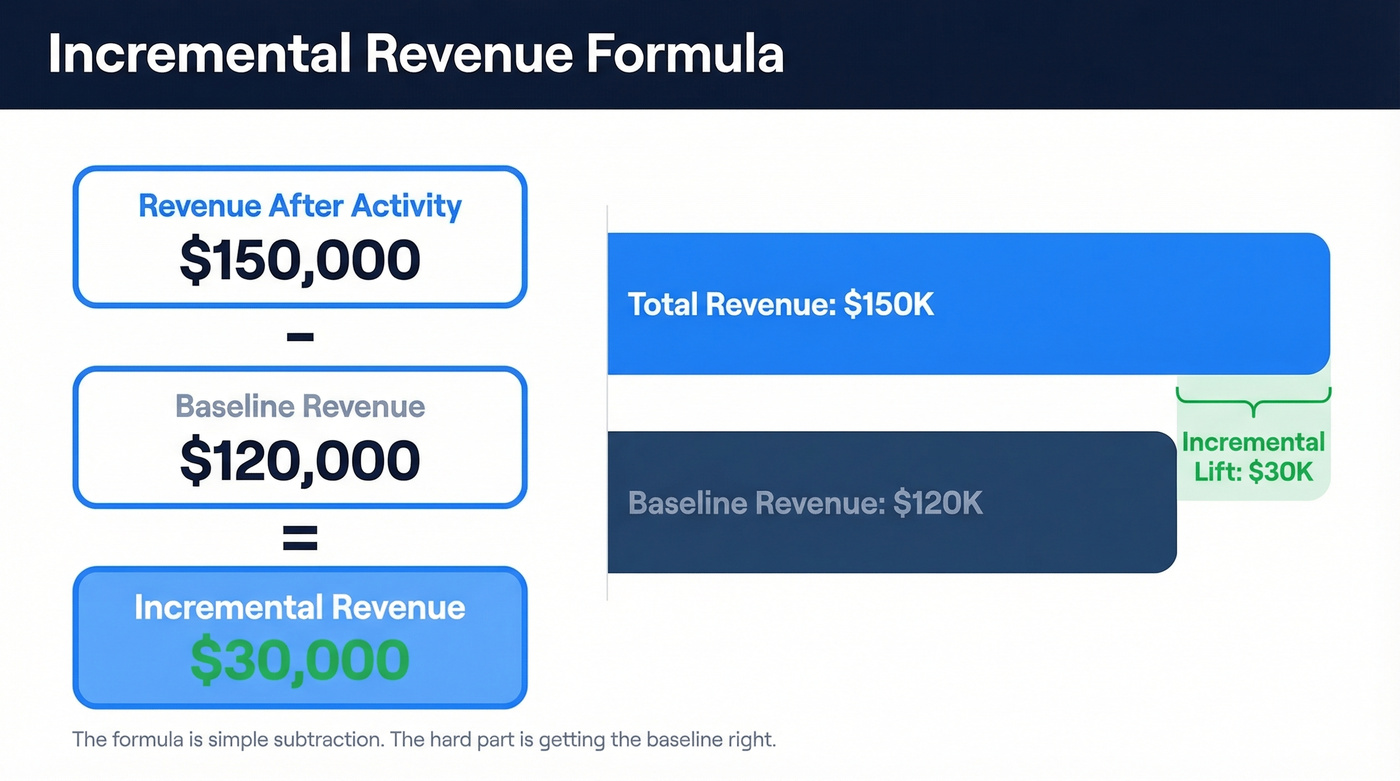
Incremental Revenue = Revenue After Activity - Baseline Revenue
That's it. The hard part isn't the math. It's getting the baseline right, and if you're not using a control group, you're guessing.
What It Is (and What It Isn't)
Incremental revenue is the net-new money a business earns because of a specific initiative. Not total revenue. Not gross revenue. Just the slice that wouldn't exist if you'd done nothing.
A quick example makes this concrete. Your baseline monthly revenue is $120K. You run a campaign and revenue hits $150K that month. Your incremental lift is $30K - assuming you've correctly isolated the baseline. That last part is where most teams get tripped up.
The distinction from total revenue matters enormously. Total revenue is everything that came in; the incremental portion is only what your action caused. Conflating the two is how marketing teams take credit for revenue that was already in motion. If you can't define a baseline, don't report incremental numbers - report "attributed revenue" and label it honestly. Anything else is self-deception with a spreadsheet.
Incrementality measurement is a variant of Marketing Revenue Attribution that goes beyond crediting touchpoints and instead isolates what actually moved the needle.
Incremental vs. Marginal Revenue
These terms get confused constantly. They shouldn't be - they answer fundamentally different questions.
| Incremental Revenue | Marginal Revenue | |
|---|---|---|
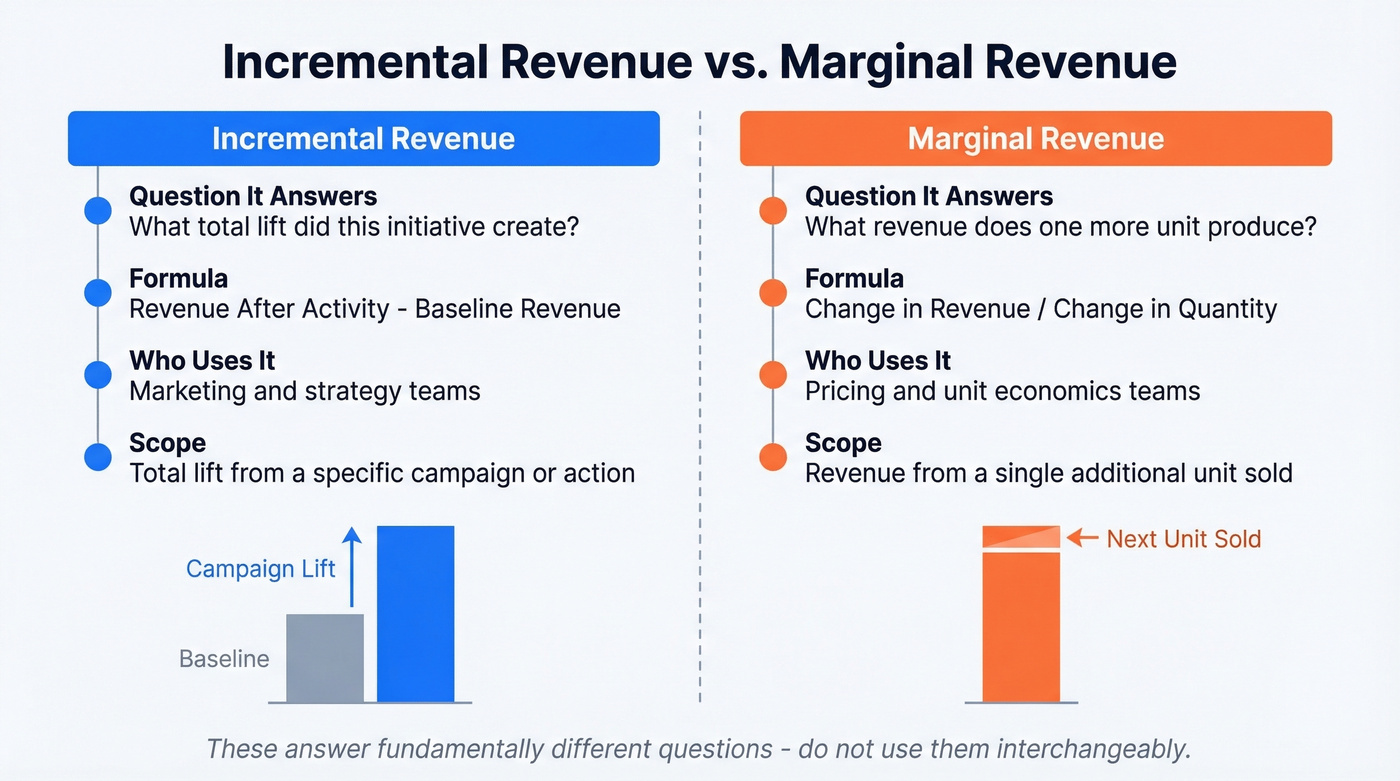
| Question | What total lift did this initiative create? | What revenue does one more unit produce? |
| Formula | Revenue after - Baseline | Change in Revenue / Change in Quantity |
| Domain | Marketing and strategy | Unit economics |
| Scope | Total lift from a specific action | Single additional unit |
Marginal revenue is about the next unit sold. Incremental revenue is about the total lift from a specific action. A pricing team cares about marginal revenue - what happens to revenue when you sell one more widget at a lower price. A marketing team cares about incremental lift - did this campaign create net-new demand or just shift existing demand around?
The Incremental Metrics Family
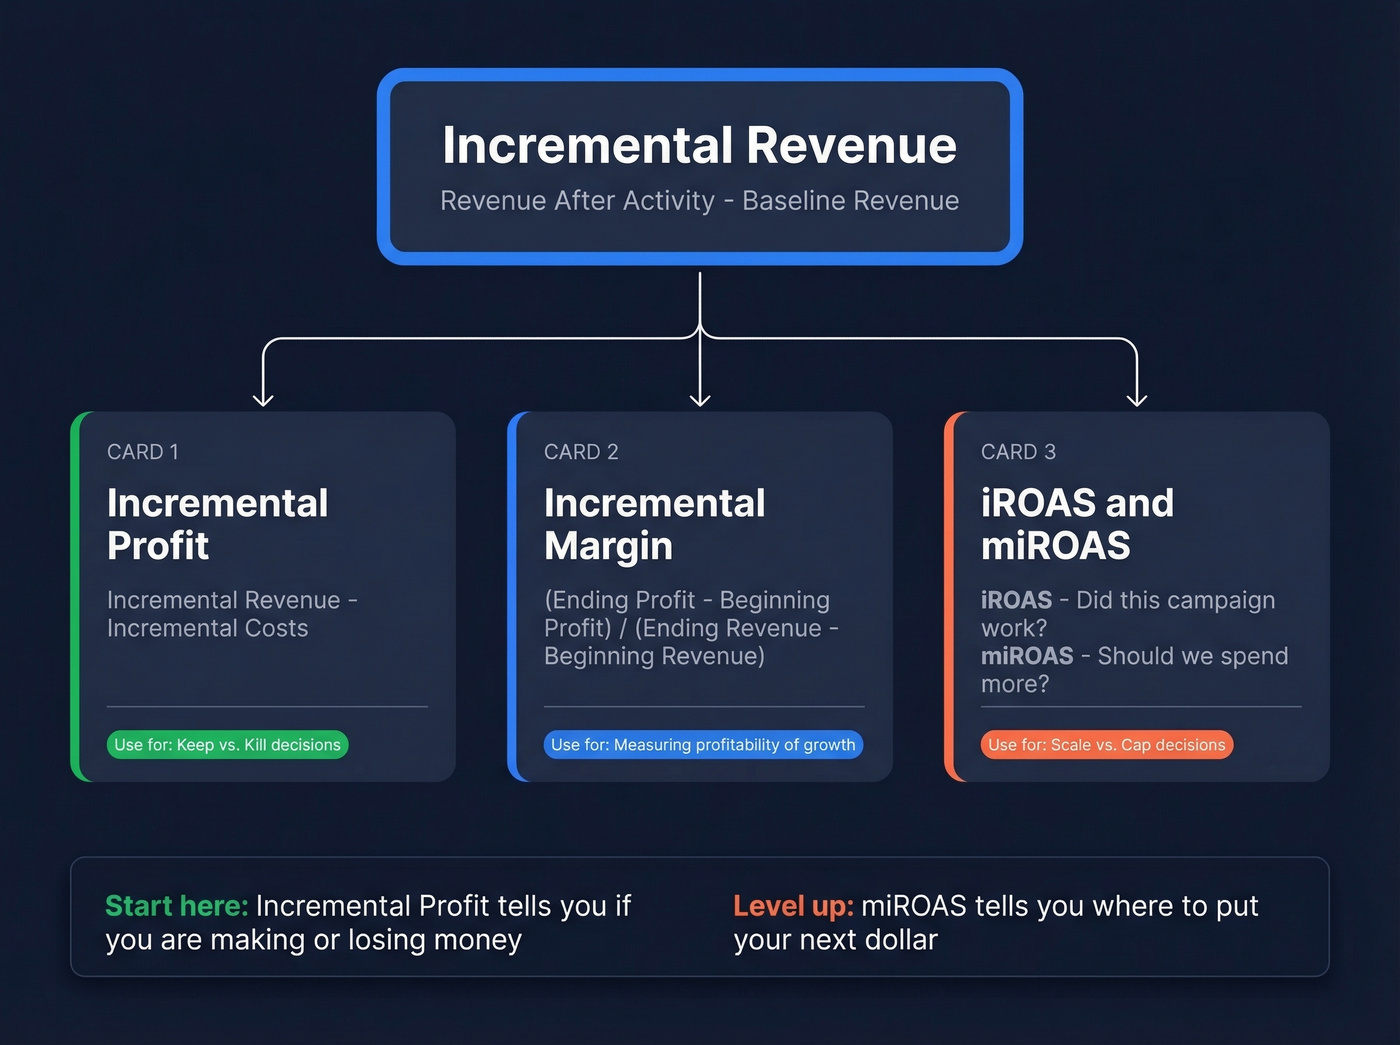
Incremental revenue doesn't live in isolation. It's part of a family of metrics, and confusing them leads to bad decisions. The short version: use incremental profit to decide "keep vs. kill," and miROAS to decide "scale vs. cap."
Incremental Profit
Revenue without cost context is vanity. Incremental profit = incremental revenue minus incremental costs. A campaign that generates $30K in new revenue but costs $35K to run has negative incremental profit. We've seen teams celebrate "record lift" numbers while bleeding money - don't let that be your team.
Incremental Margin
This tells you the profitability of your growth. The formula per Wall Street Prep:
Incremental Margin = (Ending Profit - Beginning Profit) / (Ending Revenue - Beginning Revenue)
It connects directly to operating leverage. Companies with high fixed costs and low variable costs see incremental margin expand as revenue grows - each new dollar is more profitable than the last.
iROAS vs. miROAS
Two metrics that sound similar but answer different questions. iROAS measures the average return across your tested spend. miROAS measures the return on the next dollar you'd spend. iROAS tells you whether a campaign worked. miROAS tells you whether to spend more on it.
Most incrementality tests give you iROAS. Getting to miROAS requires spend curve experiments or response modeling - most teams won't get it from a single lift test. But miROAS is what actually informs budget decisions, so it's worth the extra effort if you're spending six figures or more per channel.
Measuring incremental revenue means nothing if your pipeline is built on bad data. Prospeo delivers 98% email accuracy and 125M+ verified mobiles so every campaign you measure is reaching real buyers - not bouncing into the void.
Fix the data first, then measure the lift.
How to Measure It in Practice
The formula is easy. Measurement is where teams either get rigorous or start lying to themselves. According to the IAB's outlook study, 56% of US advertisers are focusing on marketing mix modeling significantly more in 2026 compared to prior years, and 52% of brands and agencies now use incrementality testing.
Before picking a method, run through this checklist:
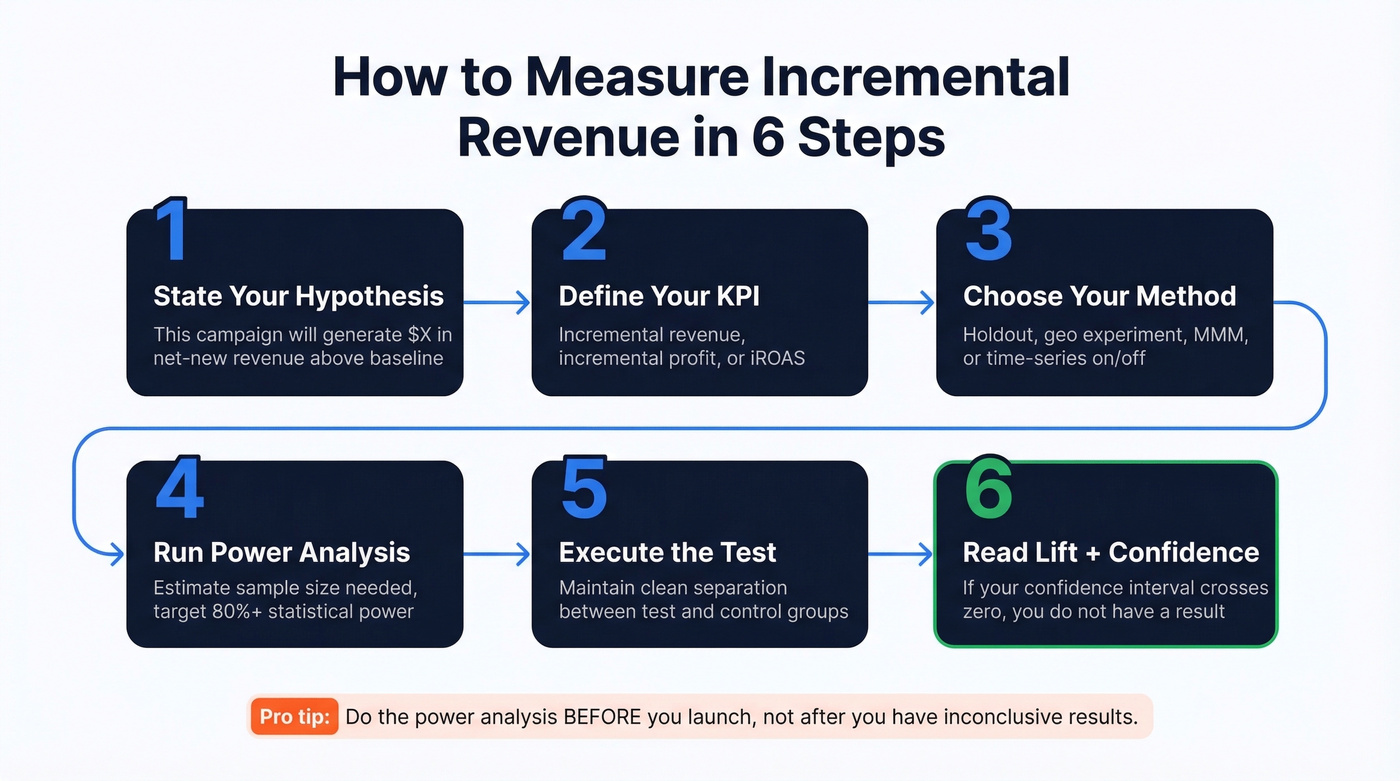
- State your hypothesis - "This campaign will generate $X in net-new revenue above baseline."
- Define your KPI - incremental revenue, incremental profit, or iROAS.
- Choose your method - holdout, geo experiment, MMM, or time-series on/off.
- Run a power analysis - estimate the required sample size, number of markets, or weeks needed. Target 80%+ statistical power, which means doing the math before you launch so your results are trustworthy.
- Execute the test - maintain clean separation between test and control.
- Read lift + confidence intervals - if your confidence interval crosses zero, you don't have a result.
Holdout Tests
The simplest and most accessible method. Split your audience into two groups: one that sees your campaign and one that doesn't. Compare revenue between them. The difference is your incremental lift.
If you can run a holdout, do it - don't rely on last-click attribution.
Tyroola, an Australian tire retailer, ran a holdout study on Meta to validate incrementality. They used those insights to refine creative messaging. A single change - reframing "Buy 4 Pay 3" as "Buy 3 Get 1 Free" - lifted ROAS by 52%. That's the kind of insight holdout tests surface.
One warning: watch for divergent delivery. Ad algorithms optimize who sees the test ad versus the control, which breaks true randomization. Your "lift" might just be the algorithm showing ads to people who were already going to buy. Don't present platform lift studies as causal unless you've controlled for this.
Geo Experiments
Compare matched geographic regions - some get the campaign, some don't. This works well for channels where audience-level holdouts are impractical like TV, OOH, and CTV. Plan for at least 20 markets if you want reliable geo lift results; fewer markets usually means noisy reads unless spend is very high and markets are tightly matched.
Marketing Mix Modeling (MMM)
Where holdouts and geo tests are snapshots, MMM provides continuous measurement. It uses statistical models to decompose revenue across all channels simultaneously - the gold standard for ongoing incrementality measurement. But it requires real investment: data infrastructure, modeling expertise, and patience. If your annual media spend is under $2M, you're probably better off with holdout tests until you've built the data foundation MMM needs.
On/Off Tests
When holdouts aren't feasible and you don't have enough markets for geo experiments, time-series on/off tests are a solid fallback. Turn a channel on for a set period, off for another, and compare. The tradeoff is you sacrifice some statistical rigor because external factors shift between periods. For channels where you have no other option - like a single-market brand testing radio - it's far better than guessing.
Why Most Teams Overstate Results
Let's be honest: most incremental revenue numbers in internal decks are inflated. Not because anyone's lying, but because isolating causation is genuinely hard. In our experience, the fastest way teams inflate incrementality is overlapping promos - three initiatives running simultaneously, and everyone claims the lift.
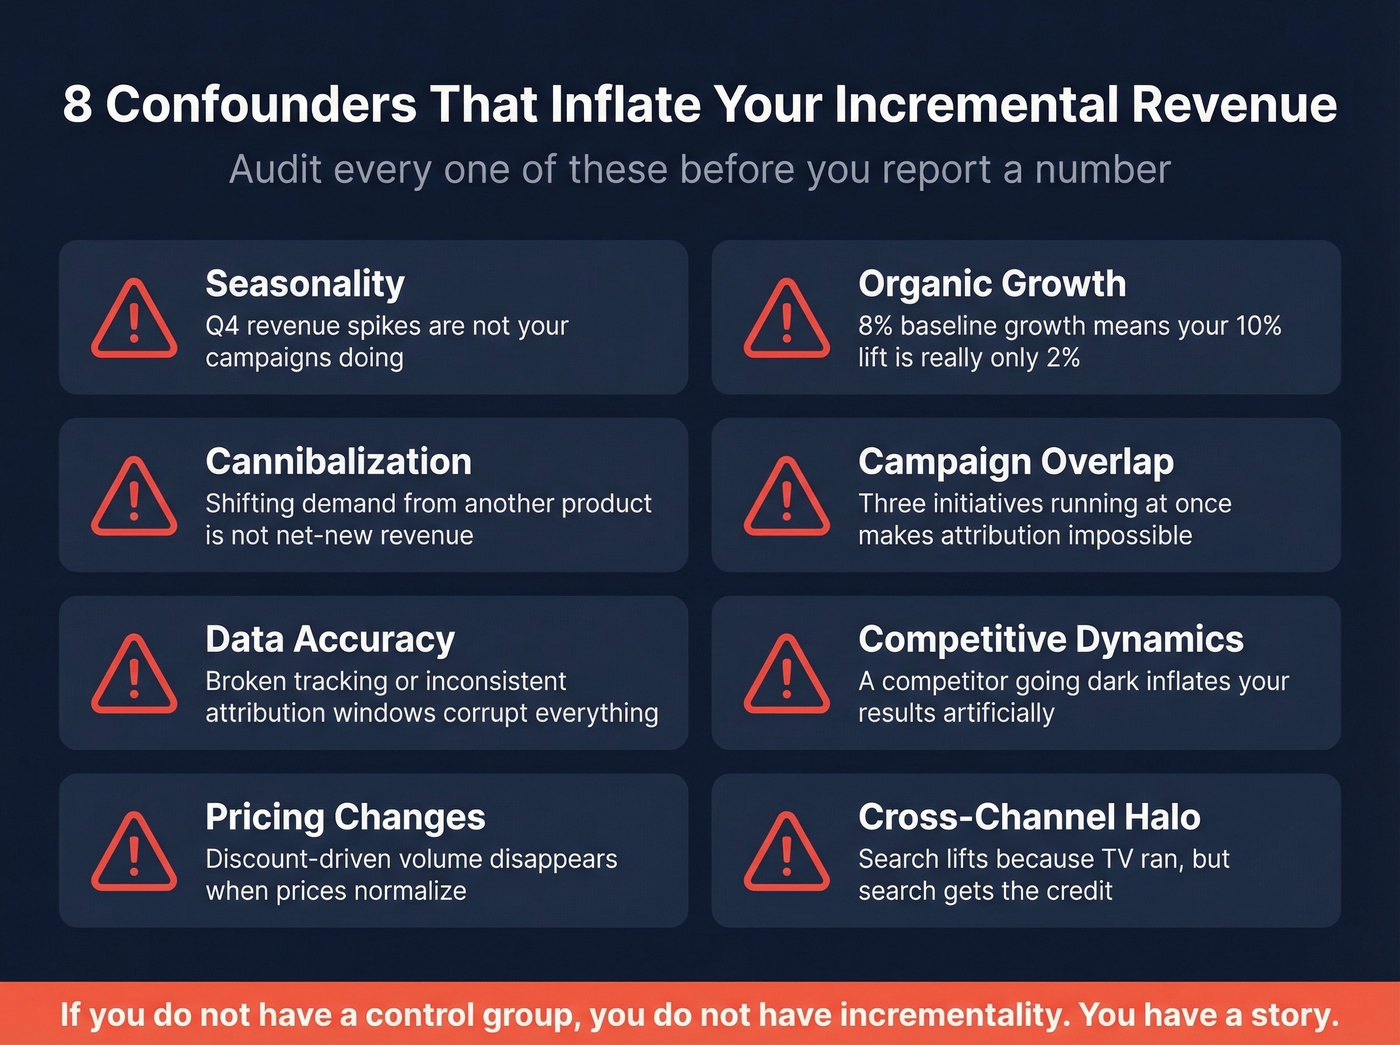
The confounders checklist every team should audit:
- Seasonality - Q4 revenue spikes aren't your campaign's doing
- Organic growth - if your baseline is growing 8% and you see 10% growth during a campaign, the lift is closer to 2%, not 10%
- Cannibalization - your promo shifts demand from another product, not creating net-new demand
- Campaign overlap - three initiatives running simultaneously makes attribution nearly impossible
- Data accuracy - inconsistent tracking or broken attribution windows corrupt everything
- Competitive dynamics - a competitor going dark inflates your results artificially
- Pricing changes - a discount spike drives volume that disappears when prices normalize
- Cross-channel halo - search lifts because TV ran, but search gets the credit
Here's the thing: if you don't have a control, you don't have incrementality. You have a story.
A practitioner on r/FulfillmentByAmazon captured this perfectly. Their branded ad sales jumped from 5.7% to 11% of total revenue - looks great on paper. But a COVID demand spike and an agency restructure happened simultaneously. They called it a "dirty dataset," and they were right. Without a clean control, those numbers are meaningless.
Our hot take: Most companies would be better off reporting no incremental revenue number than reporting an inflated one. A wrong number with a confident label causes more damage than admitting you don't know yet. It misallocates budget, rewards the wrong campaigns, and builds a culture of measurement theater. If your average deal size is modest and your marketing team is small, start with simple holdout tests on your two biggest channels. Skip the fancy MMM until you've proven you can run a clean A/B test first.
Real-World Case Studies
VKTRY Gear
Setup: Performance insole brand running direct mail campaigns to multiple customer segments.
Method: Holdout groups for each segment - some customers received mail, matched controls didn't.
Results: Abandoned cart segments hit 5.84x iROAS. Abandoned checkout reached 6.03x iROAS. Their 365-day winback segment delivered 10.1x iROAS, and automated winbacks peaked at 10.75x iROAS.
Takeaway: These aren't attributed numbers - they're incremental, measured against holdout groups. That's the difference between "we think this worked" and "we proved it did."
Seidensticker
Setup: German fashion brand questioning whether their digital ad spend was driving real growth or just capturing existing demand.
Method: Geo experiments comparing matched regions with and without campaign exposure.
Results: 11.5% higher revenue at 11.7% lower ad spend.
They didn't spend more - they spent smarter, reallocating budget based on incremental lift data rather than last-click attribution. This is what incrementality measurement unlocks: not just knowing what works, but knowing where to move dollars.
Six Ways to Drive Growth
Measuring incremental revenue is half the battle. Actually driving it requires deliberate tactics.
Upsell and cross-sell existing customers. The cheapest net-new revenue comes from people who already trust you. Expansion revenue from current accounts typically shows clean incremental lift because the baseline is well-established.
Test new channels. Incremental lift is often single-digit percentages in mature channels. New-channel tests - direct mail, podcast sponsorships, outbound to a new ICP - tend to produce larger measurable lifts because the baseline is zero.
Optimize pricing. Small pricing changes compound. A 3% price increase with no volume loss is pure incremental revenue, and it's measurable within weeks. (If you want to go deeper, align this with your broader pricing strategy.)
Fix your outbound data quality. This is the B2B angle most teams miss. Your outbound campaign's incremental lift is only measurable if the data is clean. We've seen outbound tests fail simply because 20-30% of the list was stale - at that point, you're measuring data decay, not campaign performance. Prospeo's 98% email accuracy and 7-day data refresh cycle mean your holdout tests actually measure what the campaign did, not how bad your list was.
Run proper A/B tests on messaging. Like Tyroola's reframe from "Buy 4 Pay 3" to "Buy 3 Get 1 Free," small creative changes can drive outsized incremental lift when measured correctly. This is also where a tight GTM messaging framework pays off.
Kill what doesn't work, fast. Incremental measurement isn't just about finding winners. It's about cutting losers before they drain budget. If a channel shows flat or negative incremental profit after a properly powered test, reallocate immediately.

Your incremental revenue formula is only as good as the pipeline feeding it. Teams using Prospeo book 26% more meetings than ZoomInfo users - at $0.01 per email with a 7-day data refresh cycle. That's real, measurable lift.
Build pipeline worth measuring - start with 75 free verified emails.
FAQ
Can incremental revenue be negative?
Yes. Cannibalization, excessive discounting, or poor targeting can mean a campaign costs more than the revenue it generates net of what would've happened anyway. If your promo just pulled forward next month's purchases, you've created negative lift once the hangover hits.
What's the difference between incremental and attributed revenue?
Attributed revenue credits a touchpoint for a sale. Incremental revenue asks whether that sale would've happened without the touchpoint. A display ad might get attribution credit for a conversion that was already inevitable from organic search - incrementality testing exposes that gap.
How long should I run an incrementality test?
At minimum two to four weeks to account for purchase cycles and reach 80%+ statistical power. High-ticket or low-frequency purchases need six to eight weeks. Run the power analysis before you launch - cutting a test short is the fastest way to get a confident wrong answer.