Revenue Forecasting: What It Is, Why It Fails, and How to Fix It
It's the last week of the quarter. The VP of Sales says pipeline is strong. The CFO says cash is tight. Someone needs a number - and nobody agrees on how to get one.
So what is revenue forecasting, and why do so many teams get it wrong? Four in five sales and finance leaders missed a quarterly forecast in the past year, and over half missed two or more times. The problem isn't math. It's method, data, and cadence.
The Short Answer
Revenue forecasting is predicting future revenue using data, pipeline, and assumptions - not guessing. The right method depends on your business stage and model. Most forecasts fail because of dirty data and wrong method selection. And frequency beats precision every time: update monthly, not quarterly.
What Revenue Forecasting Actually Means
Revenue forecasting is the process of estimating how much money your company will generate over a specific period - next month, next quarter, next year. It combines historical performance, current pipeline data, market conditions, and operational assumptions into a number your CFO can actually plan around.
The terminology trips people up, so here's a clean breakdown:
| Term | Definition | Time Horizon | Primary Input |
|---|---|---|---|
| Revenue Forecast | Data-driven prediction | 1-4 quarters | Pipeline + history |
| Revenue Projection | Goal-influenced estimate | 6-18 months | Scenarios + targets |
| Sales Forecast | Subset: expected closes | 1-3 months | Rep activity + CRM |
A forecast says "here's what the data tells us." A projection says "here's what we'd need to hit our goal." Mixing them up is how boards get surprised.
For SaaS companies, "old" ARR - revenue from existing customers - typically represents 29-53% of total revenue. If you're not modeling that separately from new bookings, you're building on sand. One more distinction that trips up even experienced finance teams: bookings, billings, and revenue aren't the same thing. A $120K annual contract is a $120K booking, might be billed $120K upfront, but it's recognized as $10K/month over 12 months. Your forecast needs to specify which number it's predicting.
Why Accurate Forecasts Matter
Forecasting isn't a finance exercise - it's an operating system for the business. Hiring plans, marketing budgets, COGS estimates, working capital management, and investor communications all flow from it. Get the forecast wrong and every downstream decision inherits that error.
Korn Ferry research found that companies with rigorous, tech-enabled forecasting workflows achieve 21% higher quota attainment, 18% higher win rates, and 25% lower customer churn. Those aren't marginal improvements. That's the difference between a team that hits plan and one that restructures in Q4.
The failure data is just as telling. Xactly's 2024 benchmark survey of 400 leaders found that 66% cite reporting systems that can't access historical CRM data as the top roadblock to accurate forecasting, and 97% say sales and finance teams need better alignment. Only 2% of organizations consider their FP&A function optimized - the vast majority are still constrained by manual processes and inconsistent data.
Here's the thing: most forecasting failures aren't analytical. They're organizational. The data is dirty, the CRM is stale, and the people who know the pipeline aren't talking to the people building the model.

Revenue Forecasting Methods
There's no single best method. There's only the best method for your data, your stage, and your business model.
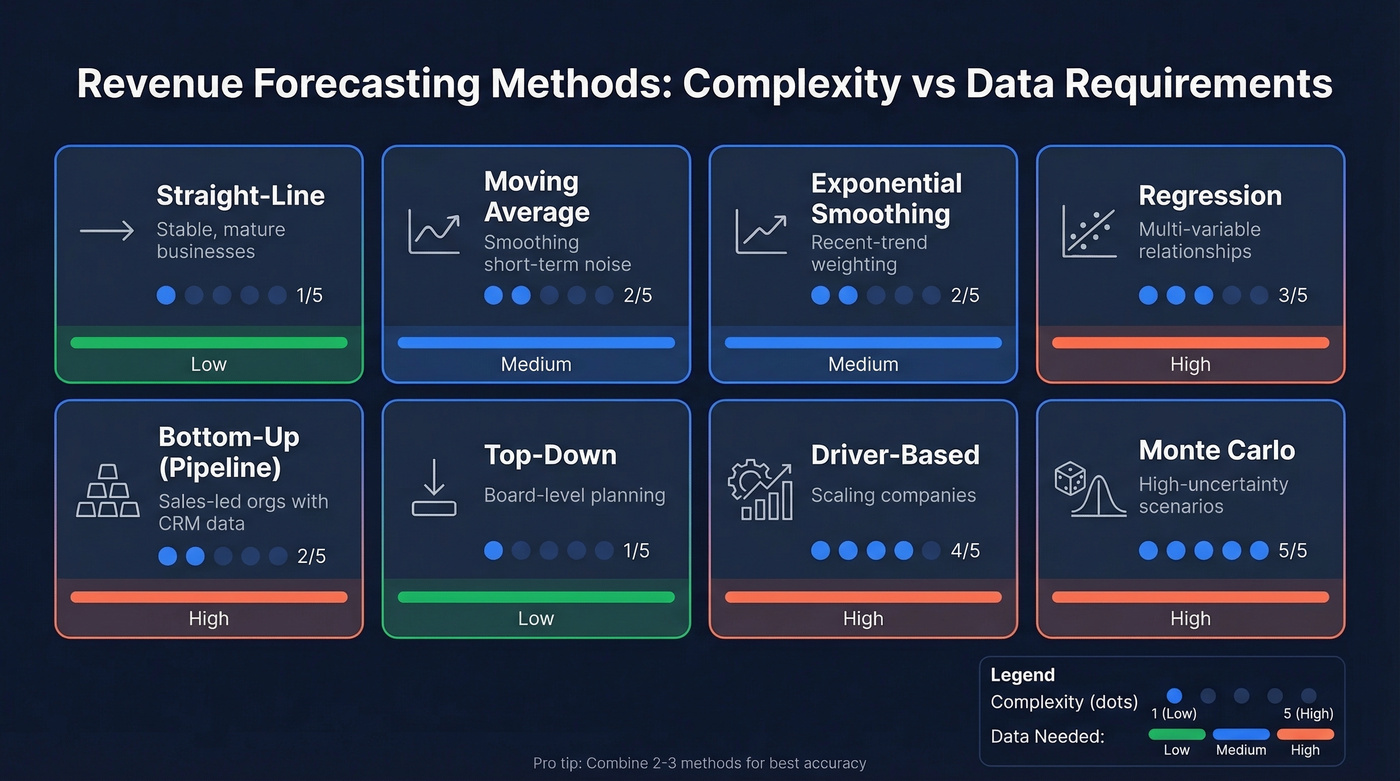
| Method | Best For | Limitation |
|---|---|---|
| Straight-line | Stable, mature businesses | Ignores trends/seasonality |
| Moving average | Smoothing short-term noise | Lags behind real shifts |
| Exponential smoothing | Recent-trend weighting | Needs tuning (alpha) |
| Regression | Multi-variable relationships | Requires clean historical data |
| Bottom-up (pipeline) | Sales-led orgs with CRM data | Only as good as rep inputs |
| Top-down | Board-level planning | Disconnected from reality |
| Driver-based | Scaling companies | Complex to build/maintain |
| Monte Carlo | High-uncertainty scenarios | Overkill for most SMBs |
Straight-line works when your business is predictable and growth is steady - think established SaaS with low churn. Moving average smooths out noise but will miss a real trend change until it's already happened. Regression is powerful when you can identify the variables that actually drive revenue like headcount, ad spend, or seasonality, but garbage data in means garbage predictions out.
Bottom-up forecasting is the default for sales-led organizations, and it's only as honest as your reps' stage assignments. Driver-based models connect revenue to operational levers and are the gold standard at scale, but they take real effort to build and maintain.
Let's make pipeline-weighting concrete. Say you're an agency with 10 people billing at $150/hour and 70% utilization. Your monthly capacity ceiling is roughly $180K. If your pipeline-weighted forecast says $250K, something's wrong - you literally can't deliver that without hiring or pushing utilization above sustainable levels. This capacity-ceiling sanity check is the single most underused technique in forecasting. Every forecast should have one.
For most teams, the smartest move is combining two or three techniques. R.T. Clemen's 1989 research showed that averaging multiple forecasts virtually always improves accuracy over any single model. We've found that a pipeline-weighted bottom-up forecast combined with a driver-based top-down estimate catches errors that either method alone would miss.
On r/FPandA, practitioners forecasting transactional revenue without a meaningful backlog describe single-method approaches as "educated guessing" - daily averages break the moment seasonality or promotions hit.
Choosing the Right Method
Your business stage determines your method more than anything else.
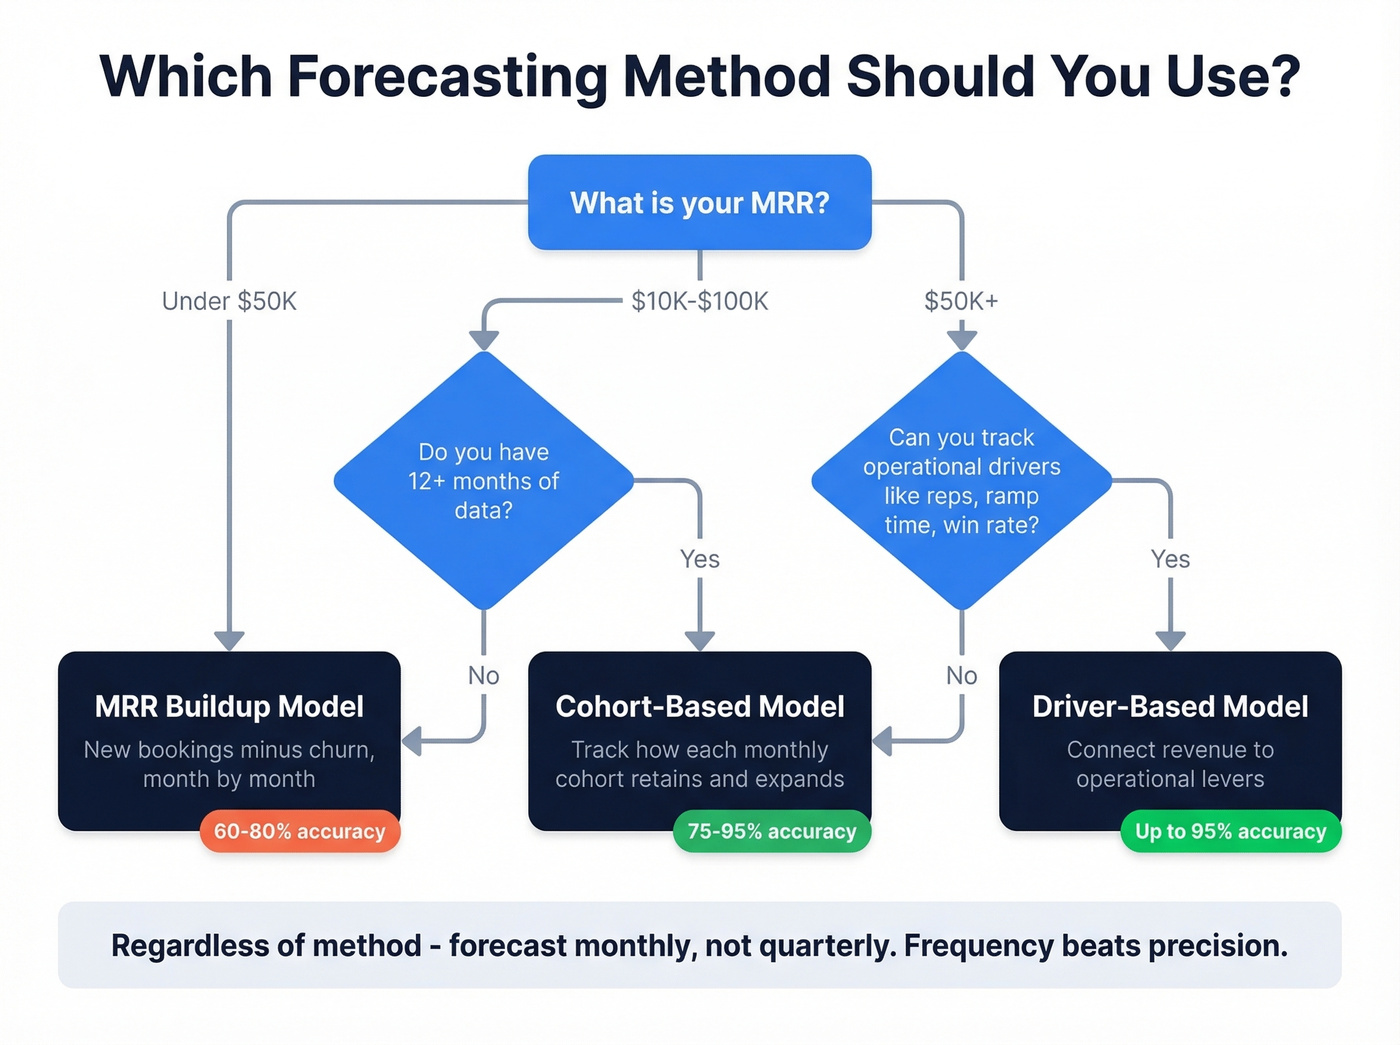
| Stage | MRR Range | Best Method | Expected Accuracy |
|---|---|---|---|
| Early | $5K-$50K | MRR buildup | 60-80% |
| Mid | $10K-$100K | Cohort-based | 75-95% |
| Scale | $50K+ | Driver-based | Up to 95% w/ AI |
Early-stage companies don't have enough data for regression or cohort analysis. An MRR buildup model - new bookings minus churn, month by month - is the honest approach. It won't be precise, but it'll be directionally right for 1-3 month horizons.
Once you have 12+ months of data, cohort-based modeling becomes viable: how does each monthly cohort retain, expand, and churn over time? This is where accuracy jumps meaningfully. Driver-based models at scale connect revenue to operational inputs - reps hired, ramp time, pipeline creation rate, win rate, average deal size. These models are powerful but complex. Don't build one until you have the data to feed it.
Business model matters too. SaaS companies model MRR waterfalls. Agencies model pipeline-weighted project revenue against capacity ceilings. E-commerce tracks AOV x conversion rate x traffic. Usage-based pricing companies need real-time consumption data - Metronome reports that real-time analytics cut forecasting errors by 5-10%.
I'll say it plainly: stop trying to forecast more accurately. Start trying to forecast more frequently. A monthly forecast that's 80% accurate and updated regularly beats a quarterly forecast that's 90% accurate but stale by week six. The teams we've seen forecast best aren't the ones with the fanciest tools - they're the ones that update most often.
To tighten the pipeline inputs that feed your model, it helps to track pipeline health and address common sales pipeline challenges before they show up as forecast misses.
66% of leaders say bad CRM data kills forecast accuracy. Prospeo enriches your pipeline with 98% verified emails, 125M+ direct dials, and 50+ data points per contact - refreshed every 7 days, not every 6 weeks.
Clean pipeline data is the forecast fix no model can replace.
SaaS Churn, Expansion, and Cohort Math
SaaS forecasting has a unique challenge: your existing revenue is constantly decaying. If you're not modeling churn and expansion separately, you don't have a forecast - you have a wish.
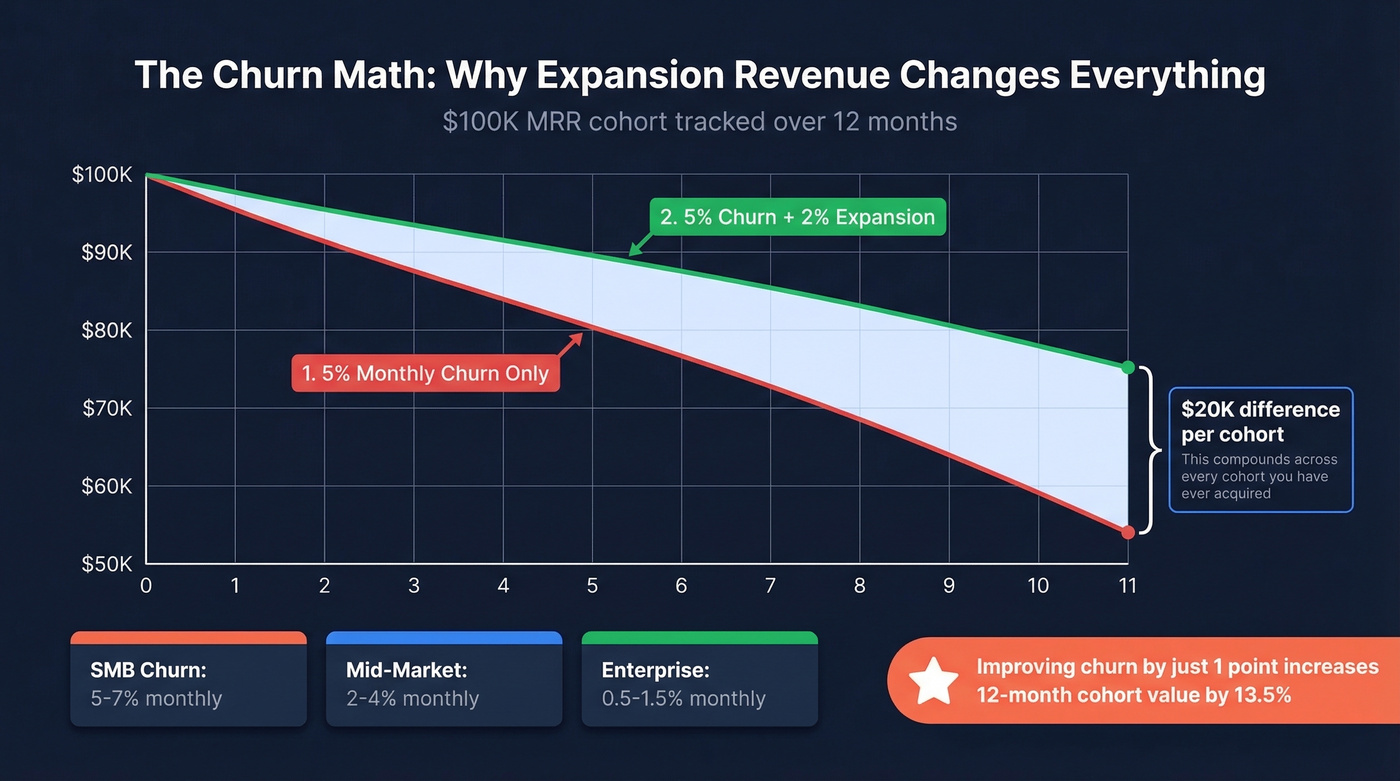
The churn math is brutal. Take a $100K MRR cohort with 5% monthly gross churn:
| Month | 5% Churn Only | 5% Churn + 2% Expansion |
|---|---|---|
| Month 0 | $100,000 | $100,000 |
| Month 2 | $90,250 | $95,099 |
| Month 5 | $77,378 | $87,481 |
| Month 11 | $53,944 | $74,036 |
Without expansion, that cohort loses nearly half its value in a year. Add just 2% monthly expansion from surviving customers, and you retain $74K instead of $54K. That $20K difference compounds across every cohort you've ever acquired.
The leverage point: improving churn by just 1 percentage point - from 5% to 4% monthly - increases 12-month cohort value by 13.5%.
Use these churn benchmarks when you don't have your own data yet:
| Segment | Monthly Churn Range |
|---|---|
| SMB SaaS | 5-7% |
| Mid-market | 2-4% |
| Enterprise | 0.5-1.5% |
The monthly waterfall formula: Starting MRR + New Bookings + Expansion - Churn = Ending MRR. Pull baseline assumptions from your trailing 3-6 month averages. NRR benchmarks give you a reality check - median NRR sits at 101%, with the 75th percentile at 110%.
If you want a deeper framework for modeling retention, expansion, and churn drivers, see our guide to churn analysis and the breakdown of what is churn.
How to Build a Revenue Forecast
Here's how to build a forecast from scratch, whether you're a seed-stage startup or a scaling team creating its first real model.
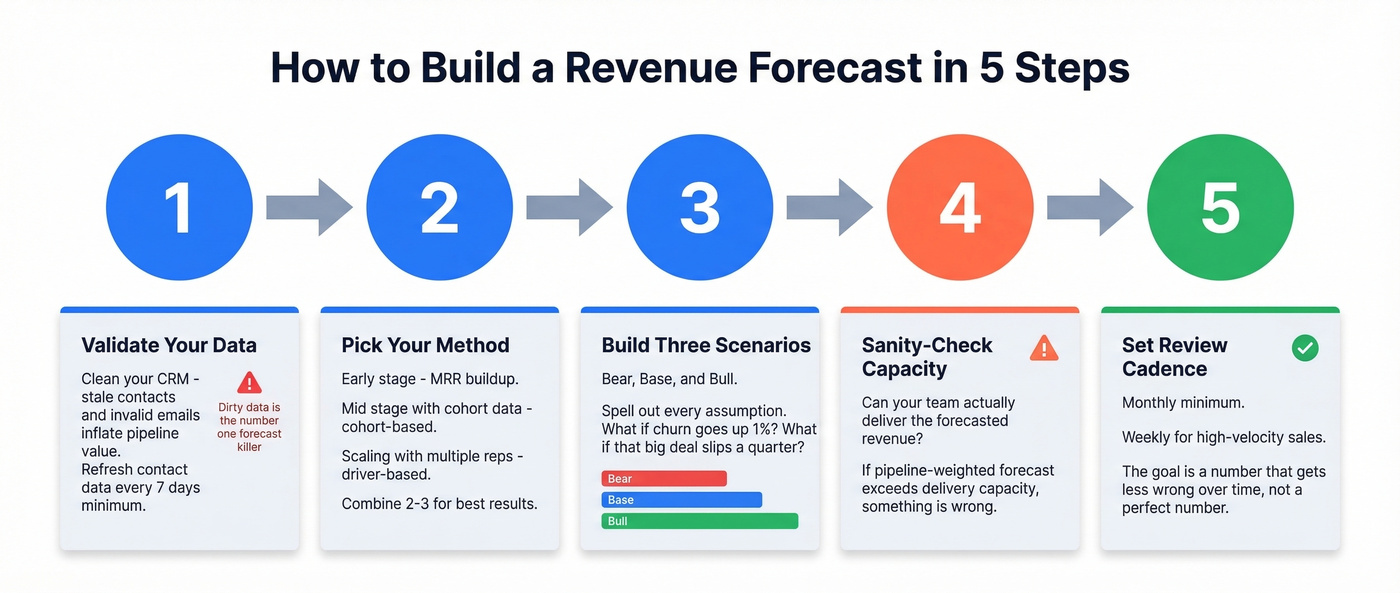
Step 1: Validate your data. Your forecast is only as accurate as the data feeding it. If your CRM has stale contacts and invalid emails, your pipeline value is inflated - you're forecasting against phantom opportunities. Tools like Prospeo keep contact databases clean with 98% email accuracy and an 83% enrichment match rate, refreshed every 7 days. Clean pipeline data means the numbers you're modeling actually reflect reality.
Step 2: Pick your method. Match it to your stage using the framework above. Early-stage? MRR buildup. Mid-stage with cohort data? Cohort-based. Scaling with multiple reps? Driver-based.
Step 3: Build bear/base/bull scenarios. A single-point forecast is a lie. Build three scenarios with explicit assumptions. What happens if churn ticks up 1%? What if that enterprise deal slips a quarter?
Step 4: Sanity-check against your capacity ceiling. Can your team actually deliver the revenue you're forecasting? If not, your forecast is aspirational, not analytical.
Step 5: Set a review cadence. Monthly minimum. Weekly if you're running high-velocity sales. The goal isn't a perfect number - it's a number that gets less wrong over time.
One practical tip: Excel's built-in Forecast Sheet tool handles basic time-series forecasting well. Select your date and value columns, go to Data -> Forecast Sheet, and hit Create. You don't need an expensive platform to start.
If your forecast depends on rep-entered pipeline, it also helps to standardize sales activities and tighten your sales process optimization so stages and probabilities mean the same thing across the team.
Bottom-up forecasts fail when rep pipeline data is stale. Prospeo's 7-day refresh cycle and 92% enrichment match rate ensure every deal in your CRM has current, verified contact data - so your forecast reflects reality, not last quarter's leftovers.
Stop forecasting on dirty data. Start with contacts you can actually reach.
Best Practices for Ongoing Accuracy
Beyond method selection, a few disciplines separate teams that forecast well from those that don't.
Separate new revenue from existing revenue. Model new bookings, expansion, and churn as distinct line items - never lump them together. This single change catches more errors than any tool upgrade.
Automate your data pulls. A dashboard that updates from your CRM in real time eliminates the lag and copy-paste errors that compound over weeks. Manual spreadsheet pulls are where forecasts go to die.
Combine methods. Blend a bottom-up pipeline forecast with a top-down driver-based estimate and investigate any gap between them. When the two numbers diverge by more than 15%, something important is hiding in the assumptions.
Track accuracy with MAPE, not vibes. "We hit the number" isn't a measurement system. Mean Absolute Percentage Error gives you a trend line you can improve quarter over quarter.
Make it cross-functional. Sales knows the pipeline. Marketing knows the funnel. Product knows the roadmap. Skip this if you want a model that looks good in a slide deck but falls apart in reality - cross-functional input is what turns a spreadsheet into a forecast.
If you're formalizing this process across teams, a dedicated RevOps Manager function can be the difference between a monthly ritual and a quarterly fire drill.
Measuring Forecast Accuracy
Not all misses are equal. You need a framework for what "good" looks like.
| Tier | Accuracy Range |
|---|---|
| Acceptable | 80-85% |
| Good | 85-95% |
| World-class | 95%+ |
These benchmarks from Fullcast give you a target. But you also need to know how you're measuring. Three metrics matter:
MAPE measures average deviation as a percentage. It's the most common metric and the easiest to communicate to leadership. MAE gives you the average dollar deviation - more useful for operational planning because it speaks in actual revenue terms. Forecast Bias tells you whether you're systematically over- or under-forecasting. A team that's consistently 10% optimistic has a bias problem, not an accuracy problem, and the fix is different.
Track your accuracy over time, not just per quarter. If your MAPE is improving quarter over quarter, you're doing it right even if you haven't cracked 85% yet.
Common Mistakes
Hockey stick without a driver. If your forecast shows flat revenue for three quarters then a sudden spike, you need a concrete explanation - new reps ramping, a product launch, a channel partnership. Growth inflections don't happen by magic.
Ignoring churn. Even "low" churn compounds brutally. We covered the math above: a 5% monthly rate means you lose nearly half a cohort in a year. Model it explicitly or don't bother forecasting.
Confusing bookings, billings, and revenue. That $120K contract is $10K/month in recognized revenue. Forecasting the wrong number leads to cash surprises that no one enjoys explaining to the board.
"Just take the average." This is the most common beginner mistake, and r/financialmodelling threads are full of people learning it the hard way. Averaging historical revenue breaks for volatile or growing companies. If you grew 40% last year, your average understates next year. If you had one massive deal, your average overstates it.
Building in isolation. We've seen teams where the finance model and the sales pipeline live in completely different universes. By the time someone notices the gap, it's too late to course-correct.
AI and Predictive Forecasting
AI-powered forecasting platforms promise to push accuracy from the traditional 60-75% range into 90-98% territory. Those numbers come from vendor roundups, not independent research, so take them with appropriate skepticism. Predictive forecasting works best when your underlying data is clean and consistent - AI amplifies the quality of your inputs, for better or worse.
| Tool | Typical Pricing |
|---|---|
| Clari | ~$100-120/user/mo |
| Gong Forecast | ~$250/user/mo (bundled) |
| Salesforce Einstein | $50-220/user/mo |
| HubSpot Sales Hub | $45-150/user/mo |
| Forecastio | ~$49-99/user/mo |
| Zoho Zia | $14-40/user/mo |
| Oliv AI | ~$19/user/mo |
| Excel (Microsoft 365) | Free with subscription |
Real talk: for a 10-person startup, Excel and good judgment will outperform a $100/user/month platform. AI forecasting tools earn their keep when you have meaningful volume, multiple reps generating pipeline, and enough clean history for patterns to be real instead of random.
When you do reach that threshold, Clari and Gong are the category leaders. Salesforce Einstein makes sense if you're already deep in the Salesforce ecosystem. Forecastio and Zoho Zia punch above their weight for mid-market teams on a budget, and Oliv AI is the cheapest entry point for teams wanting to experiment with AI-assisted forecasting.
If you're evaluating vendors, start with a shortlist of best sales forecasting tools or more general sales forecasting solutions to compare fit and pricing.
FAQ
What is revenue forecasting?
Revenue forecasting is predicting how much money your company will generate over a specific period using historical data, pipeline analysis, and operational assumptions. It differs from a revenue projection, which is goal-influenced and used for scenario planning. Forecasts tell you what's likely; projections tell you what's possible.
How often should you update a forecast?
Monthly at minimum, weekly for high-velocity sales teams. A forecast updated monthly catches pipeline shifts that a quarterly forecast misses entirely. The companies with the best accuracy treat forecasting as a continuous process, not a quarterly event.
What's the best method for startups?
An MRR buildup model: new bookings minus churn, month by month. Expect 60-80% accuracy for 1-3 month horizons. Don't buy forecasting software yet - invest in clean data and honest assumptions first.
What accuracy should I target?
80-85% is acceptable for most B2B companies. 85-95% is good and achievable with disciplined process. 95%+ is world-class and typically requires AI-assisted tools plus mature data infrastructure. Track your MAPE trend quarter over quarter rather than obsessing over a single period.
How does data quality affect forecast accuracy?
Dirty CRM data is the number-one roadblock - 66% of leaders cite it as their top forecasting challenge. Invalid emails, stale contacts, and outdated company data inflate pipeline values and produce systematically optimistic forecasts. Keeping your contact database verified and current is the single highest-ROI investment you can make in forecast accuracy.