What Is TAM in Finance? How Investors and Analysts Actually Use It
42% of failed startups cite lack of market need as the reason they went under. That's not a product problem - it's a sizing problem.
TAM, or Total Addressable Market, is the maximum revenue opportunity available if you captured 100% of a given market. It's the number that anchors investment memos, valuation models, and the pitch deck slide that investors either trust or skip entirely. Get it wrong and you're building on sand.
Quick Version
- TAM = your revenue ceiling. Total demand for a product or service, expressed in dollars, assuming zero competition and full market capture.
- Finance professionals use it everywhere. Investment memos, IC presentations, valuation models, pitch decks - TAM isn't a marketing exercise.
- Bottom-up beats top-down for credibility. If your top-down and bottom-up estimates align within ~15%, your assumptions are solid. If they don't, dig deeper before presenting.
TAM, SAM, and SOM Explained
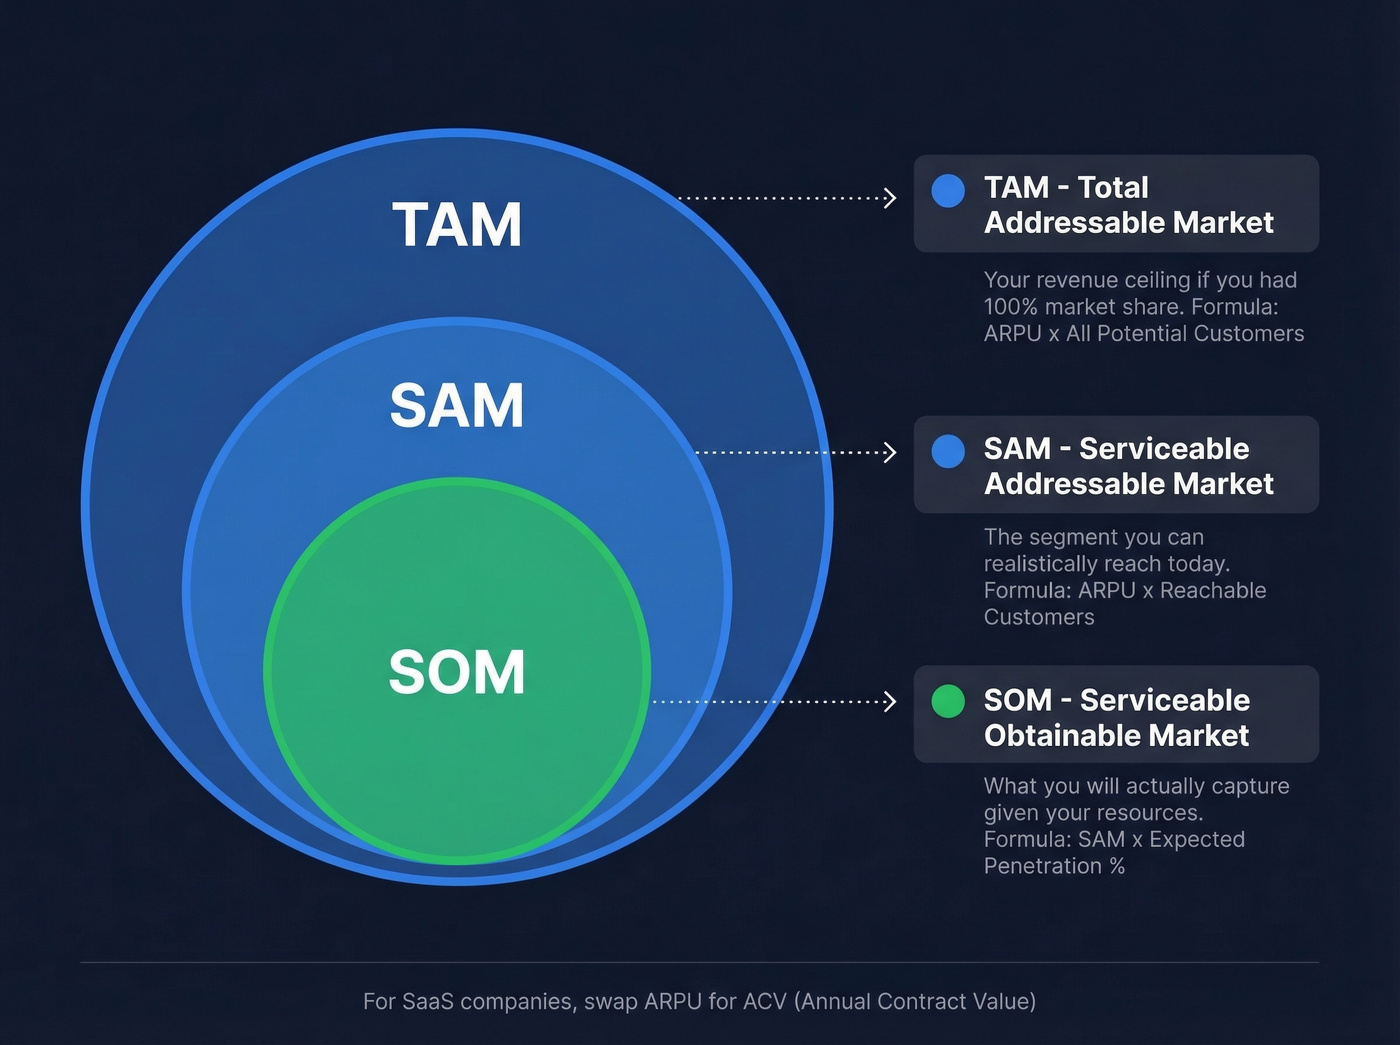
TAM doesn't exist in isolation. It sits at the top of a three-layer funnel that narrows from ambition to execution: TAM is the ceiling, SAM is where you can realistically win today, and SOM is the revenue you'll actually capture given your budget, team, and competitive position. If you want a deeper breakdown of the framework, see our guide to the addressable market.
| Metric | What It Represents | Formula |
|---|---|---|
| TAM | Total market demand | ARPU x all potential customers |
| SAM | Serviceable segment | ARPU x reachable customers |
| SOM | Realistic capture | SAM x expected penetration % |
For SaaS, swap ARPU for ACV (annual contract value) and "customers" for "accounts." The logic is identical - Wall Street Prep frames it as a revenue opportunity, not just a customer count.
Three Ways to Calculate TAM
Top-Down
Start with a published industry figure - say, an analyst estimate for a category like CRM - then filter down by geography, segment, or use case. It's fast and easy to source, but it amplifies errors because you're stacking broad assumptions on secondary data. Best for established industries with reliable reports.
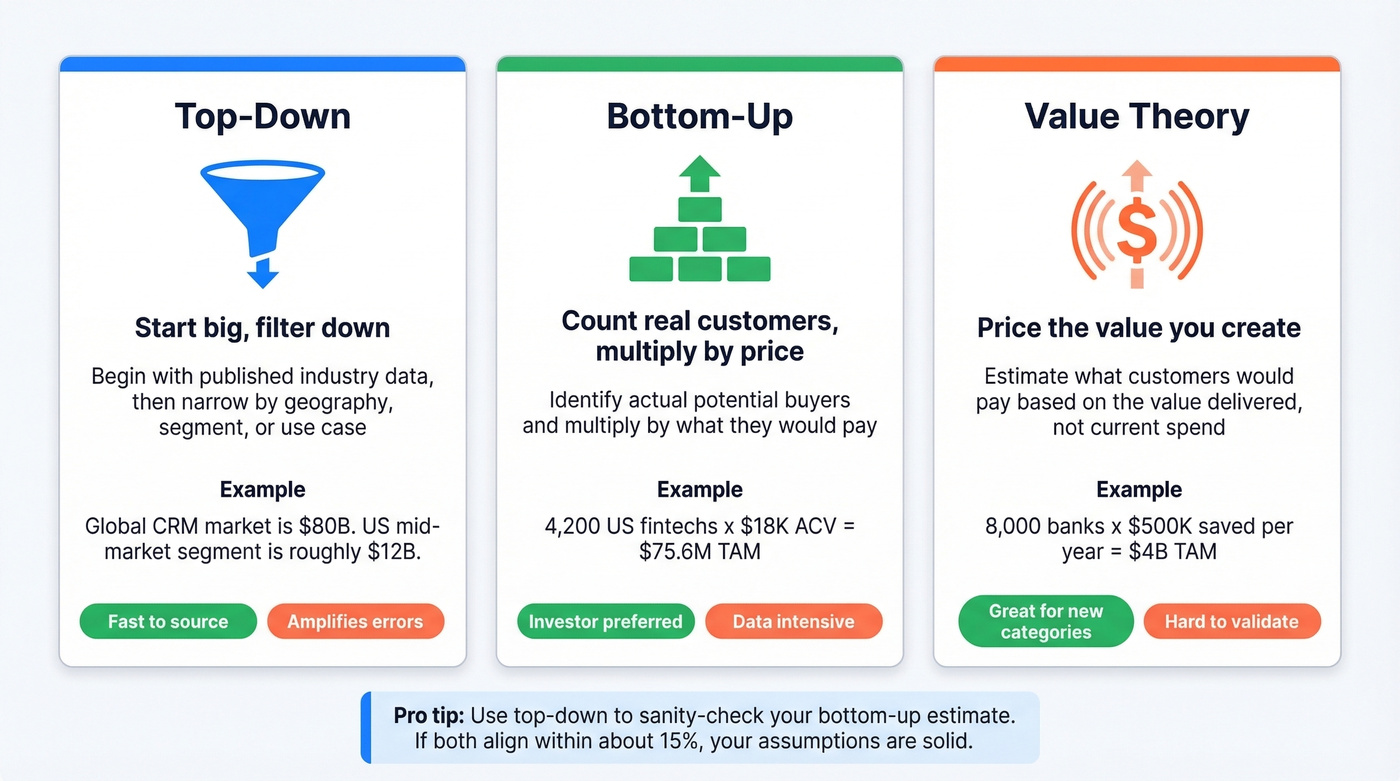
Bottom-Up (What Investors Actually Want)
Count your potential customers, multiply by what they'd pay. Say you sell compliance software to mid-market fintechs. There are roughly 4,200 fintechs with 50-500 employees in the US. At $18K ACV, your bottom-up TAM is $75.6M. That's the kind of specificity investors want - real customer counts and real pricing, not a big industry number divided by hope.
The consensus on r/startups is blunt: investors skip inflated TAM slides. Bottom-up with real data is the only version they take seriously.
Value Theory
Estimate what customers would pay for the value your product creates, then multiply by total potential users. If a compliance tool saves a bank $500K/year in regulatory fines, and 8,000 banks are in-scope, the value-theory TAM is $4B - regardless of what those banks currently spend on compliance software. This works best for novel categories where no existing market data exists.
Here's the thing: don't pick just one method. Use top-down to sanity-check the magnitude of your bottom-up estimate. If both land within ~15% of each other, your assumptions hold up. If they're wildly different, one of your inputs is wrong and you need to find it before anyone else does.
If you're building a repeatable process around this, it helps to formalize your ideal customer profile first so your counts don't drift.
Bottom-up TAM requires real customer counts - not guesses. Prospeo's database of 300M+ professional profiles with 30+ filters (industry, headcount, revenue, technographics, funding) lets you count exact prospects in any segment. Build a defensible TAM slide with actual data, not analyst estimates.
Stop estimating your market. Count it.
Where TAM Shows Up in Finance
Total addressable market appears in specific, high-stakes finance workflows - and it carries real weight in each one.
Carta lists market opportunity, including TAM, SAM, and SOM, as a standard diligence section for angels, VCs, and PE firms. If you can't quantify your market, the investment memo falls apart before it reaches committee. On pitch decks, investors don't want a $500B global number. They want a defensible bottom-up estimate that proves you understand your customer. In valuation models, SOM feeds revenue forecasts, which feed EBITDA, which feed exit multiples.
A quick example: assume SOM of $5M in year two, 25% EBITDA margin, and an 8x exit multiple. That's $1.25M EBITDA, $10M valuation. An investor who put in $250K for 20% equity gets an 8.0x return. Scale SOM to $12M by year four and the math shifts dramatically: $3M EBITDA, $24M valuation, 19.2x return. TAM is the ceiling that makes those SOM projections believable - or not.
We've built enough of these models to know the number itself matters less than the logic behind it. If you're pressure-testing assumptions, a simple churn analysis can also change what "realistic capture" looks like.
Real-World TAM Examples
Airbnb has presented TAM as three buckets: $1.8T in short-term stays, $210B in longer-term stays, and $1.4T in experiences - totaling $3.4T. Ambitious? Absolutely. But roughly half of the global hotel industry is business travel, and almost none of that moved to Airbnb. The $3.4T number told a story, but the actual addressable slice was far narrower. That gap between headline TAM and real opportunity is exactly what investors probe during diligence.
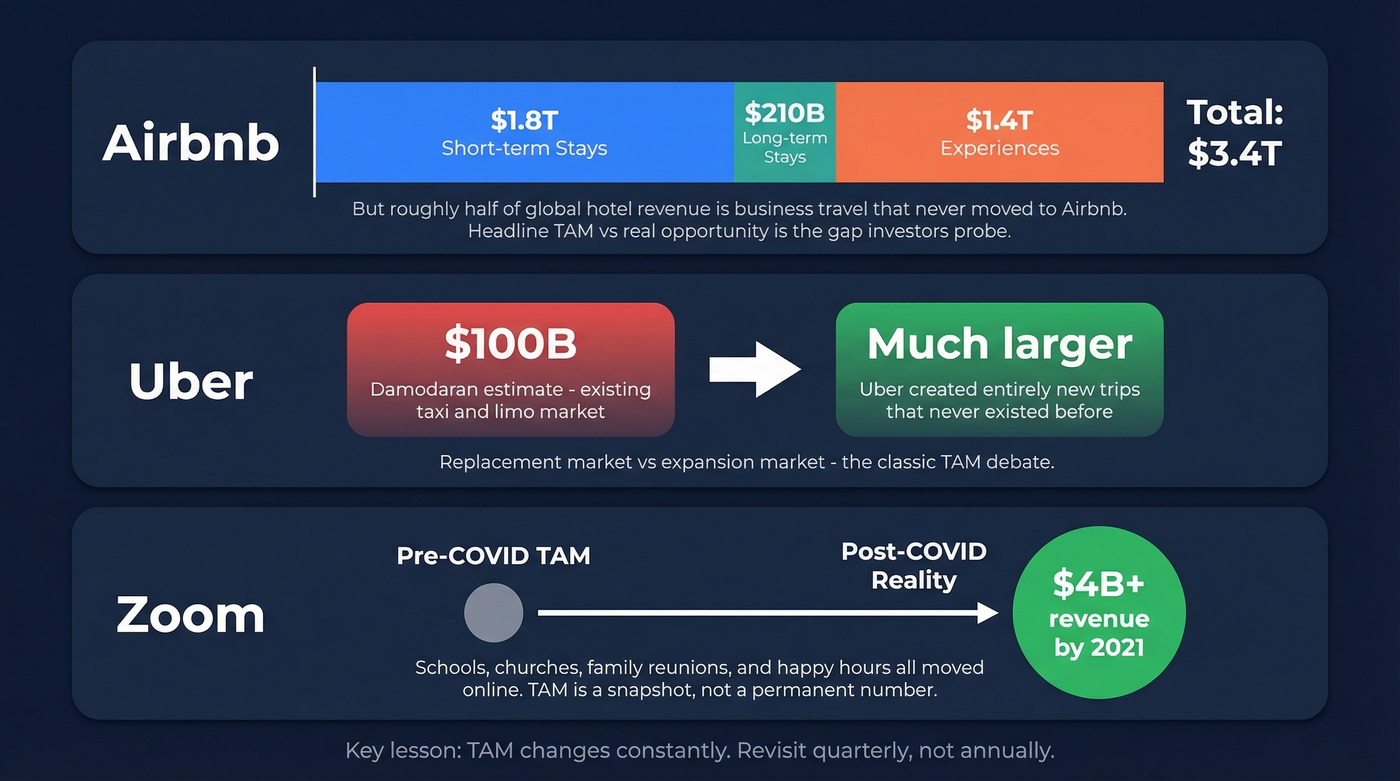
Uber is the classic TAM debate. NYU professor Aswath Damodaran estimated the ride-hailing TAM at $100B based on existing taxi and limo revenue. The core rebuttal is simple: Uber doesn't just replace taxis - it creates entirely new trips. Damodaran sized a replacement market when Uber was building an expansion market.
Zoom had a pre-COVID TAM anchored to corporate video conferencing spend. Then schools, churches, family reunions, and happy hours all moved online, and revenue blew past $4B by 2021. TAM is a snapshot, not a permanent number.
Common TAM Mistakes
The "1% of the market" fallacy. Saying "we just need 1% of a $100B market" is the fastest way to get your deck skipped. It signals you haven't done the work. In our experience, we've seen decks get passed on within 30 seconds because the TAM slide was a single big-number estimate with no bottom-up backup.
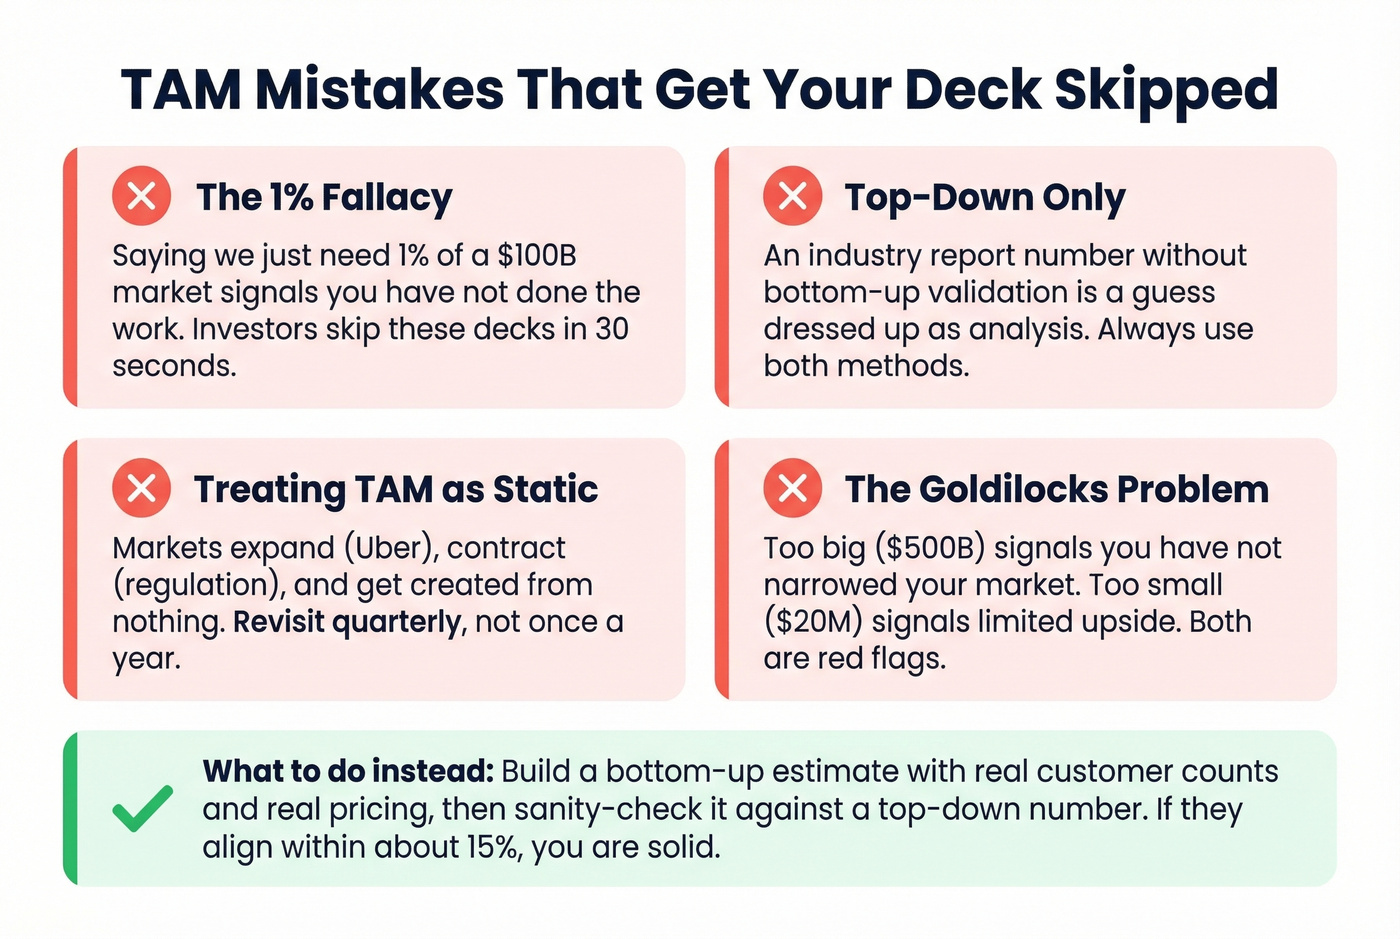
Top-down only. An industry report number without bottom-up validation is a guess dressed up as analysis. Use both methods.
Treating TAM as static. Markets expand (Uber), contract (regulatory shifts), and get created from nothing (new categories). Revisit your TAM quarterly, not annually.
The Goldilocks problem. Investors treat TAM as a sizing test. Too big signals you haven't narrowed your market; too small signals limited upside. A $500B TAM is just as suspicious as a $20M one. Flawed estimates lead to misallocated spend, misguided product decisions, and investor confidence loss.
Let's be honest: if your average deal size is under $10K and you're selling to SMBs, you probably don't need a TAM slide at all. You need a cost to acquire customer slide. TAM matters most when the market size itself is the question - not when the question is whether you can acquire customers profitably.
How to Run a TAM Analysis With Real Data
The hardest part of bottom-up TAM isn't the math. It's finding the inputs. A rigorous analysis combines multiple data sources so your assumptions hold up under investor scrutiny, and the table below shows where to start depending on your budget and what you're sizing.
| Source | Cost | Best For |
|---|---|---|
| US Census Bureau | Free | Business counts by industry/size |
| Bureau of Labor Statistics | Free | Roles by industry/function |
| SEC filings | Free | Public company financials |
| IBISWorld | ~$500-$1,500/report | NAICS-mapped industry data |
| Statista | ~$79/mo | Quick market stats |
| Gartner/Forrester | ~$10K-$30K+/yr | Deep industry forecasts |
| PitchBook | ~$20K-$50K+/yr | Investor-grade deal data |
For B2B bottom-up TAM, off-the-shelf reports only get you so far. You need to count the actual companies that match your ICP - by headcount, revenue band, tech stack, funding stage, and geography. That's where a platform like Prospeo helps: 30+ search filters across 300M+ professional profiles let you size your addressable market using real company counts instead of guessing from generic industry averages. If you're operationalizing this for outbound, pair it with a clean lead generation workflow so TAM turns into a list you can actually work.
Skip this approach if you're sizing a consumer market or a category where company-level data doesn't matter. Government data and analyst reports will serve you better there.
Once you've sized your TAM, you need to reach those accounts. Prospeo delivers 98% verified emails and 125M+ direct dials so your SOM isn't theoretical - it's a pipeline. Filter by buyer intent, job changes, and department headcount to find in-market buyers right now.
Turn your TAM analysis into booked meetings at $0.01 per lead.
FAQ
What's the difference between TAM and market share?
TAM is the total revenue opportunity - the ceiling. Market share is the percentage you've actually captured. A $500M TAM with 2% market share means $10M in revenue. They're related but measure fundamentally different things.
Can TAM change over time?
Constantly. Uber created demand that didn't exist in the taxi market. Regulatory shifts can shrink markets overnight. COVID expanded Zoom's TAM by orders of magnitude in weeks. Treat your total addressable market as a living input you revisit at least quarterly, not a one-time calculation you set and forget.
Which TAM calculation method do investors prefer?
Bottom-up. It's grounded in real customer counts and actual pricing, not analyst projections. Use top-down as a sanity check - if both methods align within ~15%, your assumptions are solid. Most Series A+ investors will challenge any TAM that lacks bottom-up support.
How do you count addressable companies for a bottom-up estimate?
Start with government data like the Census Bureau and BLS for broad industry counts, then narrow by ICP filters: headcount, revenue, tech stack, funding stage. B2B data platforms with granular company-level filters give you precise counts instead of rough industry averages - which is exactly the kind of specificity that survives investor scrutiny.