Annual Recurring Revenue: The Complete Guide for SaaS Teams
Most ARR guides stop at MRR x 12. That's the kindergarten version. In a poll of 50 SaaS companies, 2 out of 5 were including or excluding something they shouldn't in their annual recurring revenue calculations - and most of those mistakes came from treating ARR as a simple formula instead of a policy decision. The real calculation involves edge cases around usage pricing, implementation timing, contract ramps, and AI credits that no single formula covers.
Here's the thing: if your ARR methodology wouldn't survive a 30-minute conversation with a diligence team, you don't have a methodology. You have a spreadsheet. Let's fix that.
What ARR Actually Is
Annual recurring revenue is the forward-looking run-rate of recurring subscription income over the next 12 months from your current customer base. It's not a GAAP metric. It's not revenue you've already earned. It's a snapshot of what your business would generate over the next year if nothing changed - no new customers, no churn, no expansion.
Founders track it as a growth signal. Investors use it to calculate valuation multiples. FP&A teams reconcile it against GAAP revenue and try to keep the board from confusing the two. Public companies that disclose ARR-style metrics typically exclude professional services and one-time fees and disclose the methodology - that's the standard your definition should meet.
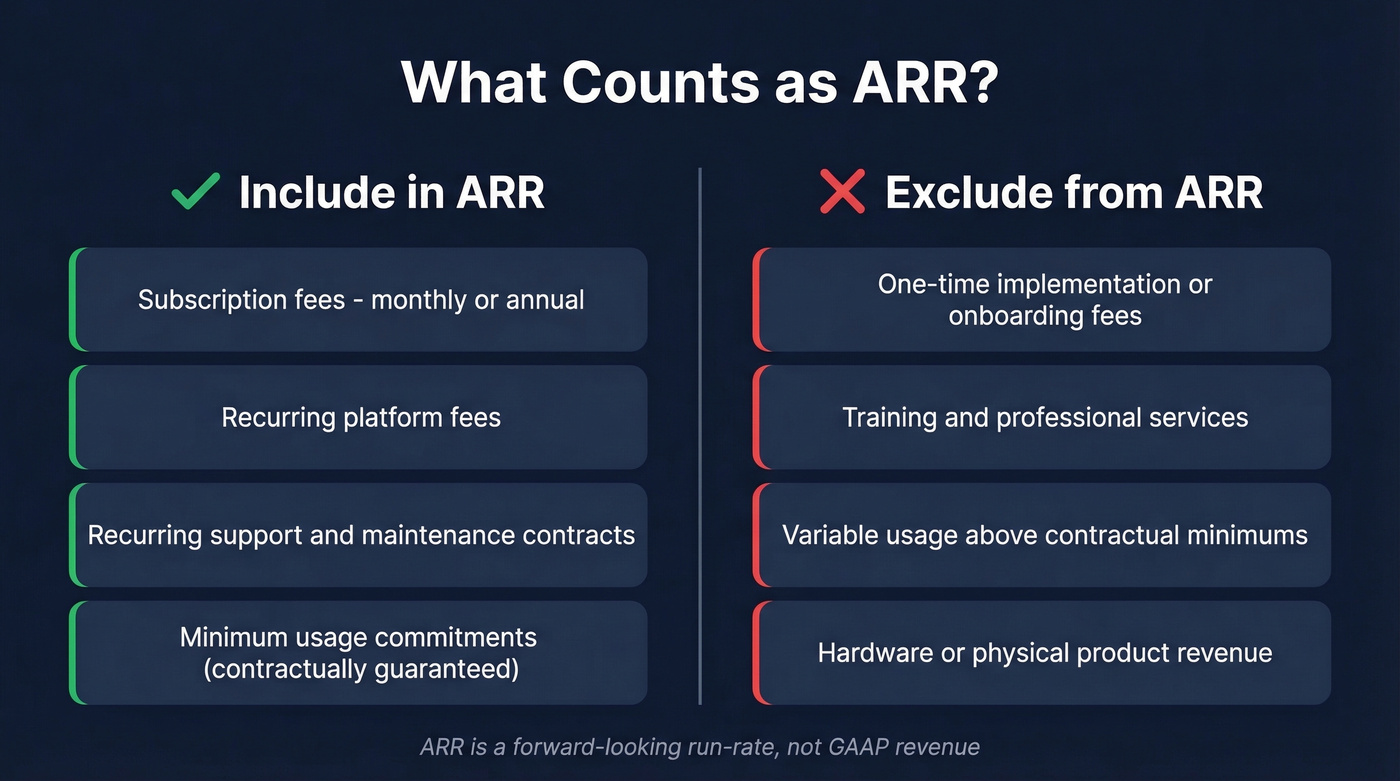
Include in ARR:
- Subscription fees, whether monthly or annual
- Recurring platform fees
- Recurring support and maintenance contracts
- Minimum usage commitments that are contractually guaranteed
Exclude from ARR:
- One-time implementation or onboarding fees
- Training and professional services
- Variable usage above contractual minimums (unless predictable at the portfolio level)
- Hardware or physical product revenue
How to Calculate ARR
There's no single formula. The right method depends on your billing model, contract structure, and how much complexity you're willing to defend in a board meeting.
MRR x 12
The simplest version. Take your monthly recurring revenue and multiply by 12.
If your MRR is $85,000, your ARR is $1,020,000. Done. Think of it like a streaming service: if a plan is $8.99/month and you have 10,000 subscribers on that tier, the MRR is $89,900 and the ARR is $1,078,800. Clean, no ambiguity. This works when every customer pays monthly, there are no multi-year contracts, and usage-based revenue is negligible. For early-stage SaaS with straightforward pricing, it's perfectly fine.
The problems start when your billing gets more complex.
Contract Annualization
For multi-year contracts, you annualize the total contract value by dividing TCV by the number of contract years. A $240,000 two-year contract contributes $120,000 in ARR - not $240,000. This seems obvious, but we've seen companies accidentally count the full TCV as ARR during fundraising prep. Investors catch it immediately.
The ARR Bridge
This is what separates a spreadsheet number from a real ARR analysis. The bridge breaks your ARR movement into five components:
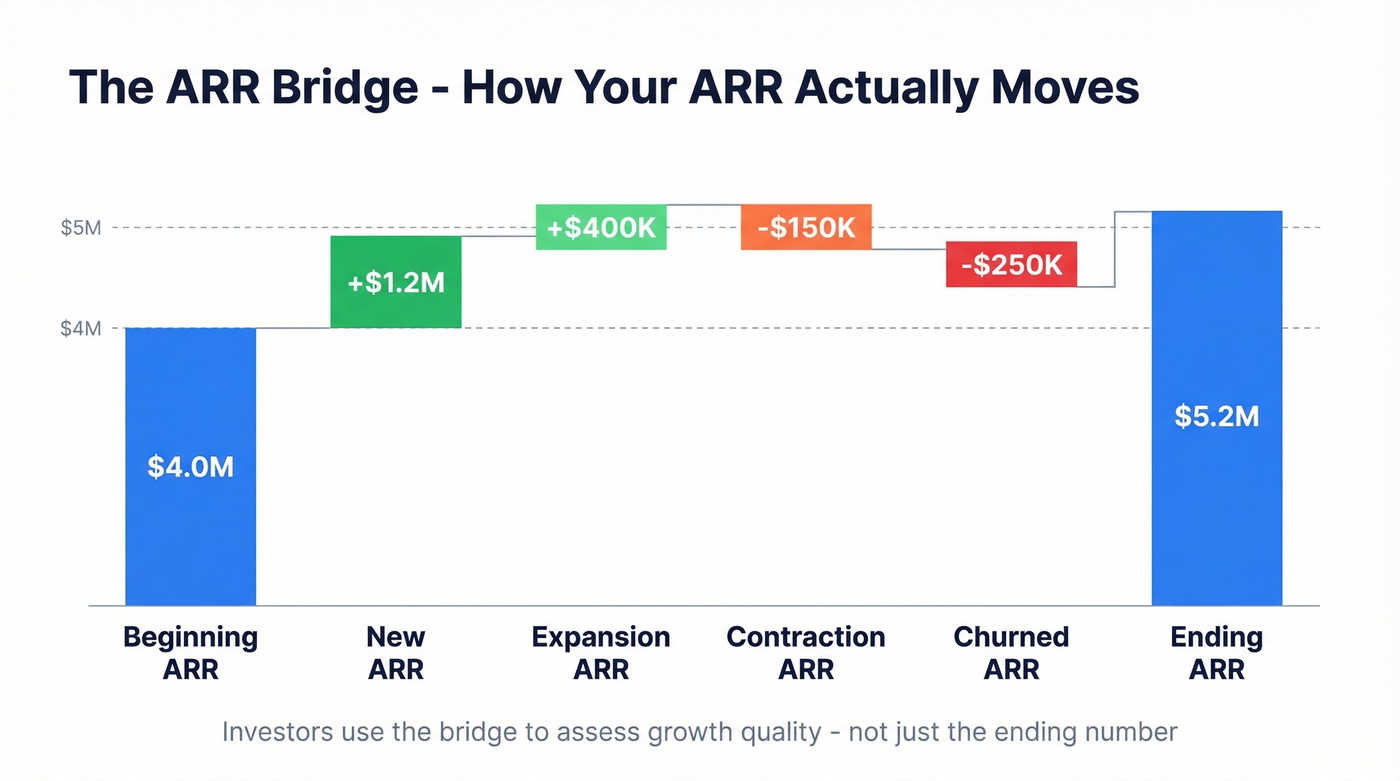
Beginning ARR + New ARR + Expansion ARR - Contraction ARR - Churned ARR = Ending ARR
Here's a real example:
| Component | Amount |
|---|---|
| Beginning ARR | $4,000,000 |
| + New ARR | $1,200,000 |
| + Expansion ARR | $400,000 |
| - Contraction ARR | ($150,000) |
| - Churned ARR | ($250,000) |
| = Ending ARR | $5,200,000 |
If a Series A investor asks you to "walk me through your ARR Bridge" and your ARR is a single number in a spreadsheet with no decomposition, the conversation is effectively over. The bridge isn't optional - it's how investors assess the quality of your growth. A company growing from $4M to $5.2M through mostly new business tells a fundamentally different story than one growing through expansion of existing accounts.
ARR vs MRR vs Total Revenue
These three metrics measure different things over different time horizons. Using the wrong one in the wrong context creates confusion fast.
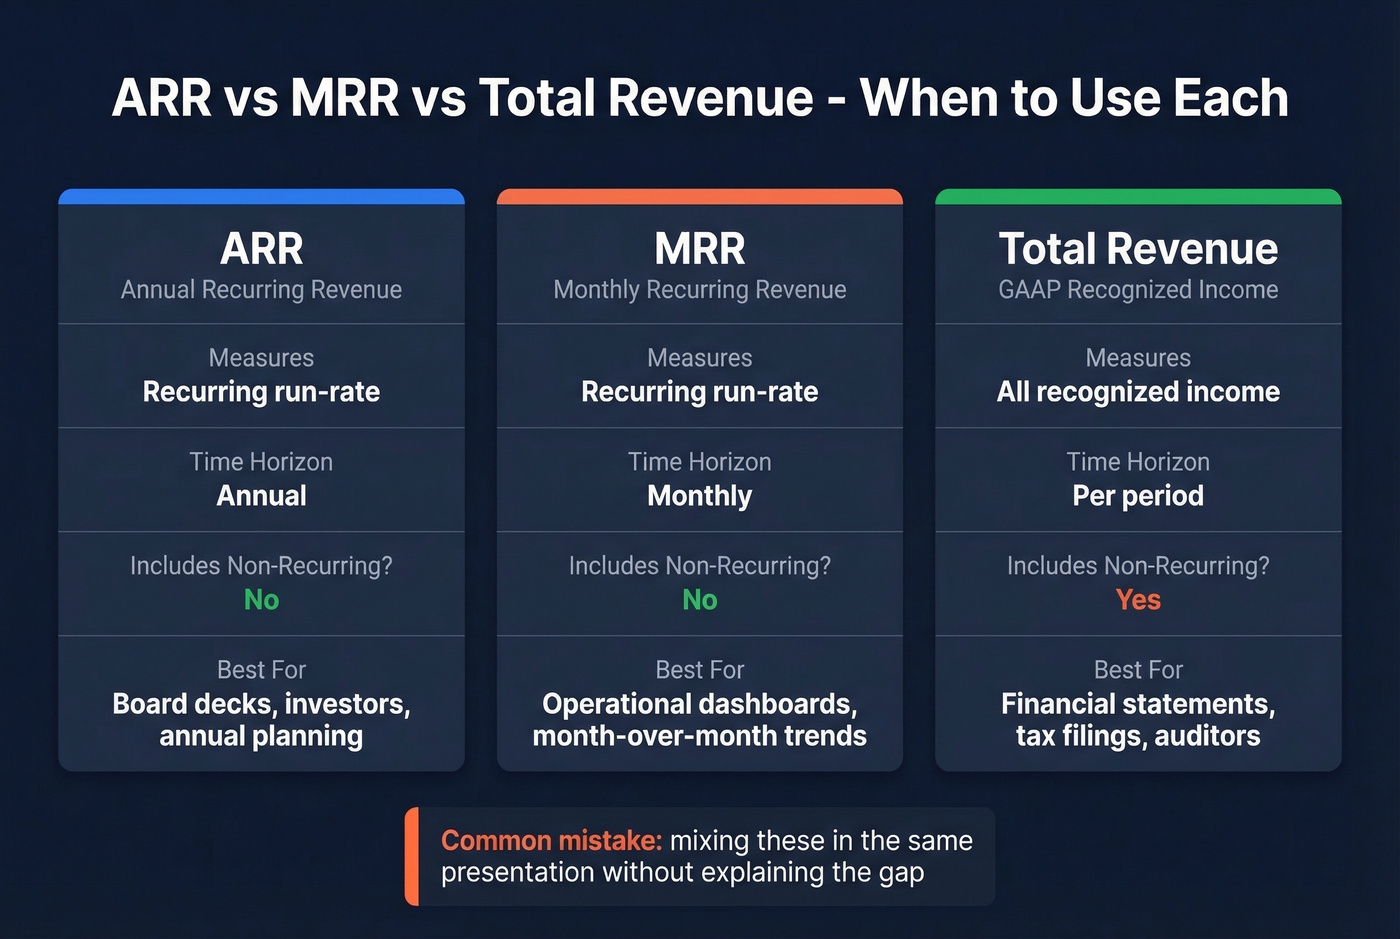
| Metric | What It Measures | Time Horizon | Non-Recurring? | Best For |
|---|---|---|---|---|
| ARR | Recurring run-rate | Annual | No | Planning, investors |
| MRR | Recurring run-rate | Monthly | No | Month-to-month ops |
| Total Revenue | All recognized income | Per period | Yes | GAAP compliance |
Use MRR for operational dashboards and month-over-month trend analysis. Use ARR for annual planning, board decks, and investor communications. Use GAAP total revenue for financial statements, tax filings, and anything that touches an auditor.
The common mistake is mixing them in the same presentation. Your board deck shows ARR growth of 30%, but your P&L shows revenue growth of 18% because of recognition timing. That gap isn't a problem - it's expected. But you need to explain it before someone asks.
ARR vs GAAP Revenue
Why They Don't Match
Under ASC 606 and IFRS 15, revenue is recognized as performance obligations are delivered. A $12,000 annual contract recognized under GAAP becomes $1,000 per month, regardless of when cash hits your bank account. ARR, by contrast, is a forward-looking run-rate.
They don't need to match. Trying to force a reconciliation wastes time. GAAP revenue is for taxes, audits, and SEC filings; ARR is for analytics and business strategy. They should be in the same order of magnitude and use the same underlying data sources, but expecting them to reconcile to the penny is a fool's errand.
The gap widens over time because contract modifications - upgrades, downgrades, add-ons - force mid-stream recalculations under ASC 606's five-step model. Each modification can reallocate the transaction price across performance obligations, creating GAAP adjustments that have no ARR equivalent. The more contracts you modify, the more the two numbers diverge.
Two Mismatch Scenarios That Come Up Constantly
Discount allocation. You sell a $100K implementation package plus a $100K annual subscription, but you discount the implementation to $0 as a sales incentive. Management counts $100K in ARR. Under ASC 606, the discount gets allocated across both performance obligations. In a simplified 50/50 allocation, GAAP recognizes only $50K of subscription revenue - half of what management calls ARR. Neither number is wrong. They're measuring different things.
Timing mismatch. A contract starts December 29 with an ACV of $365. Management immediately counts $365 in ARR for December reporting. GAAP recognizes roughly $3 for December (three days of a 365-day contract). Your December ARR report shows $365 of new ARR. Your December income statement shows $3 of new revenue. Both correct - just answering different questions.
These mismatches multiply across hundreds of contracts. That's why FP&A practitioners describe ARR reporting as "manual and error riddled" - and why the fix isn't reconciliation. It's having a clear, documented ARR policy that your board and investors have signed off on.
Your ARR bridge depends on new logos and expansion revenue - both require reaching real decision-makers. Prospeo's 300M+ profiles with 98% email accuracy and 125M+ verified mobiles mean your pipeline actually converts. Teams book 26% more meetings than with ZoomInfo.
Stop feeding your ARR bridge with bounced emails and dead leads.
Benchmarks and Valuation Multiples in 2026
Growth and Retention
The most reliable benchmark data for private SaaS comes from SaaS Capital's survey of 1,000+ companies:
| Metric | Median | 90th Percentile |
|---|---|---|
| Revenue growth | 20% | 51% |
| Net revenue retention | 104% | 118% |
| Gross revenue retention | 92% | 98% |
These numbers are down from prior years - the median growth rate was 30% the year before. The market has cooled, and "good" growth now means something different than it did in 2021. If you're hitting 20% growth while bootstrapped, you're right at the median. Below that, you've got a churn or acquisition problem worth diagnosing (start with a proper churn analysis).
For venture-backed companies, the classic T2D3 framework (Triple, Triple, Double, Double, Double) remains the aspirational benchmark. Very few companies actually sustain it, but it's the mental model investors use when evaluating whether your growth trajectory justifies a premium multiple.
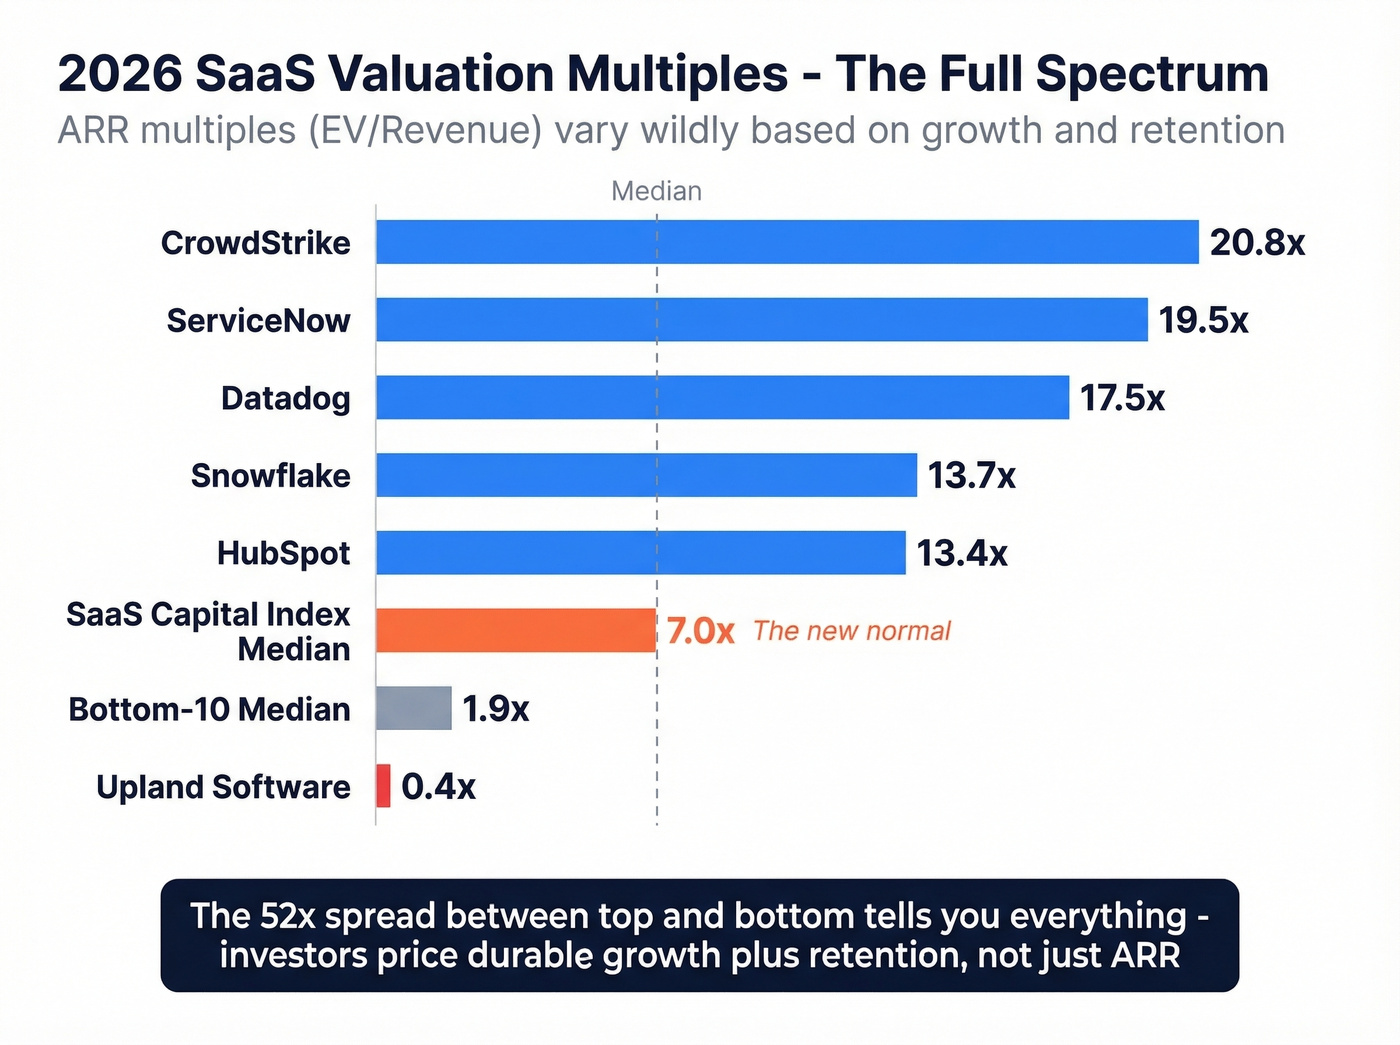
Valuation Multiples
The 2021 valuation party is over. A 7x ARR multiple is the new normal - and that's actually healthy.
The SaaS Capital Index median sits at 7.0x run-rate annualized revenue. The Aventis Advisors median landed at 5.1x EV/Revenue. Both are down about 60%+ from the 2021 peak, when multiples jumped to ~20x and outliers like Asana traded at 89x revenue.
The dispersion tells the real story:
| Company | ARR Multiple |
|---|---|
| CrowdStrike | 20.8x |
| ServiceNow | 19.5x |
| Datadog | 17.5x |
| Snowflake | 13.7x |
| HubSpot | 13.4x |
| SaaS Capital Index Median | 7.0x |
| Bottom-10 median | 1.9x |
| Upland Software | 0.4x |
The spread between CrowdStrike at 20.8x and Upland at 0.4x tells you everything about what investors are pricing: durable growth plus retention. On the private side, Hebbia raised $130 million at an estimated $700+ million valuation on roughly $13 million in ARR - a reminder that AI-native companies still command outlier multiples when the growth story is compelling enough.
Edge Cases That Break the Formula
This is where most guides fall short. The simple formula works until it doesn't.
Usage-Based Pricing
Usage fees can be included in ARR when they're predictable at the portfolio level, even if individual customers fluctuate. The most common annualization method: take GAAP-recognized usage revenue from the most recent quarter and multiply by 4. For seasonal businesses, use trailing 12 months instead.
The key is segmentation. Group customers by usage behavior and include only stable segments. A customer whose monthly usage swings between $500 and $50,000 doesn't belong in your ARR calculation. A cohort of 200 mid-market customers whose aggregate usage varies by less than 10% quarter-over-quarter probably does.
For a more advanced approach, Maxio suggests dividing current MRR by the historical percentage of revenue typically recognized in that month, then averaging across the past three months. More work, but it produces a smoother, more defensible number for businesses with identifiable monthly patterns.
AI and Credits-Based Pricing
AI companies selling credits or tokens face a unique ARR challenge. The Burkland framework breaks revenue into three layers:
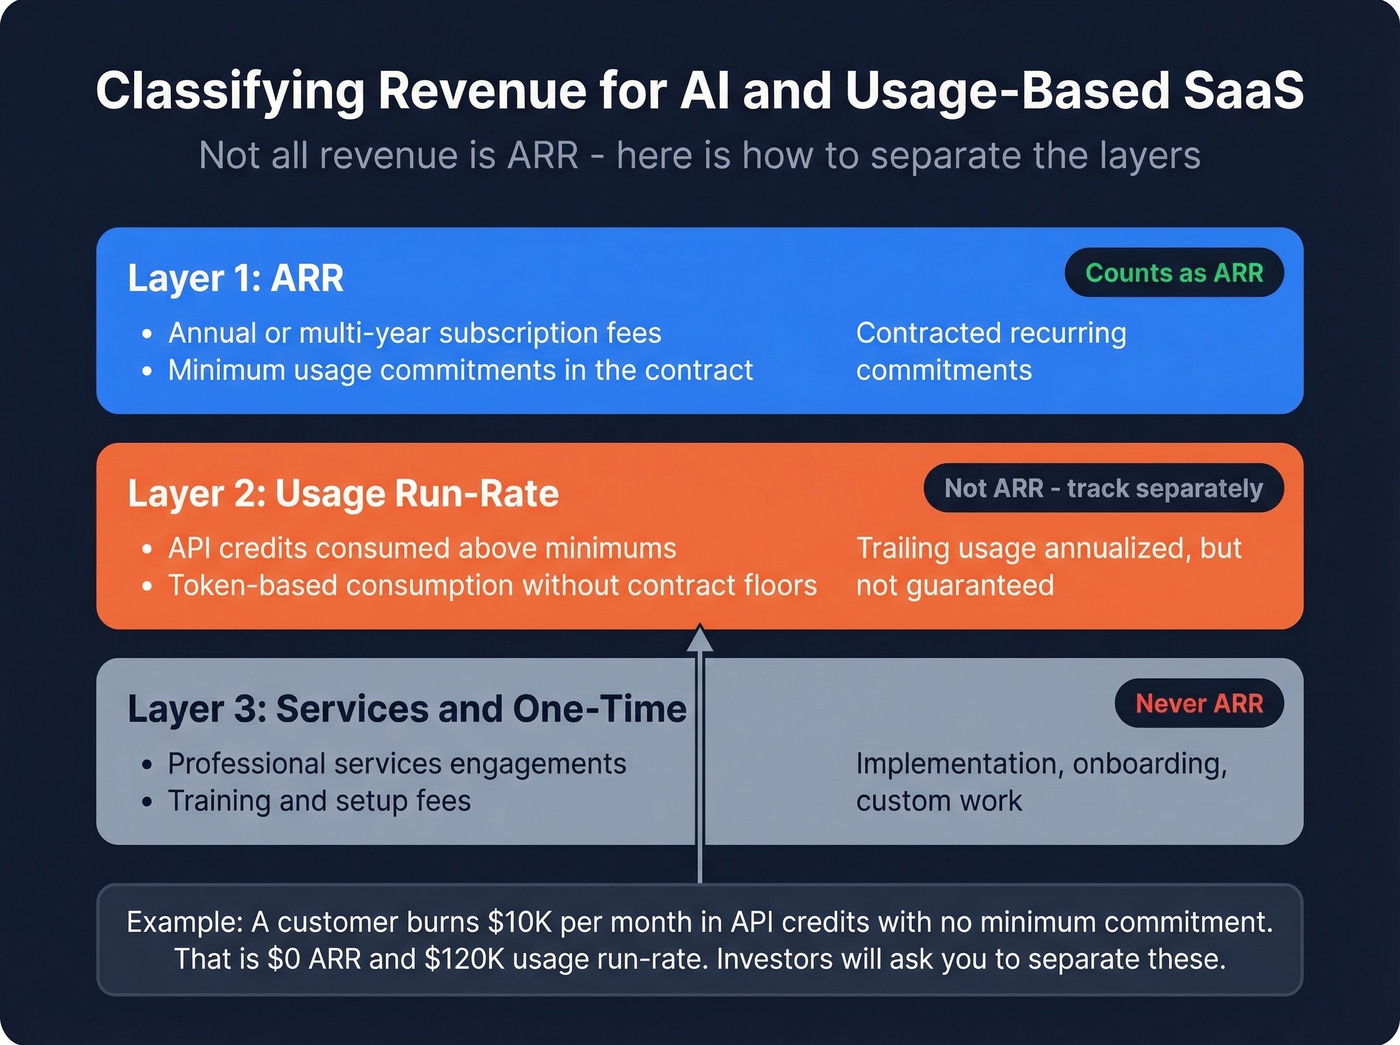
- ARR - contracted recurring commitments that meet your policy
- Usage run-rate - trailing usage annualized, but not contractually guaranteed
- Services/one-time - implementation, onboarding, custom work
If you can't tie a piece of revenue to a renewable contractual commitment, it's not ARR. A customer burning through $10K/month in API credits with no minimum commitment contributes $0 to ARR and $120K to your usage run-rate. Investors will ask you to separate these. Better to do it proactively.
CARR (Committed ARR)
CARR includes signed contracts that haven't started or been implemented yet:
CARR = ARR + New Bookings + Upsells - Downgrades
We see this scenario constantly in enterprise SaaS. The CFO reports $5M ARR at quarter-end. The VP of Sales reports $5.8M CARR because three large contracts were signed in the final week but won't go live for two months. Neither is wrong - they're measuring different things. The CFO is reporting what's active today. The VP of Sales is reporting what's committed. Track both, but label them clearly.
Timing Triggers
When does a contract start contributing to ARR? At signature? At contract start date? At go-live?
Consider a $120K annual contract with a three-month implementation. If you use the go-live method, you show $0 ARR for three months, then a $40K catch-up spike in month four, then $10K/month thereafter. That spike creates reporting noise that confuses boards and investors.
The cleaner approach: start counting ARR at contract start date. It produces smoother reporting, aligns with how most billing systems work, and avoids the implementation-delay volatility that makes quarter-over-quarter comparisons unreliable.
Five ARR Mistakes Investors Screen For
Vague definitions. If your ARR policy wouldn't survive a 30-minute conversation with a diligence team, it's not a policy. Write it down. Define what's in, what's out, and how you handle edge cases.
Including one-time revenue. Implementation fees, training packages, and professional services don't belong in ARR. Ever. Even if they recur informally, they're not contractually recurring.
Annualizing a single month's P&L. Taking last month's total revenue and multiplying by 12 isn't ARR - it's a guess that includes non-recurring items and ignores seasonality.
No written policy with board sign-off. Your methodology should be documented, reviewed by your board or investors, and disclosed in footnotes. Definition changes or restatements without clear explanation are a red flag.
Changing the definition without disclosure. If you shift from counting ARR at go-live to counting at contract start, that's a methodology change that inflates your number. Disclose it transparently or lose credibility when someone notices the jump.
How to Grow ARR
Growing ARR comes down to four levers. The order matters - fixing churn before pouring money into acquisition is almost always the higher-ROI move.
Reduce churn first. The median gross revenue retention for bootstrapped SaaS is 92%. If you're below that, you're losing customers faster than your peers, and no amount of new business will compensate. Fix onboarding, fix product gaps, fix support response times - whatever's driving cancellations.
Expand existing accounts. Net revenue retention of 104% at the median means the typical SaaS company grows existing accounts by 4% annually after accounting for contraction. The 90th percentile hits 118%. Upsells, cross-sells, and usage-based expansion are the cheapest ARR dollars you'll ever earn (see Upsell vs Cross-Sell in SaaS).
Acquire new customers. Your growth rate is only as good as your pipeline, and your pipeline is only as good as your data. A thousand leads with 35%+ bounce rates and wrong titles won't move the needle. If your outbound team is working off stale contact data, you're burning cycles on emails that never arrive and phone numbers that don't connect (use sales prospecting techniques and a clean lead generation workflow). Our team has seen this play out repeatedly - Stack Optimize built from $0 to $1M ARR running client campaigns with under 3% bounce rates using Prospeo's verified data, and that kind of deliverability is what turns outbound into a reliable acquisition channel rather than a domain-reputation liability (start with an email deliverability guide and track your email bounce rate).
Optimize pricing. Push customers toward annual contracts over monthly billing. Add usage minimums to consumption-based plans. Both moves increase predictability and reduce churn risk simultaneously.
Let's be honest: if your average deal size is under $10K, you probably don't need a complex ARR policy - MRR x 12 is fine. But you absolutely need your outbound data to be clean, because at low contract values, every wasted sales cycle eats your margin.
Meritt tripled their pipeline from $100K to $300K/week using Prospeo - that's the kind of ARR growth that survives investor diligence. With 30+ filters including buyer intent and headcount growth signals, you target accounts ready to buy, not just accounts that exist.
Add $0.01 emails to your pipeline. Add millions to your ARR.
FAQ
Is ARR a GAAP metric?
No. ARR is an operational metric, not governed by ASC 606 or IFRS 15. GAAP revenue is recognized as performance obligations are delivered; ARR is a forward-looking annualized run-rate. They serve different purposes and should be tracked with separate methodologies.
How do you calculate ARR for usage-based pricing?
Take GAAP-recognized usage revenue from the most recent quarter and multiply by 4. For seasonal businesses, use trailing 12 months instead. Segment customers by usage behavior and include only cohorts with stable, predictable consumption - individual accounts that swing wildly should be excluded.
What's a good ARR growth rate in 2026?
For bootstrapped SaaS at $3M-$20M ARR, the median growth rate is 20% and the 90th percentile is 51%. Venture-backed companies targeting T2D3 trajectories aim higher, but fewer than 10% sustain that pace beyond two consecutive years.
What's the difference between ARR and CARR?
ARR measures active recurring revenue today. CARR adds signed contracts that haven't started or been implemented yet. Enterprise SaaS companies with long implementation cycles track both to give investors a complete picture of committed momentum.
How do I build pipeline faster to grow ARR?
Focus on data quality before volume. Bounce rates above 5% signal a data problem that's silently killing your outbound. Clean, verified contact data - refreshed weekly, not monthly - is the foundation everything else sits on.