Average Cost Per Lead in 2026: Industry & Channel Benchmarks
$198. That's the average cost per lead across industries and channels globally. But here's what that number won't tell you: most of those "leads" never become pipeline. When you adjust for quality, your real cost per opportunity is often 5-20x higher than whatever your dashboard says.
Let's break down what CPL actually looks like in 2026, by industry and channel, and build a framework that connects spend to revenue instead of vanity metrics.
What Is Cost Per Lead?
Cost per lead measures how much you spend to generate a single lead. The formula is simple:
CPL = Total Marketing Spend / Number of Leads
If you spend $10,000 on a Google Ads campaign and generate 50 leads, your CPL is $200. Include everything that went into that campaign - ad spend, tool subscriptions, content production, and the labor hours behind it. Leaving out labor is the most common mistake we see, and it can understate your true CPL by 30-50%.
Don't confuse CPL with CAC. CPL measures the cost to get someone into your funnel. CAC measures the cost to close them. A $200 CPL can translate to a $2,000 CAC or a $20,000 CAC depending on your conversion rates. That distinction matters more than most teams realize.
Quick Snapshot: 2026 Benchmarks
If you're short on time, here's the summary:
- Global average CPL: ~$198 across all industries and channels
- Cheapest channels (B2B): Referrals ($25), affiliate marketing ($73), Facebook ads ($142). On the extreme low end, one niche local service business reported $16 CPL on Facebook for pond-digging leads in Michigan - proof that hyper-targeted local campaigns can push costs far below any benchmark.
- Most expensive channels (B2B): Trade shows ($840), PPC ($463), LinkedIn ads ($408)
- The number that actually matters: Your cost per qualified lead (CPQL) - often 5-20x your raw CPL
- Your max CPL formula: Max CPL = (LTV / 3) x MQL-to-won conversion rate
CPL by Industry
Industry is the single biggest variable in how much leads cost. First Page Sage's 2026 report - built from data collected January 2022 through June 2025 - remains the canonical source. The spread is enormous.

| Industry | Paid CPL | Organic CPL | Blended |
|---|---|---|---|
| eCommerce | $98 | $83 | $91 |
| Retail | $105 | $88 | $96 |
| Telecom | $175 | $115 | $145 |
| HVAC | $185 | $125 | $155 |
| Transportation | $210 | $145 | $178 |
| Staffing & Recruiting | $225 | $150 | $188 |
| B2B SaaS | $310 | $164 | $237 |
| Manufacturing | $295 | $175 | $235 |
| IT & Services | $325 | $185 | $255 |
| Real Estate | $340 | $215 | $280 |
| Cybersecurity | $400 | $230 | $315 |
| Insurance | $380 | $260 | $320 |
| Healthcare | $410 | $280 | $345 |
| Biotech | $450 | $310 | $380 |
| Oil & Gas | $480 | $320 | $400 |
| Addiction Treatment | $500 | $340 | $420 |
| Construction | $520 | $350 | $435 |
| Legal Services | $784 | $516 | $649 |
| Financial Services | $761 | $555 | $653 |
| Higher Education | $1,261 | $705 | $982 |
A few things jump out. Organic CPL is lower than paid across every industry in this dataset. That gap is real, but it's also misleading - organic takes months to build and doesn't scale on demand the way paid does. The right read isn't "organic is better" but "you need both, and the mix determines your blended number."
The industries with the highest lead costs - legal, financial services, higher education - share a common trait: high customer lifetime value. A $650 CPL for financial services sounds brutal until you realize a single closed client might be worth $50,000+.
CPL by Channel
Channel-Level Breakdown
Sopro's B2B benchmarks break down CPL across 12 channels. The range from referrals to trade shows is staggering.
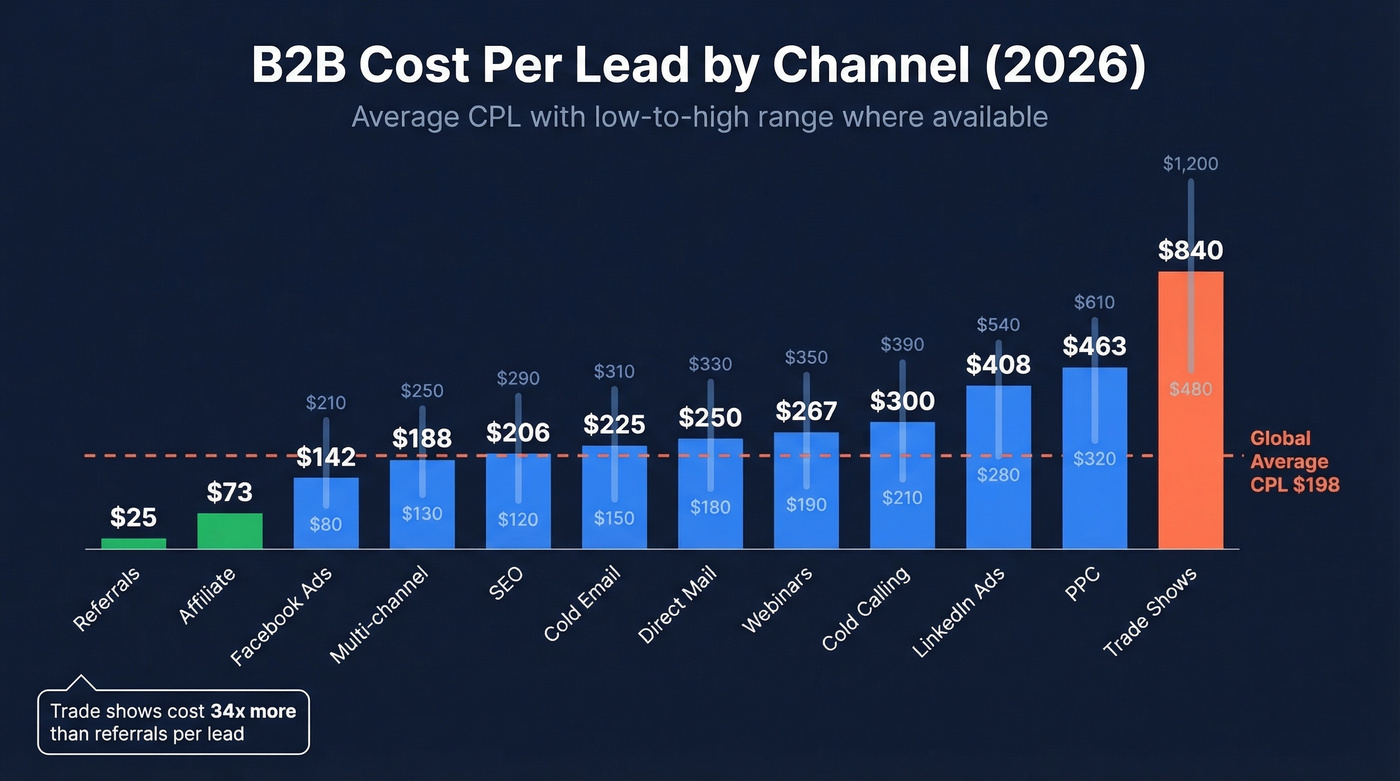
| Channel | Low | Average | High |
|---|---|---|---|
| Referrals | - | $25 | - |
| Affiliate | $54 | $73 | $92 |
| Facebook Ads | $102 | $142 | $182 |
| Multi-channel | $80 | $188 | $296 |
| SEO | $14 | $206 | $397 |
| Cold Email | $150 | $225 | $300 |
| Direct Mail | - | $250 | - |
| Webinars | $33 | $267 | $500 |
| Cold Calling | - | $300 | - |
| LinkedIn Ads | $15 | $408 | $800+ |
| PPC | $175 | $463 | $751 |
| Trade Shows | $180 | $840 | $1,500+ |
Look, trade shows at $840 average CPL are a legacy budget line surviving on inertia. Unless your close rate from event leads is dramatically higher than other channels, that money almost certainly works harder elsewhere.
One nuance: overall B2B channel CPL has held roughly flat since 2023 (down just 0.23% in Sopro's year-over-year view). But WordStream's latest Google Ads benchmarks show CPL increased in 13 of 23 industries, with an average ~5% year-over-year increase. The "flat average" hides a lot of channel-specific inflation.
Company size shifts the math too:
| Company Size | Avg CPL |
|---|---|
| <50 employees | $146 |
| Enterprise (>$500M rev) | $429 |
LinkedIn CPL by Region
LinkedIn deserves its own breakdown because the regional variance is massive. These numbers come from The B2B House's analysis of $1M+ in LinkedIn spend over six months.
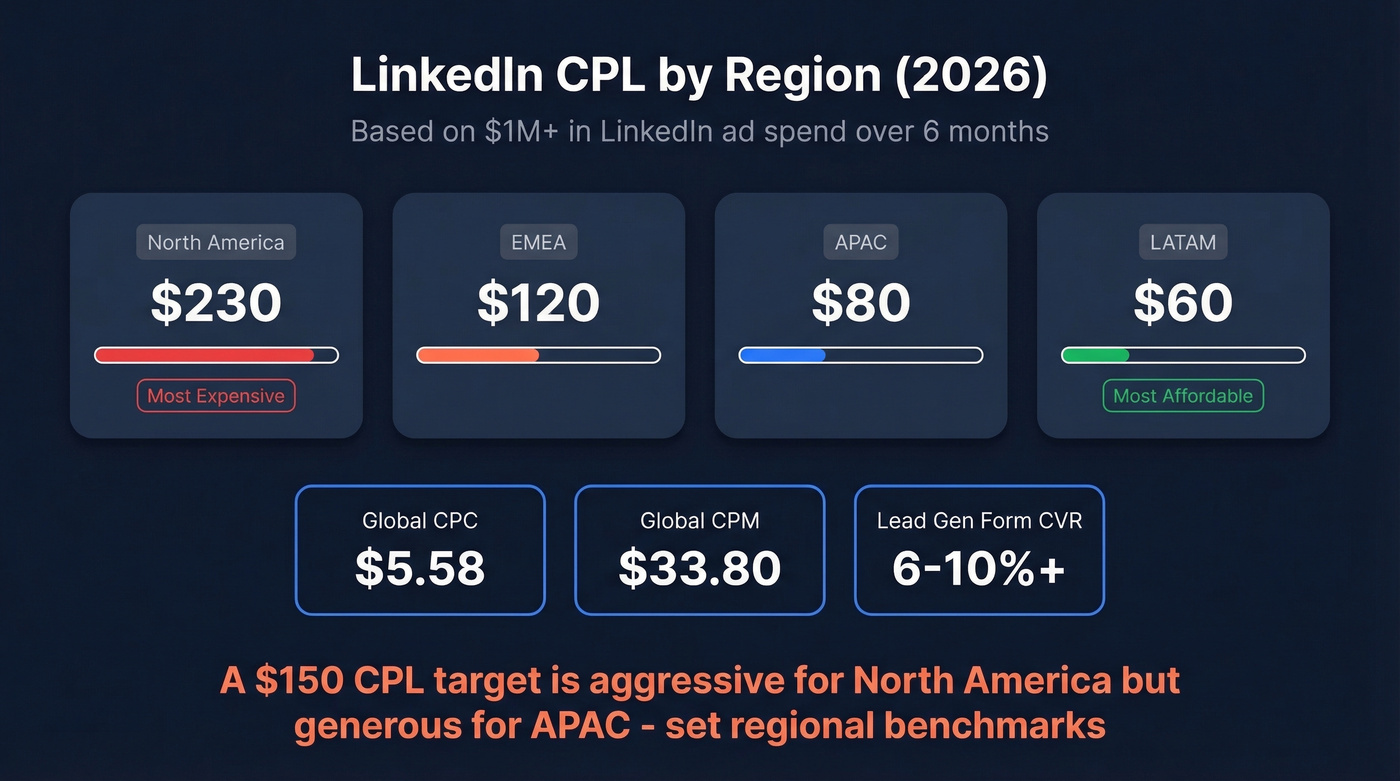
| Region | Avg CPL |
|---|---|
| NAMER | $230 |
| EMEA | $120 |
| APAC | $80 |
| LATAM | $60 |
If you're running LinkedIn campaigns globally with a single CPL target, you're doing it wrong. A $150 target is aggressive for North America but generous for APAC. Set regional benchmarks or you'll over-invest in cheap geos and starve the ones that matter most to your pipeline.
LinkedIn's global CPC benchmark sits at $5.58 with a CPM of $33.80. Lead Gen Forms convert at 6-10%+, which typically translates to $75-$150 CPL - often the most efficient LinkedIn format for B2B lead capture.
Cold email CPL sits at $225 average - but bad data inflates that number with bounces that burn budget and domain reputation. Prospeo's 98% email accuracy and 7-day data refresh cut your wasted spend to near zero. At $0.01 per verified email, your effective CPL drops to a fraction of any benchmark on this page.
Stop paying $225 per lead when verified contacts cost a penny each.
Why CPL Is Misleading
CPL is a vanity metric. It tells you how much you paid to collect a form fill, not how much you paid to generate a real opportunity. The metric that actually matters is CPQL - cost per qualified lead.
CPQL = Total Marketing Spend / Number of Qualified Leads
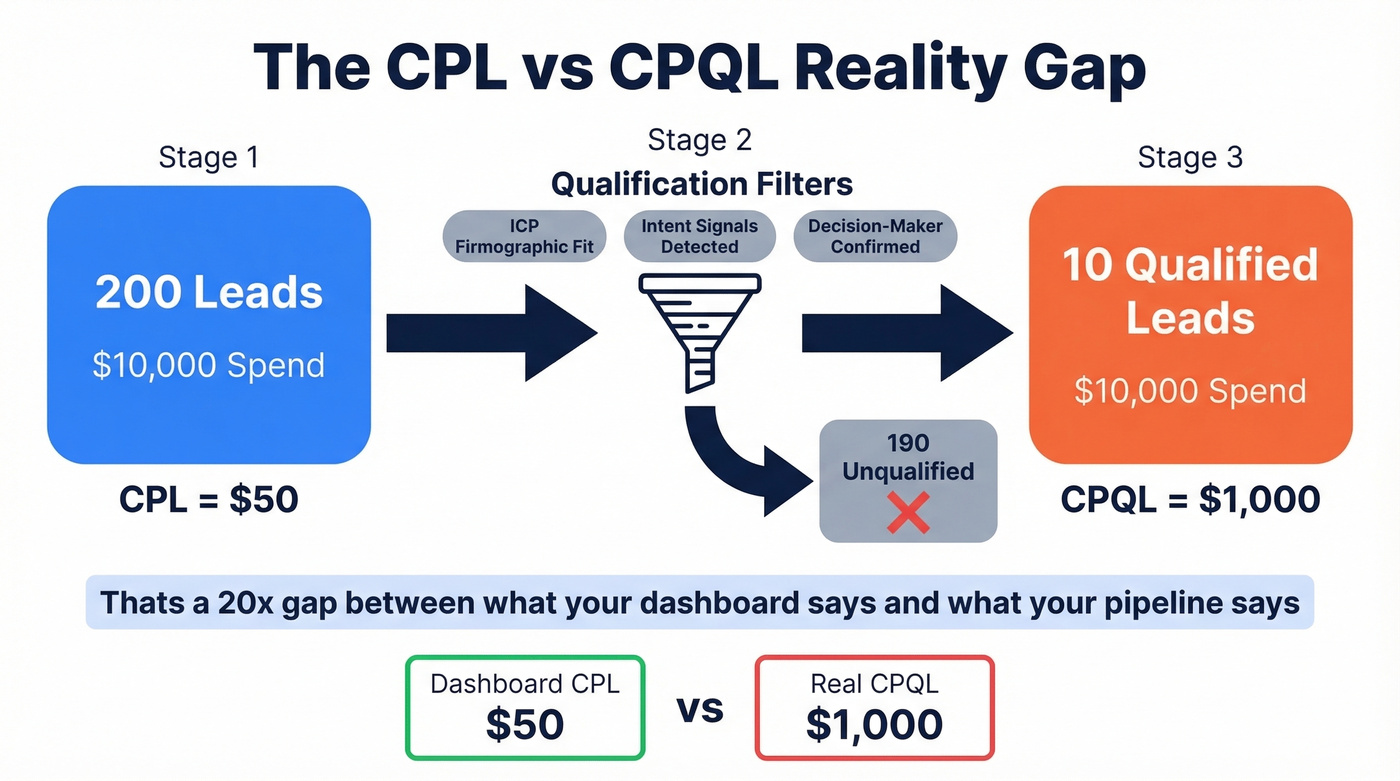
WhatConverts' example is the best illustration. You spend $10,000 on a campaign. You generate 200 leads. Your CPL is $50. Feels great.
Now qualify those 200 leads against real criteria - firmographic fit, intent signals, pricing page visits, demo requests, budget authority. You end up with 10 actual prospects. Your CPQL is $1,000. That's a 20x gap between what your dashboard says and what your pipeline says.
42% of B2B companies cite lead quality as their top marketing challenge. The reason is structural: your ad platform reports CPL, your CRM holds qualification data, and the two systems rarely talk to each other. Teams optimize for the metric they can see instead of the metric that matters.
Qualification criteria don't need to be complex. Start with three filters: does the company match your ICP firmographically? Has the contact shown intent? Is the contact a decision-maker or influencer? Even these three filters will usually shrink your "lead" count fast - and give you a CPQL that actually predicts revenue.
Here's the thing: if your deal size is under $10k, CPL usually matters less than conversion rate and speed-to-close. A $400 CPL that closes in 14 days beats a $100 CPL that takes 90 days to qualify out every single time.
How to Calculate Your Max CPL
Before you benchmark against industry averages, figure out what you can afford to pay per lead. The math works backward from customer lifetime value, and it's more useful than any external benchmark because it's calibrated to your economics.
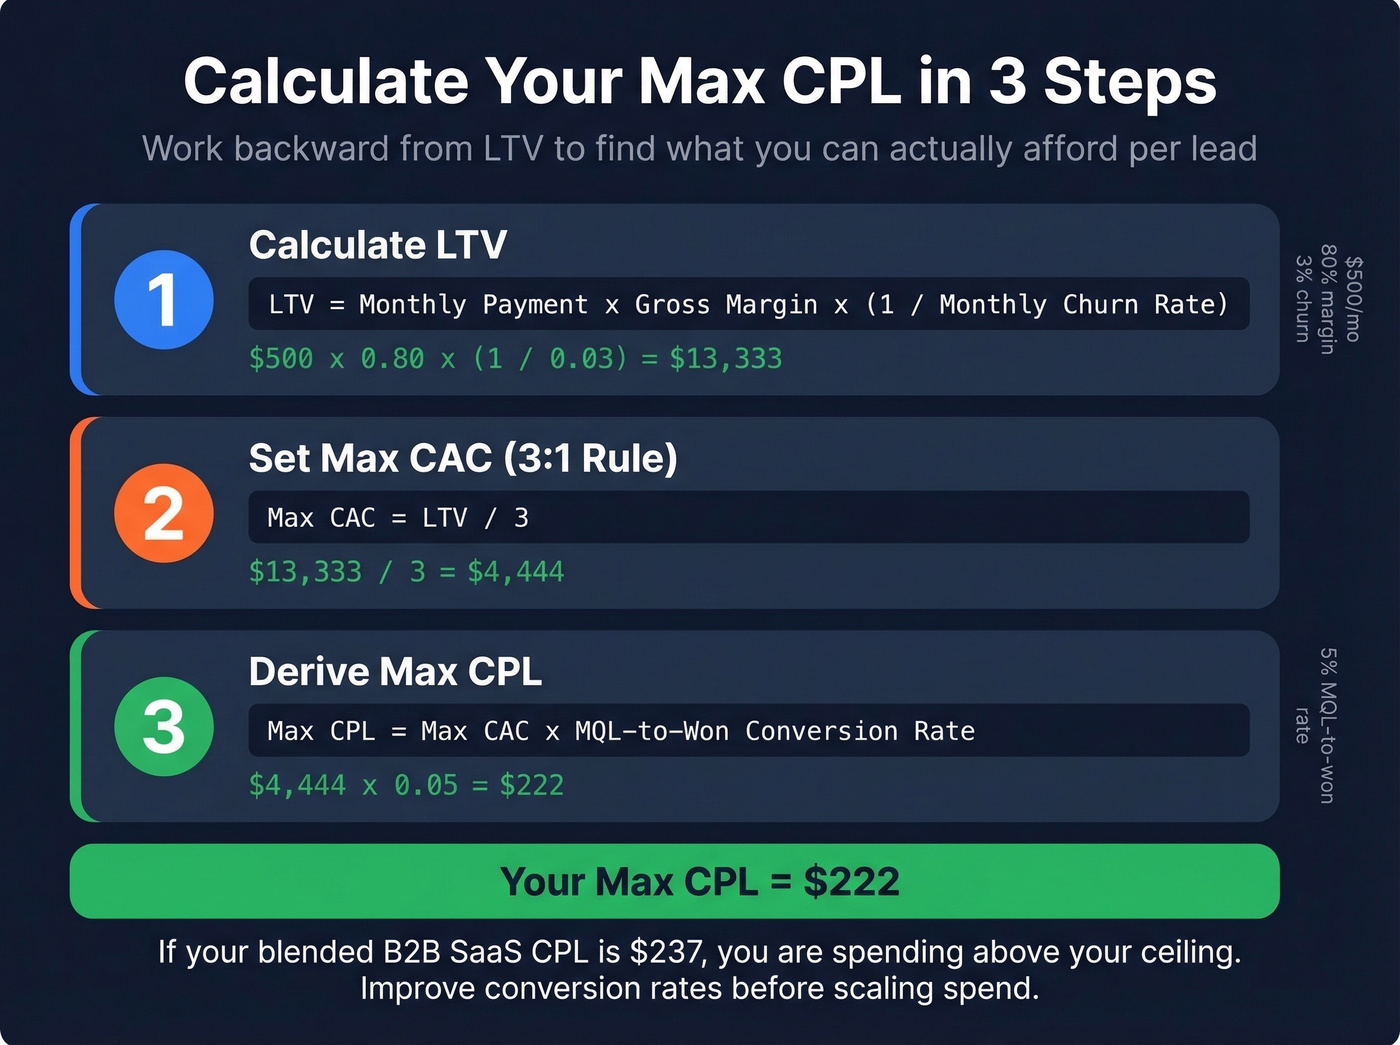
Step 1: Calculate LTV. LTV = Monthly Payment x Gross Margin x (1 / Monthly Churn Rate)
Step 2: Set your max CAC. The standard rule is a 3:1 LTV-to-CAC ratio. Max CAC = LTV / 3.
Step 3: Derive your max CPL. Max CPL = Max CAC x MQL-to-Won Conversion Rate
Let's run a SaaS example. Your product charges $500/month with 80% gross margin and 3% monthly churn. LTV = $500 x 0.80 x (1 / 0.03) = $13,333. Max CAC = $13,333 / 3 = $4,444. If your MQL-to-won conversion rate is 5%, your max CPL = $4,444 x 0.05 = $222.
That $222 ceiling tells you whether a $237 blended B2B SaaS CPL is sustainable for your business - it's tight - or whether you need to improve conversion rates before scaling spend.
Why Costs Keep Rising
Paid CPL has been climbing for years, and 2026 hasn't reversed the trend.
WordStream's analysis of 16,000+ campaigns found CPL increased in 13 of 23 industries, with a ~5% average year-over-year increase. That's actually moderate compared to the historical picture: a previous WordStream study showed CPL rising in 91% of industries with an average 19% increase during the 2022 inflation spike.
US inflation has cooled - from 8.0% in 2022 down to 2.4% year-over-year as of February 2026. But CPL hasn't come back down. Ad platform auction dynamics don't deflate the way consumer prices do. Once advertisers accept a higher CPC floor, it becomes the new baseline.
The pattern shows up in practitioner data too. One marketer running a coaching webinar funnel on Meta reported CPL jumping from EUR6-8 throughout 2025 to EUR26+ in January 2026 - with CTR holding steady at 1.2-1.5% and frequency under 2. The funnel didn't break. The auction got more expensive. We've seen this pattern repeatedly across accounts: stable engagement metrics, rising costs. The platform takes a bigger cut every year.
Google's push toward broader match types compounds the problem. Broad match feeds lower-intent traffic into your funnel, inflating lead volume while diluting quality. Your CPL might look flat, but your CPQL is climbing.
How to Reduce Your Cost Per Lead
Optimize Channels and Conversion Rates
The fastest CPL wins come from conversion rate optimization, not budget cuts.
Multi-step forms can double conversion rates compared to static single-page forms. Break your lead capture into 2-3 steps and watch completion rates climb. Adding phone validation at the form level reduces junk leads by up to 50%, which directly improves your CPQL even if raw CPL stays flat.
Systematic A/B testing on landing pages and ad creative yields 20-30% efficiency gains over a quarter. Most teams test sporadically. Make it a weekly cadence - even small wins compound fast. Meta CPL optimization through creative rotation, audience refinement, and conversion API setup can cut costs 20-40% without touching your budget.
Heyflow reports 98% of users engage on mobile devices. If your landing page loads slowly or renders poorly on a phone, you're burning budget on clicks that never convert.
Fix Your Contact Data
This is the CPL lever most teams overlook entirely: data quality. If 30% of your outbound list bounces, you need ~43% more sends to reach the same number of delivered prospects - which quietly drives up your effective CPL. We've watched teams cut their outbound CPL by 30%+ just by switching to verified contact data before launching sequences.
For outbound teams, tools like Prospeo with 98% email accuracy and a 7-day data refresh cycle mean your outreach actually reaches real inboxes. That's the difference between a $200 effective CPL and a $140 one. Verifying your contact data before hitting send is the single fastest way to reduce lead generation costs without changing anything else about your campaign.
If you're building lists at scale, data enrichment and lead enrichment can also reduce wasted spend by keeping records current before you launch sequences.
Outbound CPL - What It Really Costs
Outbound CPL is harder to calculate because most of the cost is labor. A fully-loaded SDR in the US runs $50,000-$80,000/year. At 30-50 leads per month, that's $83-$222 per lead before you add data costs. Layer in a $500-$2,000/month data subscription and outbound CPL lands at $100-$280 per lead.
That's competitive with paid channels - but only if your data is accurate enough to avoid wasted dials and bounced emails. Self-serve data platforms with verified emails at roughly $0.01 each have made outbound far more accessible than the legacy $15,000-$40,000/year data contracts that used to be the only option. Skip outbound entirely if your average deal size is under $3,000; the math rarely works at that price point.
To make outbound predictable, standardize your sales prospecting techniques and tighten sequence management so reps aren't reinventing the wheel every week.
The gap between CPL and CPQL shrinks when your data actually connects you to real buyers. Prospeo's 30+ filters - buyer intent, technographics, headcount growth, funding - mean every lead matches your ICP before you spend a dollar reaching them. Teams using Prospeo book 35% more meetings than Apollo users.
Build pipeline from qualified leads, not expensive form fills.
FAQ
What is a good cost per lead?
It depends on your industry: B2B SaaS averages $237 blended, eCommerce $91, and financial services $653. The real test is whether your CPL falls below your max acceptable threshold based on LTV and close rate. Use the benchmark tables above, then calibrate to your own unit economics.
How do you calculate cost per lead?
Divide total marketing spend by the number of leads generated: CPL = Spend / Leads. Include all costs - ad spend, tools, labor, and content production. Leaving out labor is the most common mistake and can understate your true CPL by 30-50%.
Why does my CPL keep going up?
Platform auction costs rise annually - Google Ads CPL increased in 13 of 23 industries in the most recent study. Broader match types and ad inflation haven't reversed even as macro inflation cooled to 2.4%. Once advertisers accept a higher CPC floor, it becomes the new baseline.
How can I lower CPL without cutting budget?
Fix data quality first - if 30% of your list bounces, you need ~43% more sends to hit the same delivered volume. Then optimize landing pages, test multi-step forms, and run systematic A/B tests on creative weekly. These changes compound: our experience is that teams doing all three see 25-40% CPL reductions within a quarter.
What's the cheapest lead generation channel?
Referrals at $25 average CPL and affiliate marketing at $73 consistently rank cheapest in B2B benchmarks. Organic SEO is cost-effective long-term ($14 low-end) but requires months of upfront investment before producing results at scale.