Average Email Click-Through Rate by Industry: 2026 Benchmarks
Stop obsessing over open rates. Apple MPP now accounts for nearly half of all email opens, inflating that metric by 15-20 points. Click rate is one of the few email engagement metrics you can still benchmark with a straight face in 2026 - and understanding the average email click-through rate by industry starts with knowing which numbers to trust.
The problem? Every benchmark source gives you a different number. A quick scan turns up 1.69%, 2.62%, and 6.21% - all presented as "the average," just measured in different ways.
Here's the quick version: campaign CTR across industries lands between 1.5-3% depending on who's measuring and how. The most reliable 2026-intent dataset is MailerLite's - 3.6M campaigns, 181K accounts, median click rate of 2.09%. Above ~2.5%, you're well above the cross-industry median. Above 3.38%, you're in top-10% campaign performance per Klaviyo's dataset.
Email CTR by Industry: 2026 Data
Your CMO asks you to benchmark CTR. You find three sources with three different numbers. Each ESP measures a different user base, uses different math, and covers a different time window. The most useful thing isn't picking one - it's seeing them side by side.
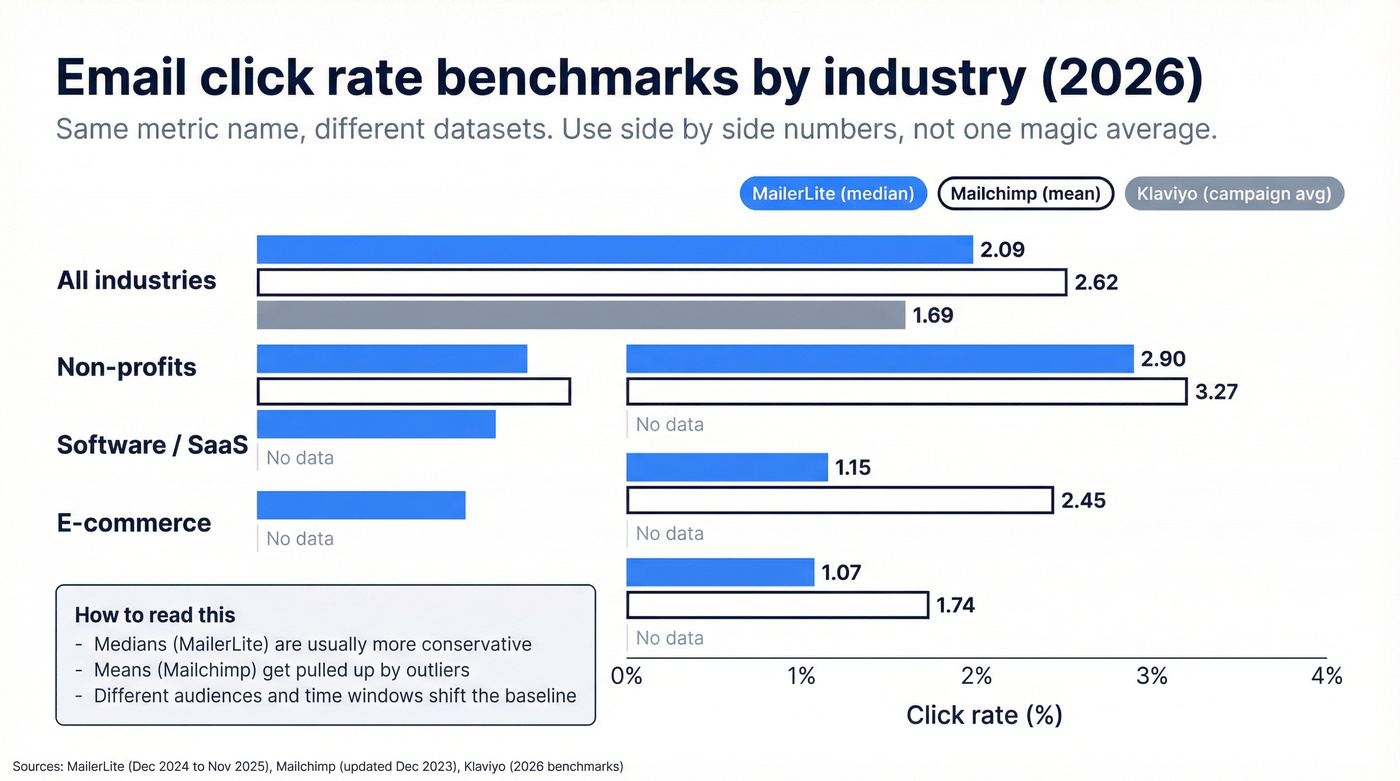
| Industry | MailerLite (median) | Mailchimp (mean) | Klaviyo (campaign avg) |
|---|---|---|---|
| E-commerce | 1.07% | 1.74% | - |
| Non-profits | 2.90% | 3.27% | - |
| Software / SaaS | 1.15% | 2.45% | - |
| Health & fitness | 1.45% | - | 1.24% |
| Consulting | 2.41% | - | - |
| Toys & hobbies | - | - | 2.03% |
| Electronics | - | - | 1.85% |
| All industries | 2.09% | 2.62% | 1.69% |
Sources: MailerLite (Dec 2024-Nov 2025, median), Mailchimp (last updated Dec 2023), Klaviyo (183K+ brands, 2026 benchmarks).
The DMA UK's multi-ESP report - a third-party, cross-platform source - puts 2024 unique click rate at 2.3%. That's the number we'd put in the slide deck.
MailerLite reports medians rather than means, which resist the pull of outlier campaigns and give a more conservative, realistic benchmark. Mailchimp's numbers run higher partly because means get pulled up by high-performing outliers, and partly because their data is older. Klaviyo's all-industries campaign average sits at 1.69%. Also worth noting: MailerLite's benchmark report breaks results across 7 regions, so don't be surprised if your geography shifts the baseline.
Why Every Source Reports Different Numbers
"CTR" doesn't mean one thing. Different ESPs use different formulas, and they don't always label them clearly.
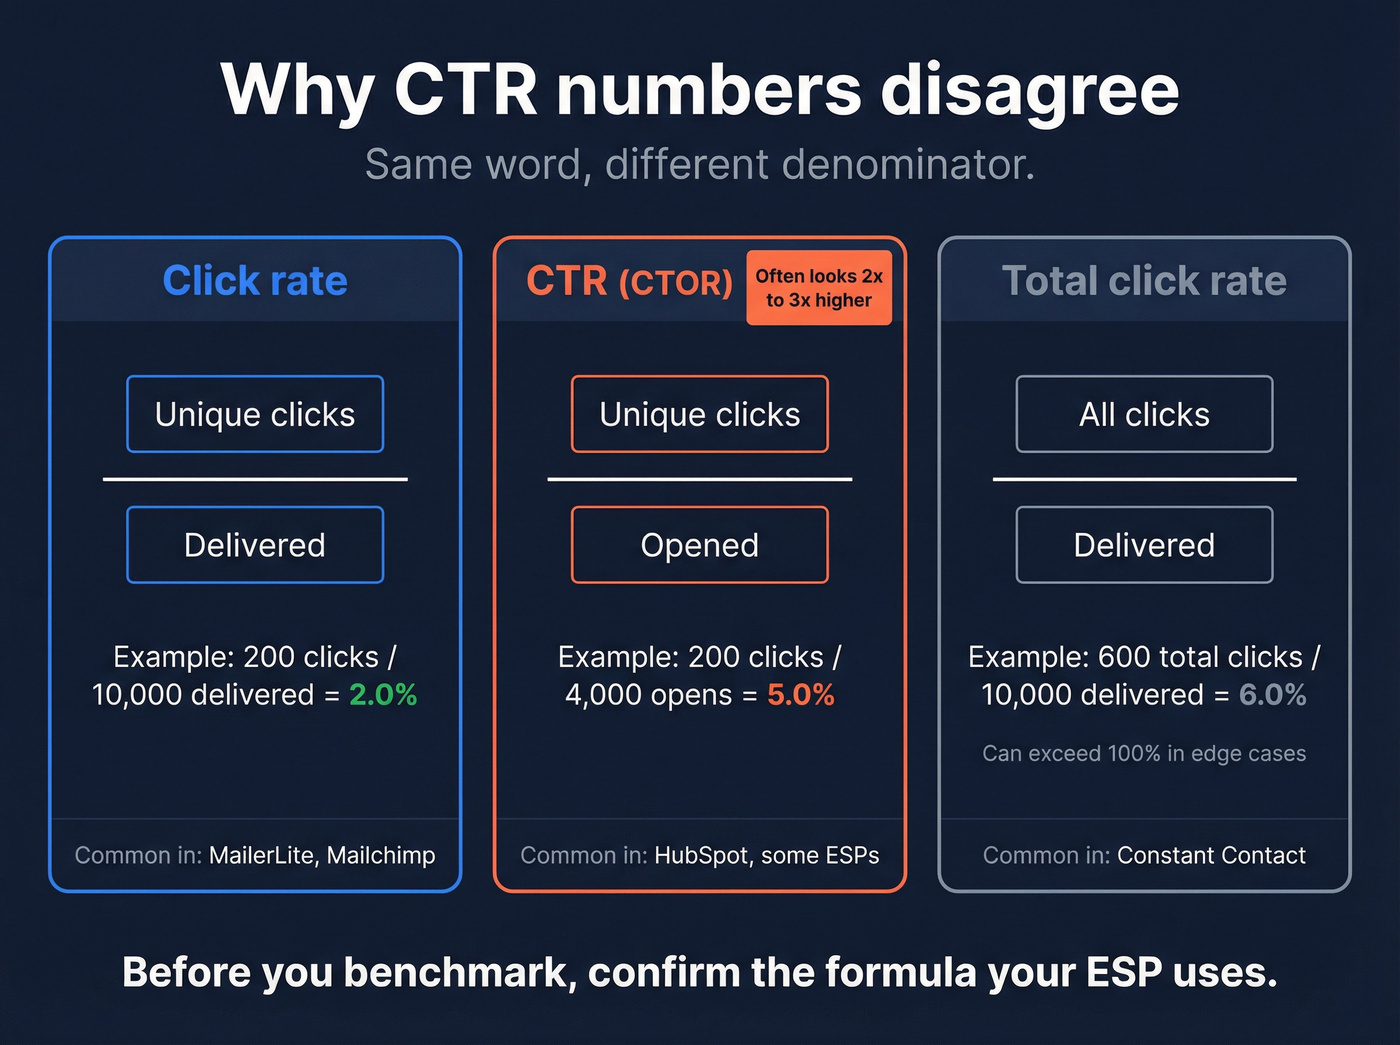
| Metric | Formula | Who uses it |
|---|---|---|
| Click rate | Clicks / delivered | MailerLite, Mailchimp |
| CTR (CTOR) | Clicks / opened | HubSpot, some ESPs |
| Total click rate | All clicks / delivered | Constant Contact |
Per HubSpot's community definitions, "click rate" uses delivered as the denominator while "click-through rate" uses opened. That denominator swap alone can double or triple the number. Constant Contact uses total clicks in some calculations rather than unique, which is why click-based percentages can technically exceed 100% in edge cases.
This explains the ActiveCampaign outlier. Their 2026 benchmarks report an "average click rate" of 6.21% - nearly 3x everyone else. That number isn't wrong. It's just measuring something different, almost certainly using opens as the denominator. Comparing email click-through rates across industry reports requires knowing exactly which formula produced each figure.
You just read that bad data kills sender reputation, which kills inbox placement, which kills CTR. Prospeo's 5-step verification and 7-day data refresh deliver 98% email accuracy - keeping bounce rates under 4% so your campaigns actually reach the inbox where clicks happen.
Stop benchmarking CTR on emails that never reached the inbox.
Campaign vs. Automated Flow CTR
Comparing your welcome-series flow to a newsletter blast is like comparing a warm handshake to a cold call. Klaviyo's data across 183K+ brands makes the gap obvious:
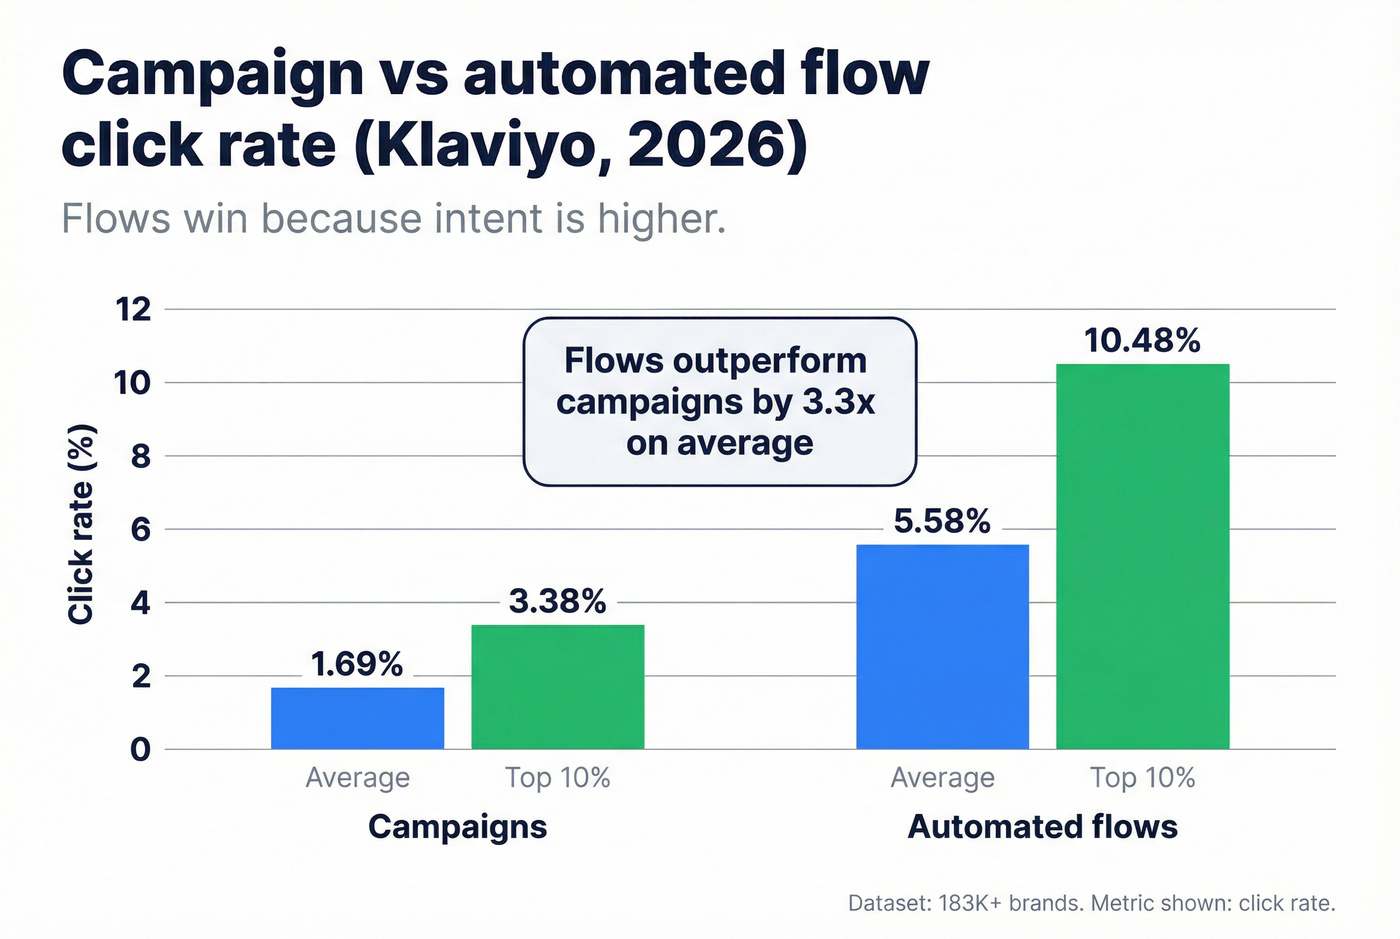
- Campaign click rate: 1.69% average, 3.38% for top 10%
- Automated flow click rate: 5.58% average, 10.48% for top 10%
Flows outperform campaigns by 3.3x on average. In our experience, teams that separate campaign and flow reporting immediately spot where their real engagement problems live - and it's almost always the campaign side. If your blended CTR looks great, check whether flows are carrying the number. They usually are.
Why Your CTR Might Be Lying
Bot clicks are the silent inflation engine. Outlook Safe Links, Gmail's link scanning, and corporate security tools pre-click links before a human ever sees the email. One analysis found AI bot clicks peaked at 3M+ per day in early 2025.
Brevo changed their methodology twice in 2025 - once in February and again in July - to include bot activity in reported metrics. Your "improvement" might just be a calculation change. A thread on r/Emailmarketing notes that toggling Mailchimp's MPP exclusion didn't change the poster's reported metrics, which doesn't inspire confidence in the filtering.
The Dotdigital 2026 Global Benchmark Report captures the broader trend: open rates keep rising while CTOR dips to 3.7%. More "opens" from MPP with the same clicks means your click-to-open rate drops even if nothing changed about your content. If you're seeing clicks within one second of delivery, those are security scanners, not readers.
Let's be honest - most teams would learn more from tracking time-to-click distribution than from benchmarking CTR against industry averages. A 2% CTR where every click happens 30+ seconds after delivery is worth more than a 4% CTR padded with bot clicks at the one-second mark.
How to Improve Your Click Rate
Three tactics that actually move the needle, based on what we've seen work across hundreds of outbound campaigns.
Segment by engagement recency
Stop mailing people who haven't opened in 90 days. They're dragging your deliverability down, which tanks inbox placement, which lowers CTR for everyone else on your list. We've seen teams boost CTR 30-40% just by trimming their inactive segment. It's the single highest-leverage change most senders can make, and it takes about fifteen minutes.
One CTA per email
Every additional link competes for the click. Decision fatigue is real. Pick the one action you want, make the button obvious, and cut the rest. So what's a good click rate in email marketing? If you're consistently hitting 2.5%+ on campaigns after removing bot noise, you're outperforming most senders in your vertical.
If you want more ideas that directly lift clicks, pull from proven email subject lines and tighten your email call to action.
Clean your list before you send
Bad email data causes bounces that damage sender reputation, reduce inbox placement, and tank CTR for your entire list. This is the part that frustrates us most when we talk to teams - they'll spend weeks optimizing subject lines and copy, then send to a list that's 15% invalid addresses. Prospeo's 5-step verification catches invalid addresses, spam traps, and honeypots at 98% accuracy with catch-all handling, stopping the bounce-reputation-CTR death spiral before it starts. Skip this if your bounce rate is already under 2% - you're probably fine.
If you need to sanity-check your numbers, start with email bounce rate benchmarks and the exact click rate formula your ESP is using.

Cleaning your list is the highest-leverage CTR fix in this article. Prospeo verifies 143M+ emails with catch-all handling, spam-trap removal, and honeypot filtering - at $0.01 per email. No bounces dragging down your deliverability. No bot-inflated metrics masking real problems.
Clean data at a penny per email beats guessing at benchmarks.
FAQ
What's the average email click-through rate by industry in 2026?
Campaign click rate typically lands between 1.5-3% across major benchmark datasets. MailerLite's cross-industry median is 2.09%, Mailchimp reports a 2.62% mean, and Klaviyo shows 1.69% for campaigns. Non-profits tend to lead at ~2.9-3.3% while e-commerce trails at ~1.1-1.7%.
What's the difference between CTR and CTOR?
CTR divides clicks by delivered emails. CTOR divides clicks by opened emails, producing a higher number every time. Confirm which formula your ESP uses before benchmarking externally - the denominator swap alone can triple the reported rate.
How do I know if bot clicks are inflating my CTR?
Check your time-to-click distribution. Clicks arriving within one second of delivery are almost always security scanners, not humans. You can also add honeypot links hidden from real readers to measure bot volume directly. If over 20% of clicks land in the first second, your reported CTR is significantly inflated.
Does list quality affect click-through rate?
Yes - bad addresses cause bounces that damage sender reputation, pushing future sends to spam and lowering CTR for your entire list. Keeping bounce rates under 2% through regular list verification is one of the most reliable ways to protect inbox placement and give your content a fair shot at getting clicked.