Average Email Open Rate in 2020: What the Data Actually Shows
The average email open rate in 2020 was 20.4% for marketing emails. That number comes from Privy's benchmark compilation pulling from 30+ billion emails and aggregating Mailchimp, Campaign Monitor, and GetResponse data. If you're seeing an "average" closer to 35.9%, you're looking at DMA-style benchmarking that reflects a completely different mix of email types and measurement methodology.
Here's why this still matters in 2026: 2020 was the last full year before Apple's Mail Privacy Protection launched in September 2021, which changed how open rates get recorded and pushed benchmarks higher even when real human engagement stayed flat.
The component numbers behind that 20.4% figure - Mailchimp reported 21.33%, Campaign Monitor 17.80%, and GetResponse 22.15%. Privy's 2020 compilation remains one of the cleanest single numbers you'll find for marketing sends. The corresponding click-to-open rate averaged 14.9%, which is worth bookmarking because it's far less affected by Apple's privacy changes than raw opens.
2020 Open Rates by Industry
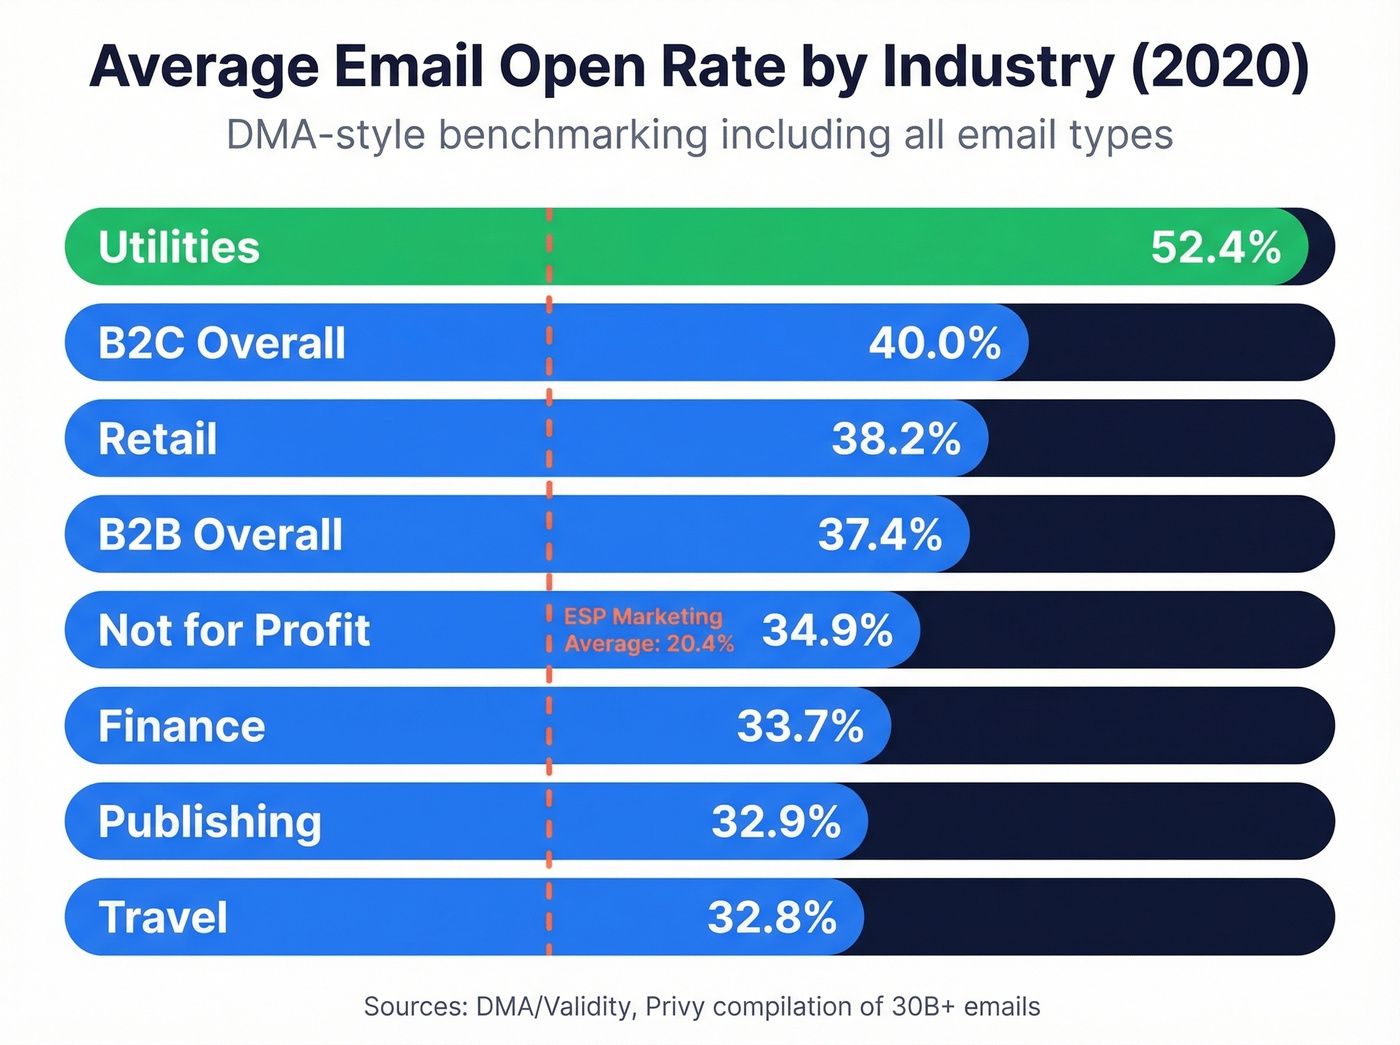
This is where it gets confusing - and why you're probably seeing conflicting numbers. The DMA/Validity table labeled "as of 2020" looks nothing like ESP marketing-only averages.
| Industry | Open Rate (2020) |
|---|---|
| Finance | 33.7% |
| Retail | 38.2% |
| Publishing | 32.9% |
| Travel | 32.8% |
| Not for Profit | 34.9% |
| Utilities | 52.4% |
| B2B Overall | 37.4% |
| B2C Overall | 40.0% |
| Average | 35.9% |
That 35.9% average looks nothing like 20.4%. The gap isn't a mistake - it's a methodology difference we'll unpack below.
For a second reference point, a widely cited compilation often attributed to Constant Contact benchmarks showed an overall average of 21.33%, with Government at 28.77%, Non-Profit at 25.17%, and Retail at 18.39%. Right in line with ESP-reported marketing averages.
Why 2020 Benchmarks Vary So Much
Two "averages" float around for 2020, and most articles don't explain why they're so different.
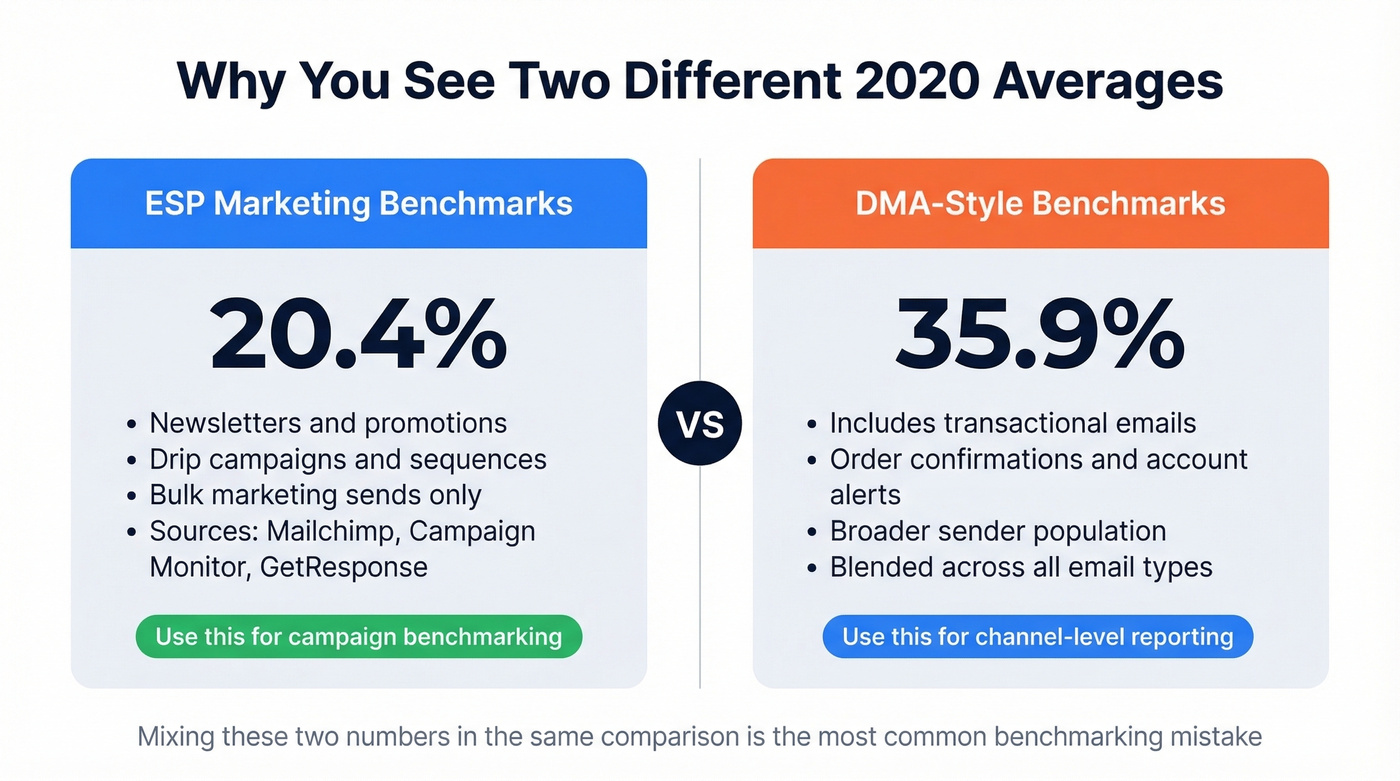
ESPs like Mailchimp and Campaign Monitor land around 18-22% because they're measuring bulk marketing emails - newsletters, promotions, drip campaigns. The DMA-style table shows 35.9% because it reflects a broader benchmarking approach that includes a different population of senders and send types.
When you blend in high-intent messages like order confirmations, account alerts, and other transactional sends, open rates jump dramatically - often into the 60%+ range - which pulls blended averages way up. Open rates for inbound leads also tend to run significantly higher than cold outreach, since those contacts already expect to hear from you.
We've seen this confusion trip up marketing teams building QBR decks. They compare a 2020 ESP number against a DMA-style number and panic about underperformance that doesn't actually exist.
Campaign Monitor provides a useful year-over-year anchor: their benchmarks list the 2021 average open rate at 21.5%, noting it was up 3.5% from 2020. That puts 2020 squarely in the ESP-style range for marketing sends.
Let's be clear: if you're benchmarking your newsletter or outbound campaign, use the 20.4% figure. If you're reporting on email as a channel with a broader mix of send types, the 35.9% number is defensible. Just don't mix them in the same comparison.
That 20.4% benchmark assumed your emails actually reached the inbox. Bad addresses tank deliverability and inflate bounce rates - destroying the sender reputation you need to hit even average open rates. Prospeo's 5-step email verification catches invalids at 98% accuracy for $0.01/email.
Fix your list before you optimize your subject lines.
How COVID-19 Skewed 2020
Omnisend analyzed 2.5 billion promotional emails, and the data is striking. Pre-COVID (January 1 through March 15), open rates were tracking a modest +2.44% year-over-year lift compared to 2019. Then lockdowns hit.
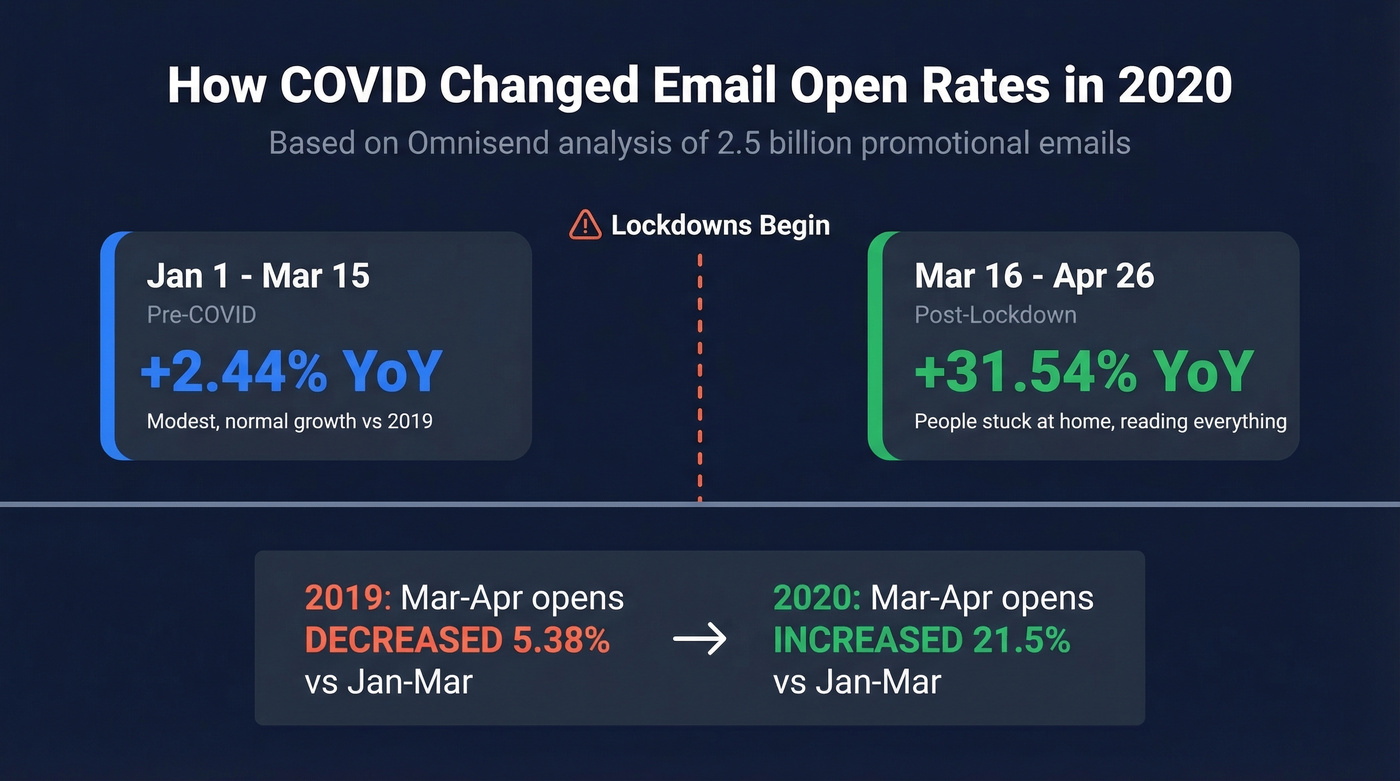
The post-COVID period from March 16 through April 26 saw a +31.54% YoY lift in open rates. People were stuck at home, checking email constantly, and actually reading promotional messages they'd normally ignore. The within-year comparison is even more telling: in 2019, open rates in the March-April window decreased 5.38% compared to January-March. In 2020, that same window saw opens increase 21.5%. COVID didn't just bump the numbers - it fundamentally changed how people interacted with email for months.
Last Year of Clean Data
2020 is the pre-MPP baseline. That matters more than most marketers realize.
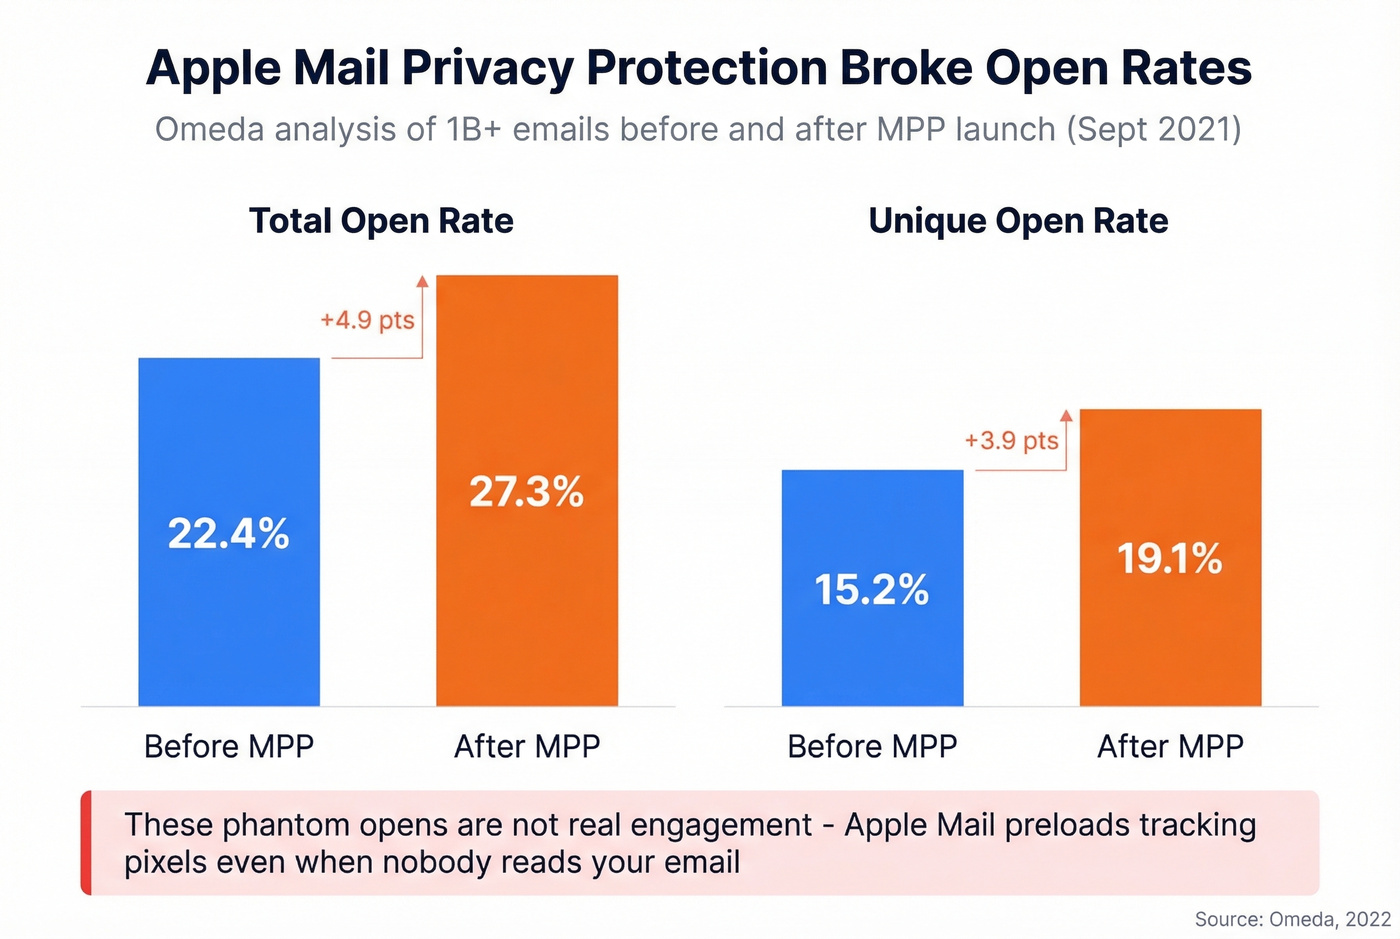
Apple introduced Mail Privacy Protection in September 2021. The feature preloads tracking pixels on Apple Mail, recording "opens" that never actually happened - your recipient didn't read a word, but your ESP logs it as opened. Omeda's before/after analysis across 1B+ emails shows the jump clearly: total open rates rose from 22.4% to 27.3%, and unique open rates went from 15.2% to 19.1%.
That's a 4-5 percentage point inflation depending on your audience's Apple Mail share. If you're building a year-over-year comparison for a board deck or investor update, 2020 is the last full-year anchor before MPP broke the metric.
Using 2020 Benchmarks in 2026
If you're comparing current performance to the average email open rate from 2020, subtract roughly 4-5 percentage points from your current rates to get a closer apples-to-apples read. A "32% open rate" in 2026 is usually closer to 27-28% in real human opens. Solid, but not the leap it looks like on paper.
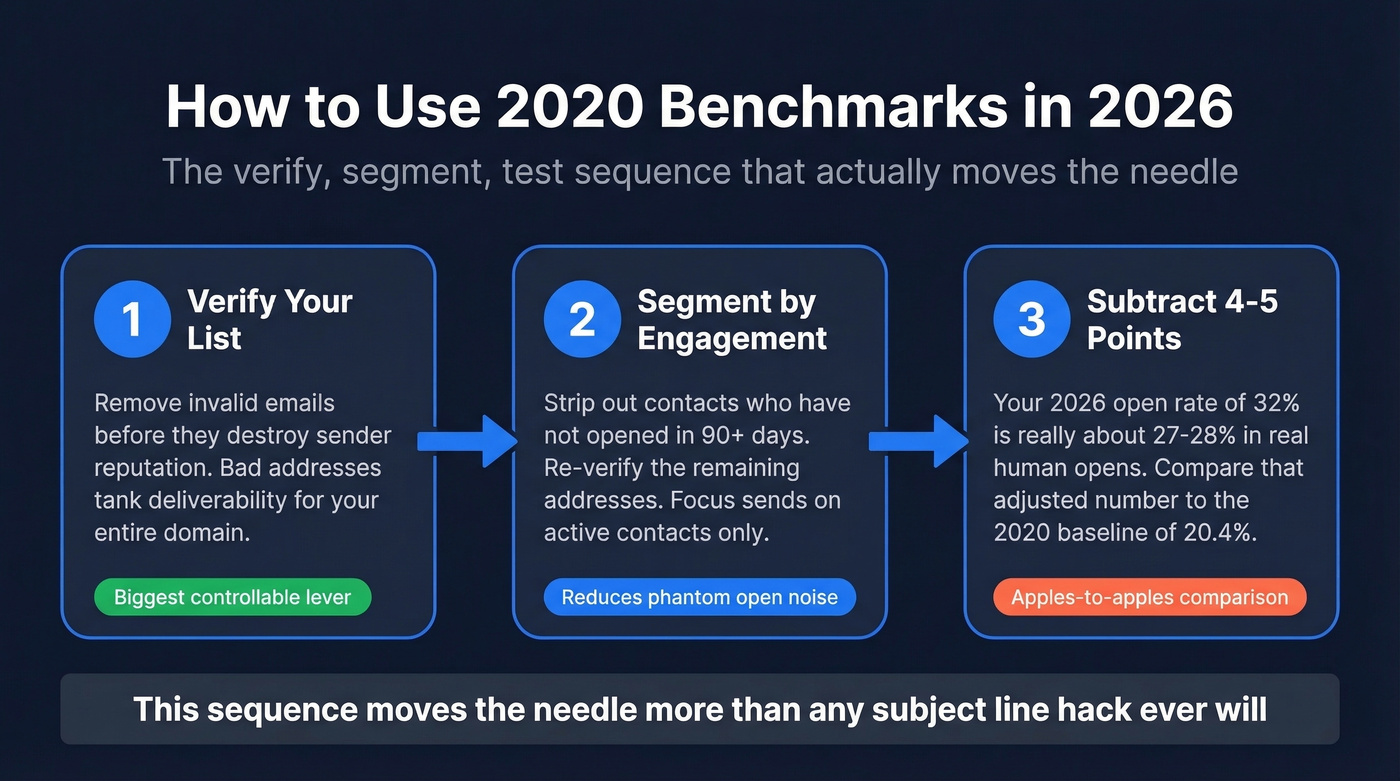
The biggest controllable lever for open rates hasn't changed since 2020: list hygiene. In our experience, it moves the needle more than any subject line optimization or send-time test. One practitioner on r/marketing reported their open rate dropping from the mid-30s to around 20% after switching to monthly newsletters - frequency matters, but so does who you're sending to.
Look, invalid emails don't just bounce. They destroy sender reputation and tank deliverability for your entire domain - the damage goes far beyond a single failed send. Before you A/B test subject lines or optimize send times, verify your list. Prospeo's real-time email verification catches invalid addresses with 98% accuracy before they ever hit an inbox, and the free tier gives you 75 verifications per month - enough to audit a segment and see the difference clean data makes.
Then segment by engagement. Strip out contacts who haven't opened in 90+ days, re-verify the rest, and test send frequency. That sequence - verify, segment, test - moves the needle more than any subject line hack ever will.
If you want to go deeper on the mechanics behind bounces and reputation, start with bounce rates and then tighten up your sender reputation. For teams doing outbound, it also helps to align benchmarks with a dedicated cold email marketing baseline.
Open rates have been unreliable since Apple's MPP broke the metric in 2021. The lever that still works? List hygiene. Prospeo verifies emails in real time with 98% accuracy and refreshes data every 7 days - not every 6 weeks like competitors. Clean lists mean real engagement, not phantom opens.
Stop benchmarking ghost opens. Start sending to verified contacts.
FAQ
What's a good email open rate in 2020?
Anything above 20% for marketing emails was above average in 2020. Top-performing industries like Utilities hit 52.4% in DMA-style benchmarking, while Retail sat around 17-18% in ESP-reported marketing benchmarks. Always compare against your vertical and email type, not just the headline number.
Why are email open rates higher now than in 2020?
Apple's Mail Privacy Protection, launched in September 2021, preloads tracking pixels and records "opens" that never happened. Omeda's data shows this inflated total open rates from 22.4% to 27.3%. Subtract 4-5 points from current rates for a fair comparison to 2020 benchmarks.
How can I improve open rates beyond 2020 benchmarks?
Start with list hygiene - invalid emails destroy sender reputation and tank deliverability across your entire domain. Verify your list first, then segment by engagement level and remove contacts inactive for 90+ days. Clean data is the foundation; subject lines and send times are optimization on top.