Average Sales Close Rate: Benchmarks, Formula, and What "Good" Looks Like
The average sales close rate in B2B hovers around 21%. That number is almost useless without context. Some teams count every inbound lead that touched the CRM. Others only count deals that reached a proposal stage. Same company, same quarter, wildly different numbers depending on the denominator you pick. Here's what the benchmarks actually say, how to calculate yours correctly, and what separates top performers from the rest.
Quick Benchmarks
- Overall B2B win rate: ~21% (Gradient Works analysis of real revenue teams)
- Proposal-stage win rate: 47% (RAIN Group survey of 472 sellers and executives)
- Marketing-qualified lead conversion: 2.9% (Ruler Analytics, 100M+ datapoints)
A 5% close rate from raw leads and a 25% win rate from qualified opportunities can describe the exact same sales team. Segment by industry, deal size, and funnel stage - or the number tells you nothing.
The Formula
Lead-to-close rate = (Deals Closed / Total Leads) x 100
Twenty deals from 400 leads last quarter = 5% close rate. The math is simple. The hard part is defining "total leads." Every form fill? Every demo request? Every webinar hand-raiser? The denominator changes everything, and we've seen teams argue about this for weeks before landing on a definition that sticks.
Some teams also calculate their closing ratio from later-stage pipeline, like SQLs or opportunities. Pick a denominator and standardize it everywhere.
Win rate narrows the lens to qualified pipeline only, which makes it the better metric for coaching and forecasting. Close rate tells you about lead quality and top-of-funnel efficiency. You need both.
Close Rate vs. Win Rate
This denominator debate causes most benchmarking confusion.
| Metric | Denominator | What It Diagnoses | When to Use |
|---|---|---|---|
| Close rate | All leads (MQLs, raw) | Lead quality + funnel efficiency | Marketing alignment |
| Win rate | Qualified opportunities | Sales execution + deal skill | Forecasting + coaching |
Fifty deals won from 1,000 leads = 5% close rate. Those same 50 wins from 200 qualified opportunities = 25% win rate. If your close rate looks terrible but your win rate is healthy, the problem isn't your sales team - it's your lead qualification.
RAIN Group Performance Tiers
RAIN Group's study of 472 sellers revealed a massive spread in proposal-stage win rates:
- Elite sellers: 75%
- Top 20%: 62%
- Everyone else: 40%
The gap between elite and average is 35 percentage points - from the same starting pipeline. Top performers separate themselves with stronger discovery, multi-threading, and deal control. If you're below 40% at the proposal stage, the fix is sales execution, not more leads.
Closing Rate by Industry
The ~21% overall average hides massive variation. A SaaS company and a heavy equipment manufacturer aren't playing the same game.
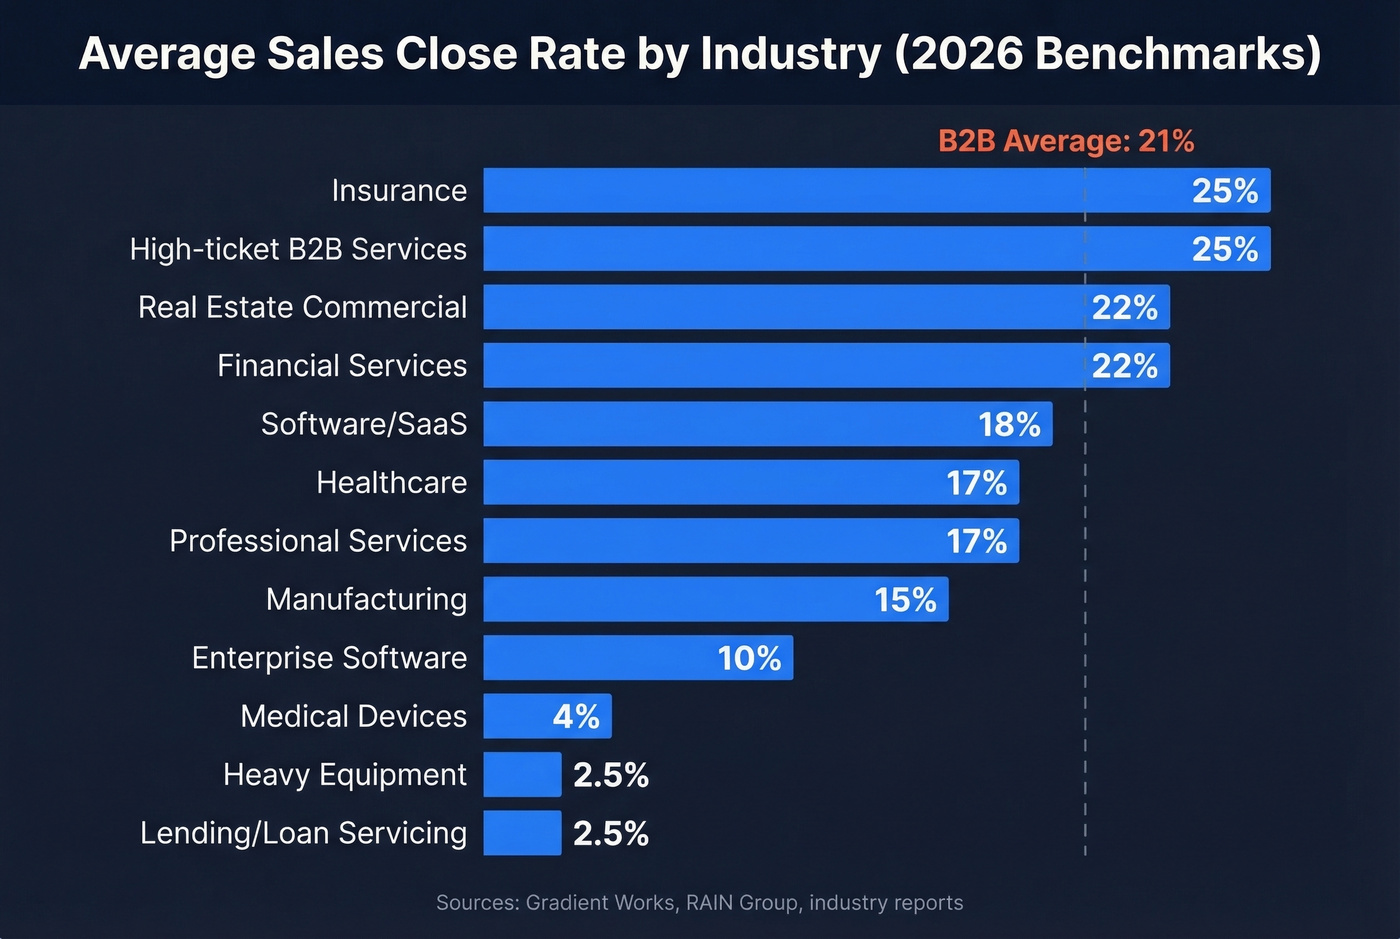
| Industry | Typical Close/Win Rate | Sales Motion |
|---|---|---|
| Insurance | 20-30% | High volume, relationship |
| High-ticket B2B services | 20-30% | Consultative, referral-heavy |
| Real estate (commercial) | 20-25% | Relationship + timing |
| Financial services | 20-25% | Trust-based, regulated |
| Software/SaaS | 15-22% | Demo-driven, competitive |
| Healthcare | 15-20% | Long cycle, compliance |
| Professional services | 15-20% | Proposal-based |
| Manufacturing | 12-18% | RFP-driven, technical |
| Enterprise software | 5-15% | Complex, multi-stakeholder |
| Medical devices | 3-5% | Regulatory, long approval |
| Heavy equipment | 2-3% | Capital expenditure, slow |
| Lending/loan servicing | 2-3% | High volume, low intent |
Here's the thing: a 3% close rate in medical devices might represent excellent performance. The real question is whether you're above or below your industry median and whether the trend line is heading the right direction.
By Deal Size
Bigger deals close at lower rates. More stakeholders, longer cycles, higher scrutiny.
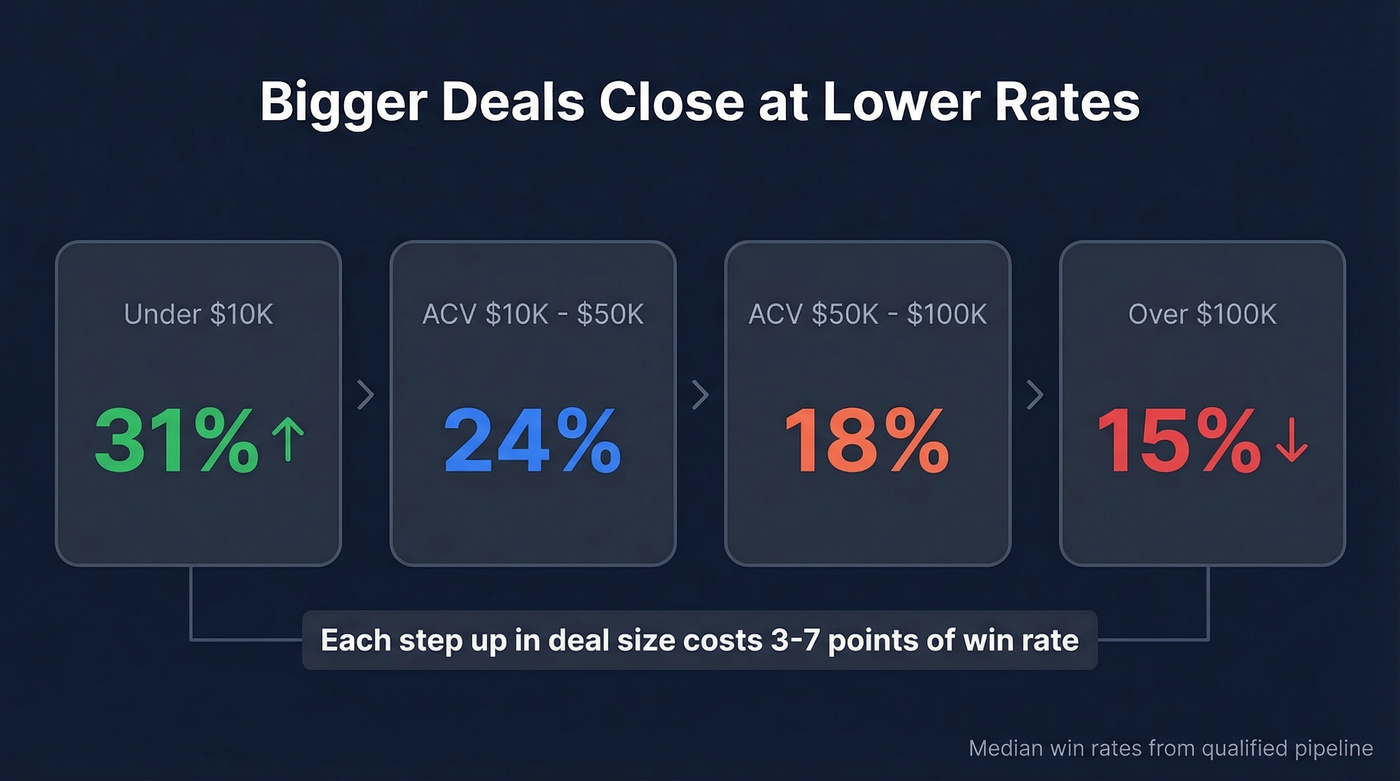
| Deal Size (ACV) | Median Win Rate |
|---|---|
| Under $10K | 31% |
| $10K-$50K | 24% |
| $50K-$100K | 18% |
| Over $100K | 15% |
Every step up in deal size costs you 3-7 points of win rate. If you're selling six-figure deals at a 25% win rate, you're outperforming. If you're closing four-figure deals at 15%, something's broken upstream.
Let's be honest: if your ACV sits in the low four figures and your win rate is below 20%, you don't have a closing problem - you have a lead scoring problem. At that deal size, you should be disqualifying faster, not selling harder.
A low close rate usually traces back to bad data - wrong emails, stale contacts, unqualified leads. Prospeo's 98% email accuracy and 7-day data refresh mean your reps spend time closing real buyers, not chasing bounces. Teams using Prospeo book 26% more meetings than ZoomInfo users.
Fix the top of your funnel and watch your close rate climb.
By Funnel Stage
Your funnel has five or six conversion points, and the leak could be anywhere.
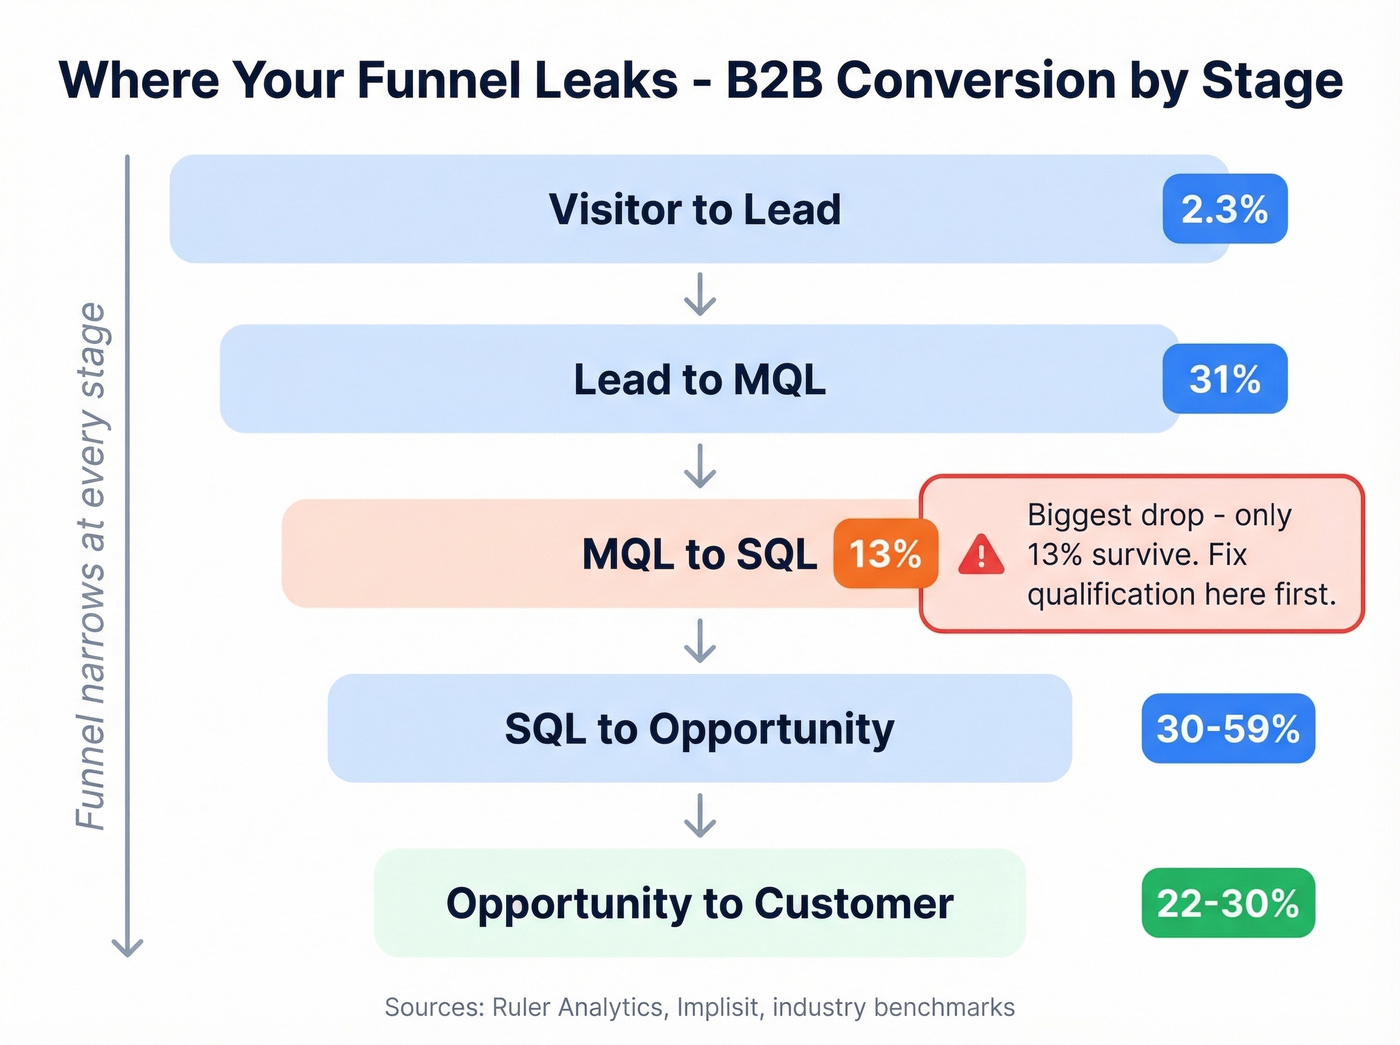
| Stage | Typical Conversion |
|---|---|
| Visitor to Lead | ~2.3% |
| Lead to MQL | 31% |
| MQL to SQL | 13% |
| SQL to Opportunity | 30-59% |
| Opportunity to Customer | 22-30% |
The biggest drop happens at MQL to SQL. Only 13% of marketing-qualified leads survive sales qualification - that's where most teams hemorrhage, and it's why close rate measured from raw leads looks so much worse than win rate measured from opportunities. If your MQL-to-SQL conversion is below 10%, fix qualification criteria before you touch the sales process. Standardizing on a framework like BANT or MEDDIC forces marketing and sales to agree on what "qualified" actually means.
SMB vs. Enterprise
| Stage | SMB / Mid-Market | Enterprise |
|---|---|---|
| Visitor to Lead | 1.4% | 0.7% |
| Lead to MQL | 41% | 39% |
| MQL to SQL | 39% | 31% |
| SQL to Opportunity | 42% | 36% |
| Opp to Close | 39% | 31% |
SMB and mid-market teams close at 39% from opportunity - eight points higher than enterprise at 31%. Enterprise deals often involve 8-13 stakeholders, run longer, and produce more "no decision" outcomes. If you're moving upmarket, expect your closing ratio to drop even if your team is performing better.
By Lead Source
Where leads come from predicts how well they close. Outbound-sourced leads convert to sales at a 34% higher rate than inbound.
| Lead Source | Opp-to-Close Rate |
|---|---|
| Events | 40% |
| SEO (organic) | 38% |
| PPC (paid search) | 35% |
| Webinars | 33% |
| 32% |
Events and organic search produce the highest-converting opportunities. Email sits at 32% - solid for a channel that scales without per-lead cost increases. For context, Ruler Analytics reports an overall 2.9% qualified lead conversion rate across 100M+ datapoints, but that's a marketing conversion metric (visitor to qualified lead), not a sales closing rate.
Inside vs. Outside Sales
Opportunities closed within 50 days show a 47% win rate. Beyond 50 days, win rates drop to 20% or lower. Deals that stall usually die.
The outside sales closing rate tends to run higher than inside sales - field reps who meet prospects face-to-face typically convert at 30-40% from qualified pipeline, compared to 20-25% for inside teams. The tradeoff is cost per acquisition: an outside close rate looks impressive until you factor in travel, territory overhead, and the smaller number of deals a field rep can work simultaneously.
| Industry | Avg. Cycle (Days) |
|---|---|
| Software | 90 |
| Healthcare | 125 |
| Manufacturing | 130 |
| Pharmaceuticals | 138 |
Fifty-eight percent of B2B professionals report longer sales cycles year-over-year, making pipeline hygiene even more critical. We've seen teams materially inflate their pipeline by refusing to kill stale opportunities - one team we talked to had 40% of their "active" pipeline sitting untouched for over 120 days. If a deal has been sitting for twice the average cycle length, remove it. Aggressive pipeline hygiene hurts in the short term but makes your win rate and your forecast actually mean something.
Common Tracking Mistakes
Do this: Track "Disqualified" as a separate disposition, not as Closed-Lost. Excluding no-decision outcomes can inflate your win rate by 10-15 points, which feels good but hides the real problem.
Not that: Counting every form fill, chatbot interaction, and webinar attendee as a "lead" in your close rate denominator.
Do this: Define your denominator once and stick with it. Document whether "close rate" at your company means lead-to-close or opportunity-to-close, then make sure every dashboard, report, and board deck uses the same definition. That's the only way to arrive at an accurate closing ratio you can benchmark against peers.
Not that: Letting reps self-report close rates using different starting points. If one AE counts from demo-booked and another counts from SQL, you're comparing fiction.
An OP on r/sales shared a 5% close rate after upgrading tracking - and realized the denominator included window shoppers, no-budget prospects, and long timelines. That wasn't a closing problem. It was a measurement problem.
How to Improve Close Rate
A practitioner on r/SaaS tracked their demo-to-close rate obsessively for six months and moved it from 18% to 34%. The five changes that worked:
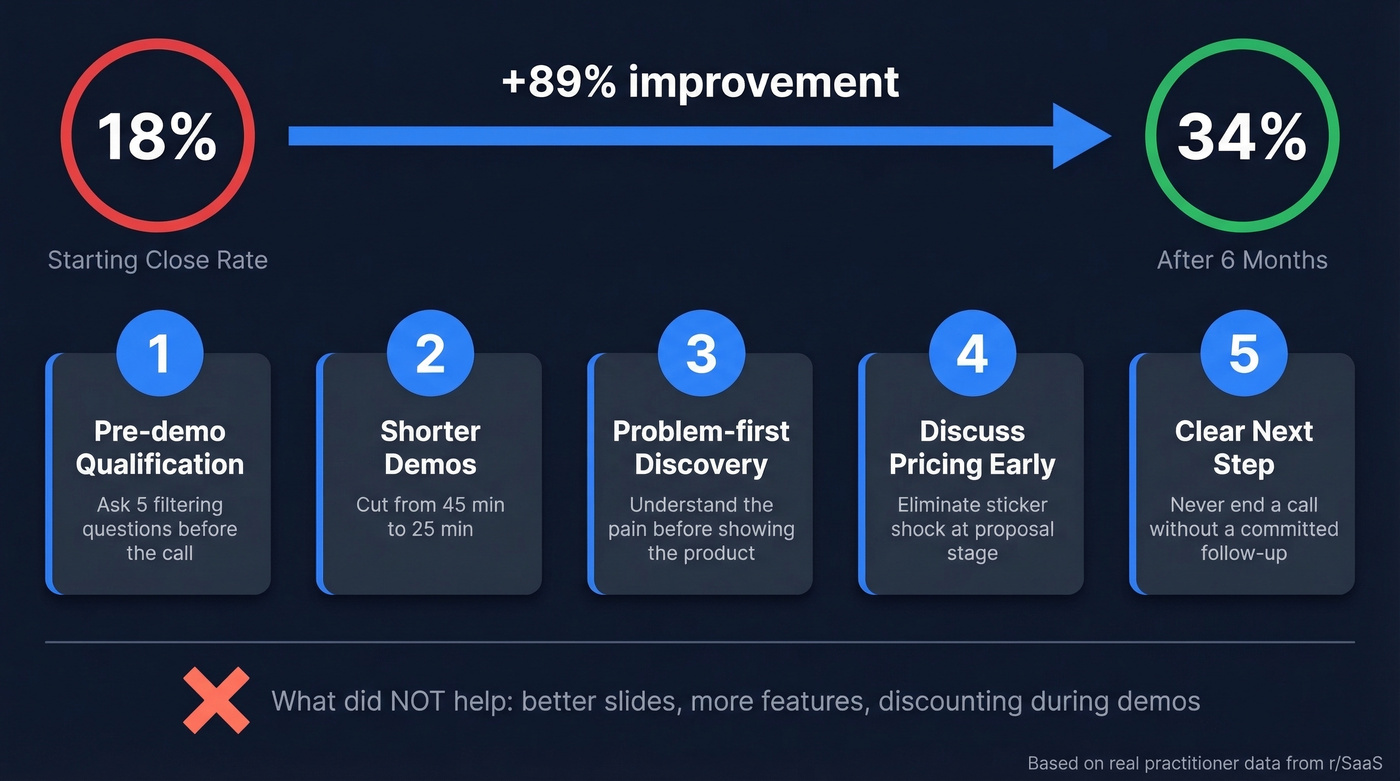
- Pre-demo qualification form - five questions to filter bad fits before the call
- Shorter demos - cut from 45 minutes to 25
- Problem-first discovery - understand the pain before showing the product
- Pricing discussed earlier - eliminates sticker shock at the proposal stage
- Clear next step - never end a call without a committed follow-up
What didn't help: better slides, showing more features, or discounting during the demo. Qualification and structure beat polish every time.
Two more data points worth acting on. Multi-threaded deals - engaging multiple stakeholders - lift win rates by 130% according to Gong research. And roughly 80% of sales require at least five follow-ups, yet nearly half of reps give up after one touch.
Look, most teams overlook data quality entirely, but your close rate denominator gets inflated every time a rep wastes touches on unreachable contacts - bounced emails, wrong numbers, people who left the company months ago. In our experience, cleaning your contact data is the single fastest way to make your pipeline metrics reflect reality. Prospeo's 98% email accuracy and 7-day data refresh cycle eliminate those phantom leads before they pollute your pipeline, and the free tier gives you 75 verified emails per month to start.
If you want a broader menu of options, compare data enrichment services and tighten your lead generation workflow so bad-fit records never enter the CRM.
If your MQL-to-SQL conversion is bleeding out at 13%, the problem isn't your closers - it's lead quality. Prospeo's 30+ filters including buyer intent, headcount growth, and technographics let you build pipeline that actually qualifies. 83% of enriched leads come back with verified contact data.
Stop feeding your pipeline junk leads at $0.01 per verified email.
FAQ
What's a good B2B close rate?
From all leads, 5-10% is solid. From qualified opportunities, 20-30% is healthy and top performers hit 40%+. The overall B2B win-rate benchmark sits around 21%, but industry and deal size matter more than any single number.
How do you calculate close rate vs. win rate?
Close rate divides deals won by total leads. Win rate divides deals won by qualified opportunities only. A team with a 5% close rate and 25% win rate has a lead quality issue, not a selling problem.
What's a typical closing ratio by deal size?
The ratio drops as deal value rises. Deals under $10K close at roughly 31%, while deals over $100K close at around 15%. Each jump in ACV adds stakeholders and scrutiny, which naturally compresses win rates.
Should disqualified leads count as closed-lost?
No. Bundling disqualified leads into closed-lost inflates your denominator and makes your average sales close rate look artificially low. Track disqualified separately for a clean metric that reflects actual execution.
How can I improve close rate without changing the pitch?
Fix your data first. Unreachable contacts inflate your denominator without giving reps a real at-bat. Verify contact data, pair it with stricter pre-call qualification, and most teams see improvement within a quarter. Skip this if your MQL-to-SQL conversion is already above 25% - in that case, the bottleneck is probably further down the funnel.