B2B Data Analytics: What to Measure, What "Good" Looks Like, and Where Teams Go Wrong
Marketing's dashboard shows MQLs up 15%. Sales says pipeline is down 20%. Finance has a third number that somehow makes both teams look wrong.
We've sat in that revenue meeting more times than we can count, and the root cause is always the same: everyone's measuring different things on top of inconsistent data. B2B data analytics only works when you treat it like an operating system for revenue - not a prettier set of charts. With Salesforce research showing 84% of sales reps missed quota last year, nobody has patience for analytics theater.
The Short Version
- Fix data quality before dashboards. CRM data decays around 25-30% per year, which turns analytics into guesswork fast.
- Pick 4-5 tools that integrate, not 15 that don't. Tool sprawl is where truth goes to die.
- Measure the 6 metrics that predict revenue: lead-to-customer, MQL-to-SQL, sales cycle, win rate, CAC payback, pipeline velocity.
- Add attribution and AI later. They're multipliers, not miracles.
What Is B2B Data Analytics?
B2B data analytics is the practice of measuring and improving revenue performance across a long, messy buyer journey spanning marketing, sales, and customer success. It turns fragmented signals from dozens of touchpoints into decisions your revenue team can actually act on.
The big difference vs. B2C: your unit of analysis isn't a single consumer. It's accounts plus buying committees, and the committee averages 7 people involved in the decision. That changes everything - identity resolution, attribution, even what "conversion" means. Products often have one or two users per account logging in infrequently, making feature-to-revenue attribution far harder than in consumer businesses. And because B2B sales cycles run for months, you're optimizing a system over time, not a checkout funnel.
Why It Matters in 2026
B2B has gone fully multi-channel, whether your reporting is ready or not. Gartner projected 80% of B2B sales interactions would be digital by 2025 - that's now the reality, with buyers using roughly 10 channels on average. That's a tracking and governance problem, not a "we need a new dashboard" problem.
The upside is real. Data-driven organizations are 58% more likely to surpass revenue goals, and 72% of B2B buyers expect personalization. You can't personalize - or even prioritize - without clean, connected data. McKinsey's commercial analytics outperformers consistently show 15-25% higher EBITDA, which is why analytics keeps getting budget even when headcount freezes.

Metrics That Actually Matter
Most teams track too many metrics and still can't answer one question: "What's driving revenue this quarter?"
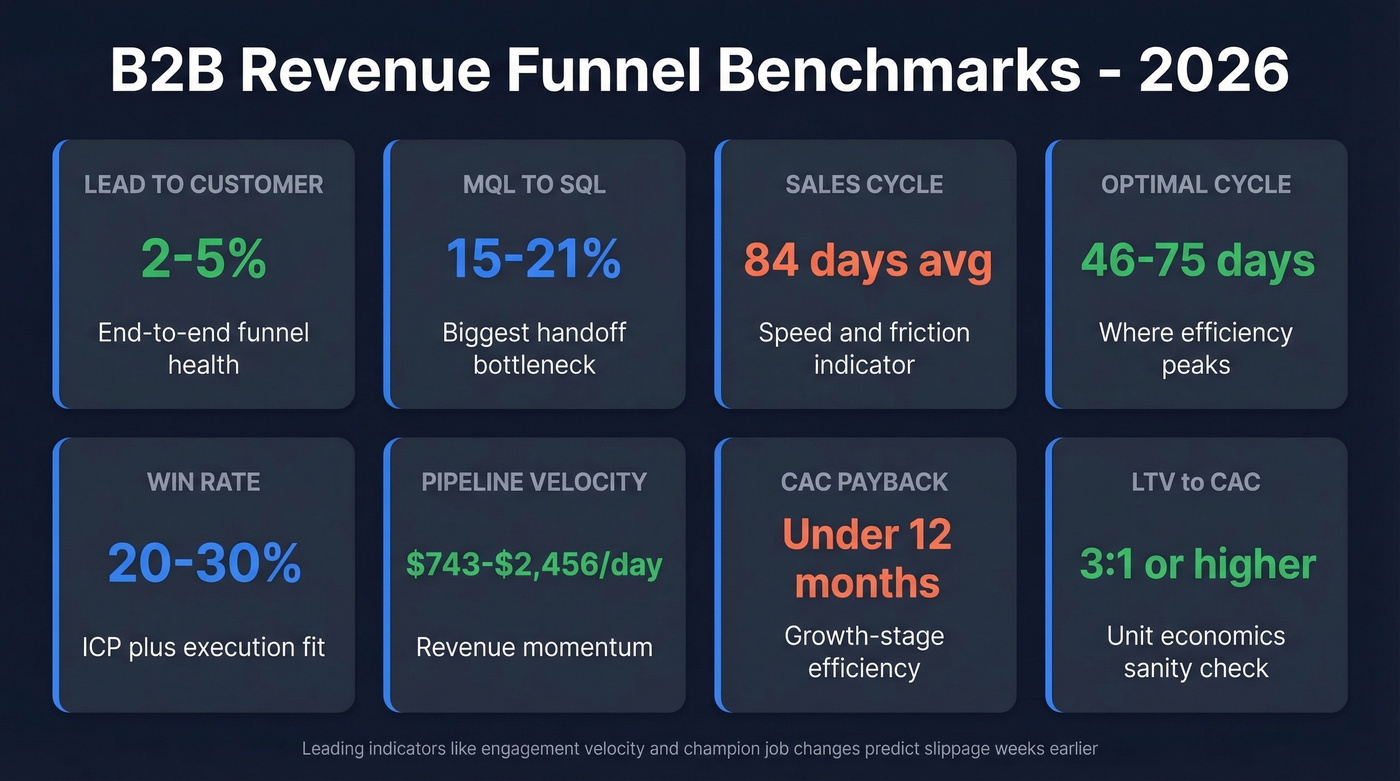
Here are the benchmarks we use to sanity-check a funnel and spot where the leak actually is:
| Metric | "Good" Benchmark | What It Tells You |
|---|---|---|
| Lead-to-Customer | 2-5% | Funnel health end-to-end |
| MQL-to-SQL | 15-21% | Biggest handoff bottleneck |
| Sales Cycle | 84 days | Speed + friction |
| "Optimal" Cycle | 46-75 days | Where efficiency peaks |
| Win Rate | 20-30% | ICP + execution fit |
| Pipeline Velocity | $743-$2,456/day | Revenue momentum |
| CAC Payback | <12 months | Growth-stage efficiency |
| LTV:CAC | 3:1+ | Unit economics sanity |
Here's what most competitor guides miss: leading indicators matter more than lagging ones. Behavioral signals like content engagement velocity, multi-threaded deal activity, and champion job changes predict deal slippage weeks before pipeline reviews surface it. Track those alongside the table above.
A huge chunk of your buyer journey is invisible, too. High-intent research happens before anyone fills out a form - the "anonymous visitor problem" - which means your attribution will always undercount top-of-funnel influence. Accept that gap and design around it instead of pretending your data captures everything.
Quick channel reality check: SEO often converts better at the top of funnel than paid. One benchmark set shows SEO visitor-to-lead at 2.1% vs. PPC at 0.7%. That doesn't mean "pause PPC." It means your reporting should separate volume channels from efficiency channels so you stop arguing about the wrong thing.
If you're trying to map those touchpoints cleanly, start with a simple inventory of buyer journey signals before you add more tools.
CRM data decays 25-30% per year, and every metric in this article becomes unreliable when your foundation is rotten. Prospeo's 7-day refresh cycle and 98% email accuracy keep the data layer clean so your analytics actually reflect reality - not last quarter's contacts.
Stop running analytics on decaying data. Start with records you can trust.
The Maturity Model
Let's be honest: most teams don't have an analytics problem. They have a definitions problem. If marketing, sales, and finance can't agree on what an "opportunity" is, no BI tool will save you.
The consensus on r/ProductManagement is blunt - there are teams operating with no analytics tooling at all, where decisions come secondhand from customer-facing teams. That's Stage 0, and it's more common than vendors want to admit. Worth remembering: 32% of orgs don't use the full capabilities of their existing stack, so "add another tool" is usually the wrong move.
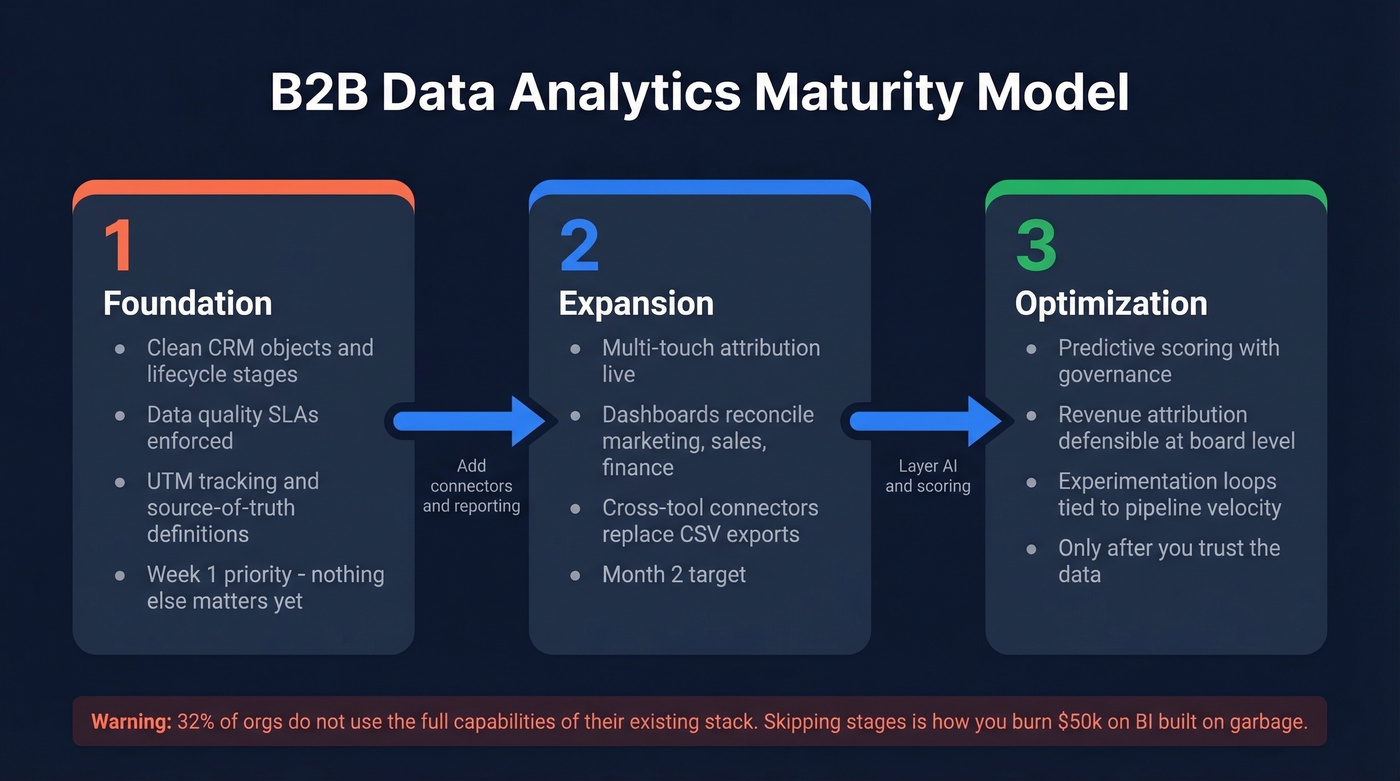
Here's the 3-stage model that maps to how teams actually evolve:
- Stage 1 - Foundation. Clean CRM objects, lifecycle stages, data quality SLAs, basic tracking with UTMs and source-of-truth definitions. Do this first. Nothing else matters until it's solid. (If you need a starting point, use a clear RevOps tech stack blueprint.)
- Stage 2 - Expansion. Multi-touch attribution, consistent pipeline reporting, dashboards that reconcile marketing + sales + finance definitions, cross-tool connectors replacing weekly CSV exports.
- Stage 3 - Optimization. Predictive scoring with governance, revenue attribution you can defend in a board meeting, experimentation loops tied to pipeline velocity and payback.
Implementation sequence matters. Start with CRM hygiene and object definitions in week one, add connectors and reporting in month two, and layer attribution and scoring only after you trust the underlying data. Skipping ahead is how you end up with a $50k+ BI deployment built on garbage.
Building Your Analytics Stack
The average B2B org runs 12-20 tools, and 65.7% cite integration as the top challenge. A typical mid-market stack costs $30k-$80k/year, and you can burn that budget fast without ever improving decision-making.
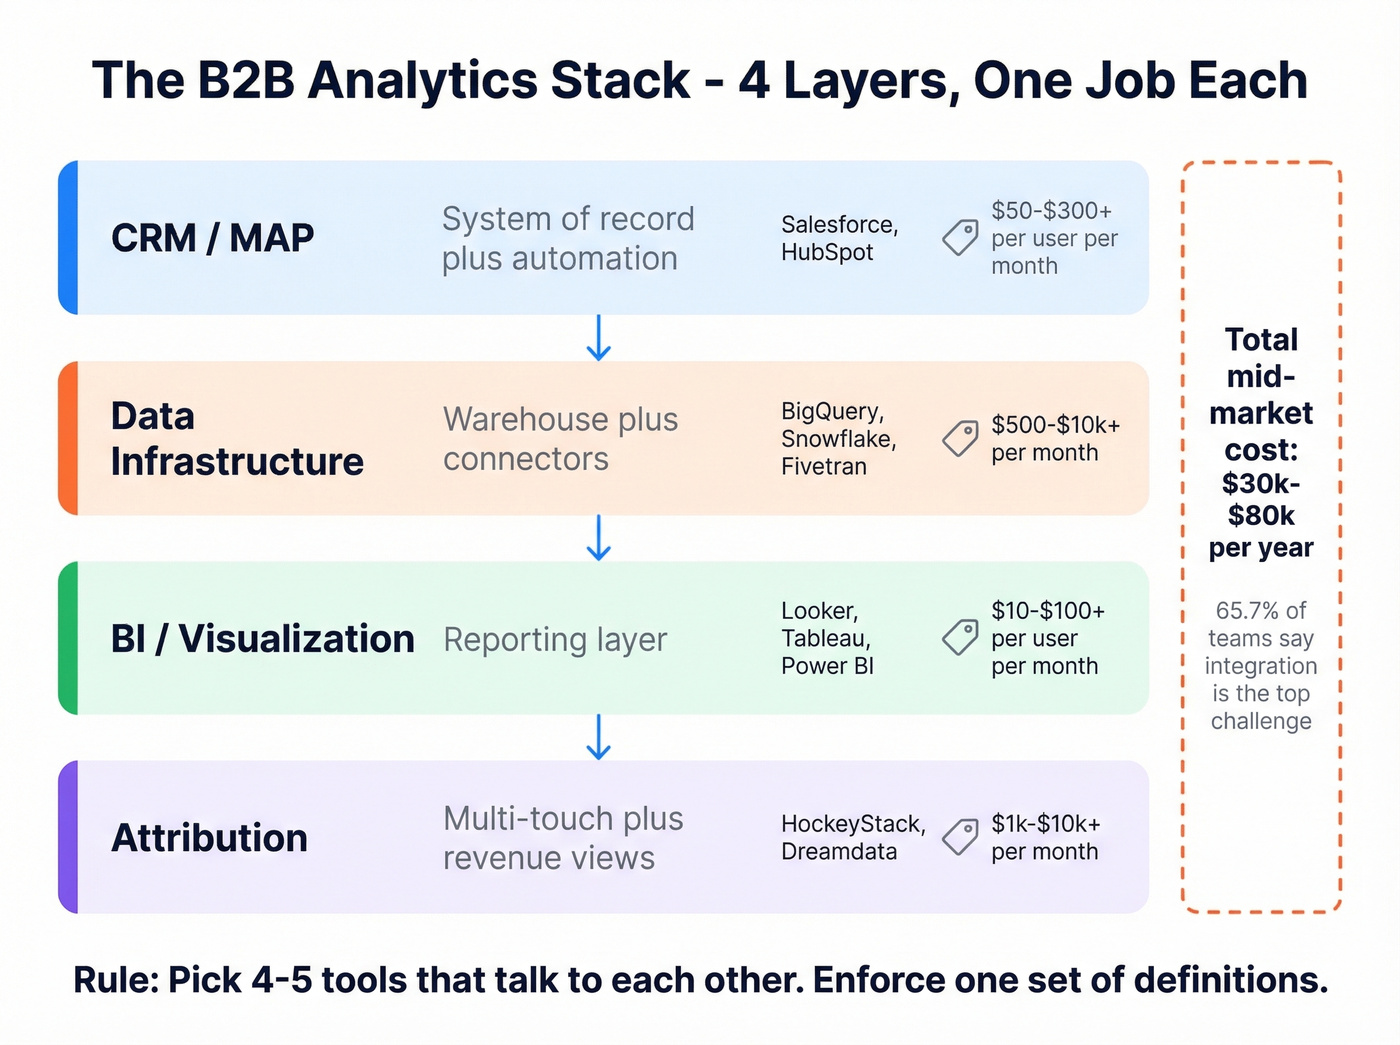
Five categories, one job each:
| Category | What It Does | Examples | Pricing Signal |
|---|---|---|---|
| CRM/MAP | System of record + automation | Salesforce, HubSpot | ~$50-$300+/user/mo |
| Data infrastructure | Warehouse + connectors | BigQuery/Snowflake + Fivetran | ~$500-$10k+/mo |
| BI/visualization | Reporting layer | Looker, Tableau, Power BI | ~$10-$100+/user/mo |
| Attribution | Multi-touch + revenue views | HockeyStack, Dreamdata | ~$1k-$10k+/mo |
If you're evaluating CRM workflow tooling specifically, compare options in CRM automation before you commit to a stack.
Skip the temptation to buy 15 tools. Pick 4-5 that talk to each other and enforce one set of definitions. For a solid overview of what marketing teams track in practice, HubSpot's breakdown of B2B marketing analytics is a decent reference - just don't confuse "things you can measure" with "things that matter."
Data Quality: The Foundation
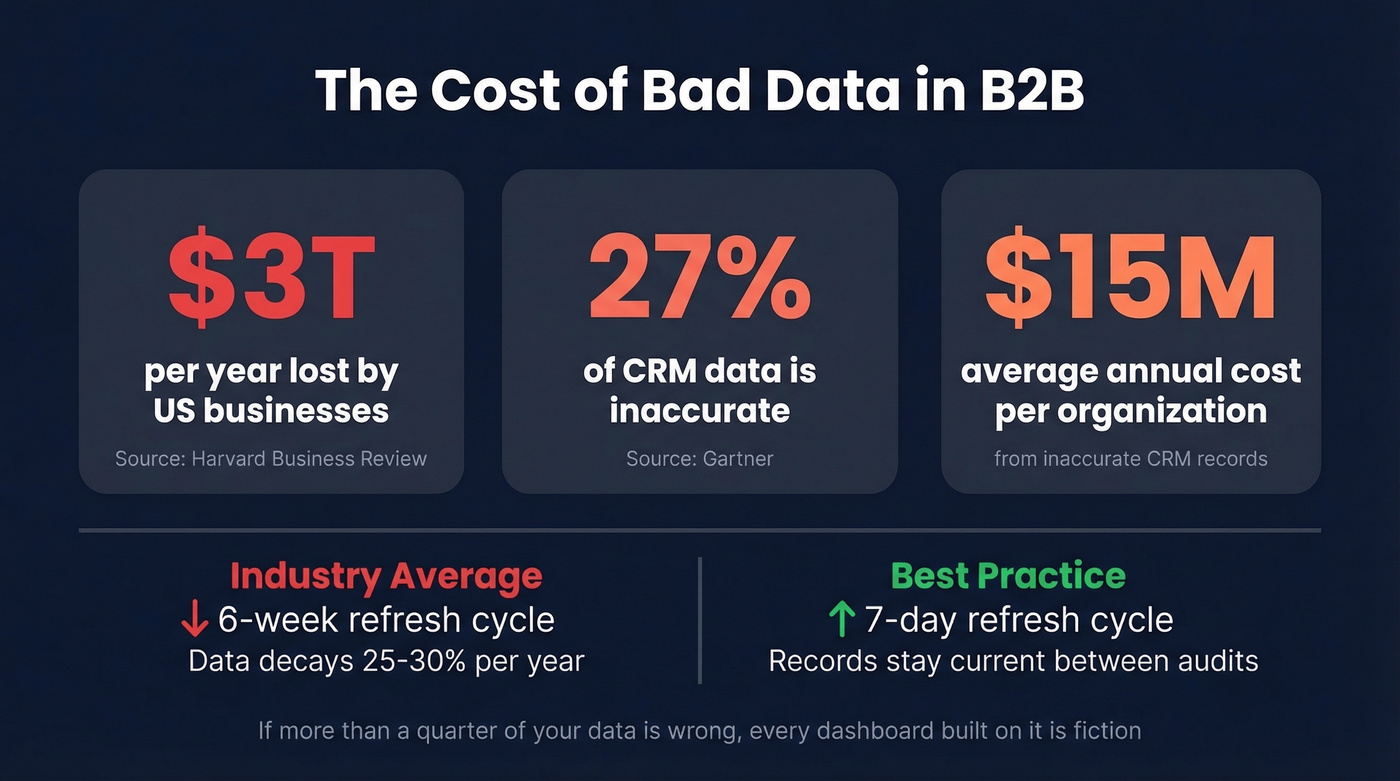
Poor data quality costs US businesses $3 trillion per year according to Harvard Business Review, and Gartner estimates 27% of CRM data is inaccurate - costing organizations $15M/year on average. If more than a quarter of your data is wrong, every dashboard built on it is fiction.
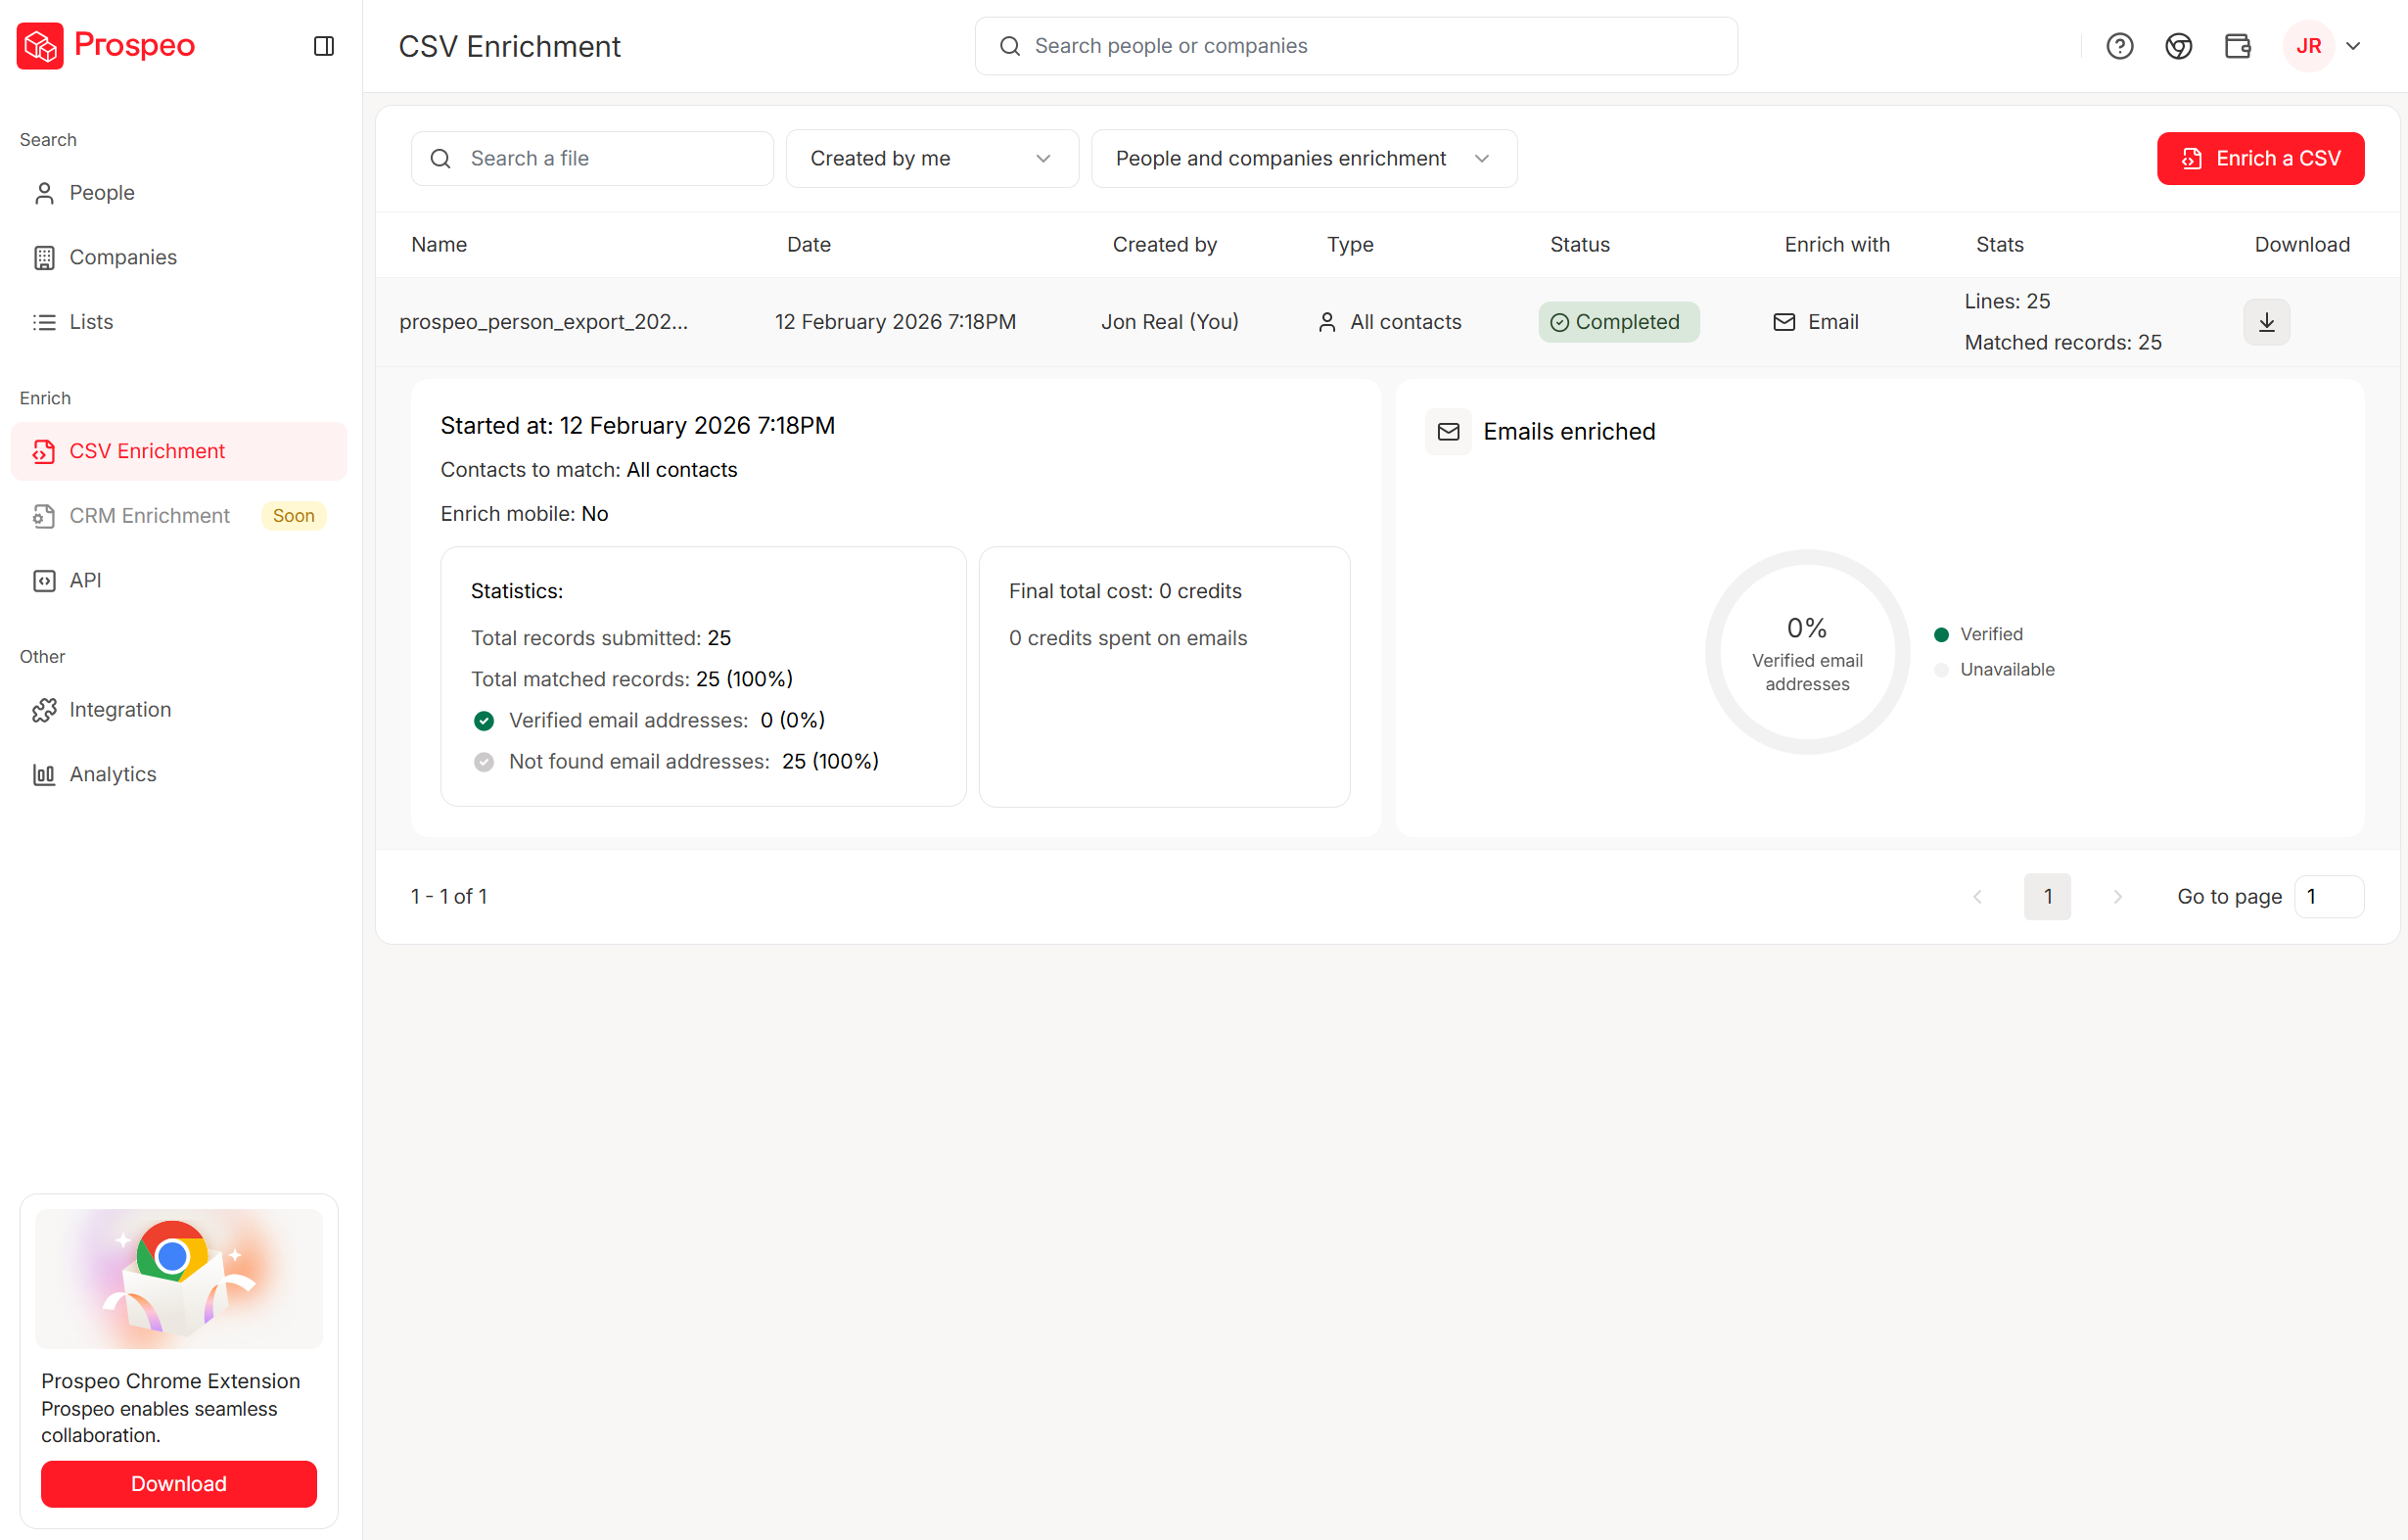
The workflow is straightforward: enrich a CSV or CRM segment, verify emails and mobiles in real time, dedupe, then push a cleaned dataset back into your system of record before you measure anything downstream. If you're shopping, start with the best data enrichment tools and work backward from your required fields.
A 7-day data refresh cycle - versus the 6-week industry average - means the records feeding your dashboards stay current rather than decaying between quarterly audits. Without that step, every metric you report is built on decaying inputs.
On the governance side, one metric I like from Directive's framework is pipeline attribution rate - attributed pipeline divided by total pipeline, reviewed monthly. It forces a hard conversation: are we actually tracking what creates pipeline, or just what's easy to tag? Split ownership between Marketing Ops (UTMs, campaign hygiene, connectors) and RevOps (account/opportunity consistency, lifecycle stage discipline). (This is also where a clean MQL-to-SQL handoff prevents reporting fights.)
Pipeline velocity and win rates only improve when reps reach real buyers. Prospeo delivers 143M+ verified emails and 125M+ mobile numbers with a 30% pickup rate - at $0.01/email. That's the data quality foundation your analytics stack is missing.
Better inputs, better analytics. Teams using Prospeo book 26% more meetings than ZoomInfo users.
AI and Predictive Analytics
Predictive lead scoring works best as prioritization - it reduces noise, helps reps manage volume, and makes routing less political. It fails when teams treat it like definitive intent. Models don't "know" who's buying; they infer patterns from messy history, and messy history is most B2B CRMs.
If you're building scoring, align it to your ideal customer profile first, then layer signals.
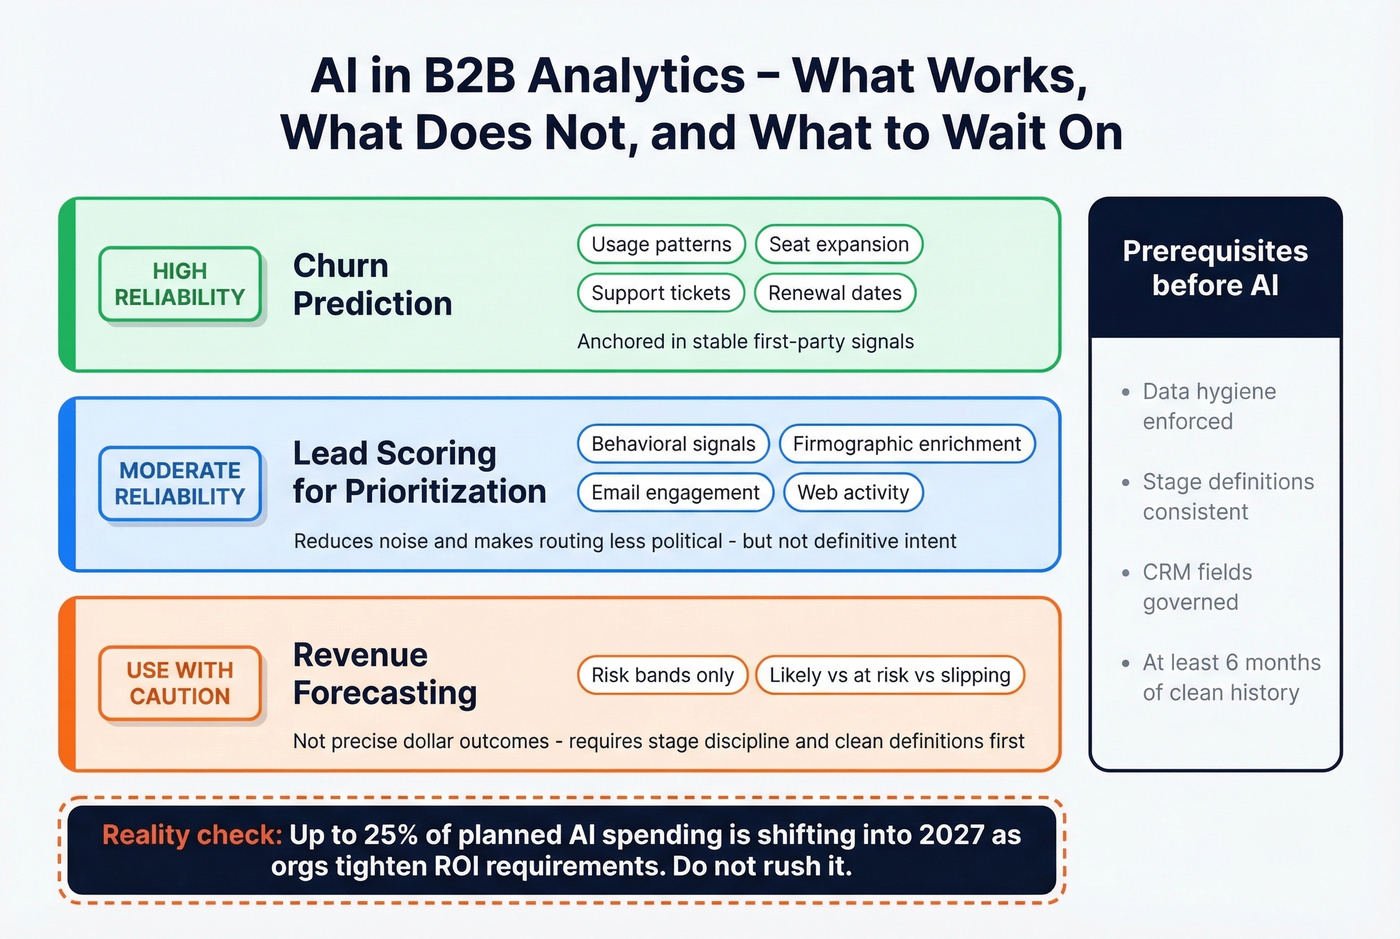
The most effective scoring models combine data mining techniques - pulling behavioral signals from product usage, email engagement, and web activity - with firmographic enrichment to weight accounts by fit and timing. Churn prediction is the most reliable use case because it's anchored in stable first-party signals: usage, seat expansion, support patterns, and renewal dates.
Forecasting models add value as risk bands ("likely / at risk / slipping"), not precise dollar outcomes. The prereqs are boring but non-negotiable: data hygiene, stage discipline, and consistent definitions. One 2026 reality check worth flagging - up to 25% of planned AI spending is shifting into 2027 as orgs tighten ROI requirements. Don't rush it.
Mistakes That Kill Programs
We've seen every version of these failures. Here are the five that kill B2B data analytics programs most often:
1. Trusting dirty CRM data. Enforce enrichment and verification, dedupe weekly, add governance SLAs for critical fields. If you're not verifying contact data before it enters your system, you're building on sand. (A lightweight data validation automation process helps here.)
2. Chasing vanity metrics. Tie reporting to pipeline velocity, win rate, payback, and cycle length - not clicks and MQL volume. An MQL that never converts is just a cost center with a nice label.
3. Siloing data across a dozen tools. Pick a warehouse and connector strategy, then standardize IDs and lifecycle stages across systems. When company datasets live in disconnected tools, no single team has a complete picture of the buyer journey. If you're stuck, start by managing the sales pipeline with one set of stage rules.
4. Building dashboards before the foundation. Define objects and ownership first. Dashboards come after you can reconcile numbers across teams. We've seen orgs spend six months on a Looker implementation only to realize marketing and sales were counting opportunities differently the entire time.
5. Buying tools you don't fully use. Audit adoption quarterly - 32% underuse is common, and strong data governance is associated with a 20-40% efficiency boost. Before adding a new line item, make sure you're getting value from what you already have.
FAQ
What's the difference between B2B and B2C analytics?
B2B tracks accounts and buying committees across months-long cycles; B2C tracks individual consumers making faster decisions. Attribution has to be account-centric, and you'll typically need firmographic and technographic data rather than individual-level behavioral streams. Expect 7+ stakeholders per deal versus one consumer.
How much does a B2B analytics stack cost?
A typical mid-market stack runs $30k-$80k/year across CRM, BI, attribution, and enrichment. Enrichment tools like Prospeo start free (75 emails/month) and scale to roughly $0.01/email, so data quality doesn't require enterprise contracts. Start lean and add tools only after Stage 1 foundations are solid.
What's the most important metric to track?
Pipeline velocity - it combines deal size, win rate, and cycle length into one revenue-predictive number. The benchmark range is $743-$2,456/day. If velocity is declining while MQL counts rise, your funnel has a conversion or quality problem that surface-level dashboards won't catch.