B2B Marketing KPIs: The Only Metrics Your CEO Actually Cares About
You just walked out of a board meeting where the CMO presented a 24-metric dashboard. The CEO asked one question: "How much pipeline did marketing create last quarter?" Silence. Twenty-four KPIs on screen, and not one answered the only question that mattered.
That disconnect is why most dashboards get ignored - and it's fixable. Here are the 7 KPIs that tie to revenue, with formulas, benchmarks, and a framework to defend every single one.
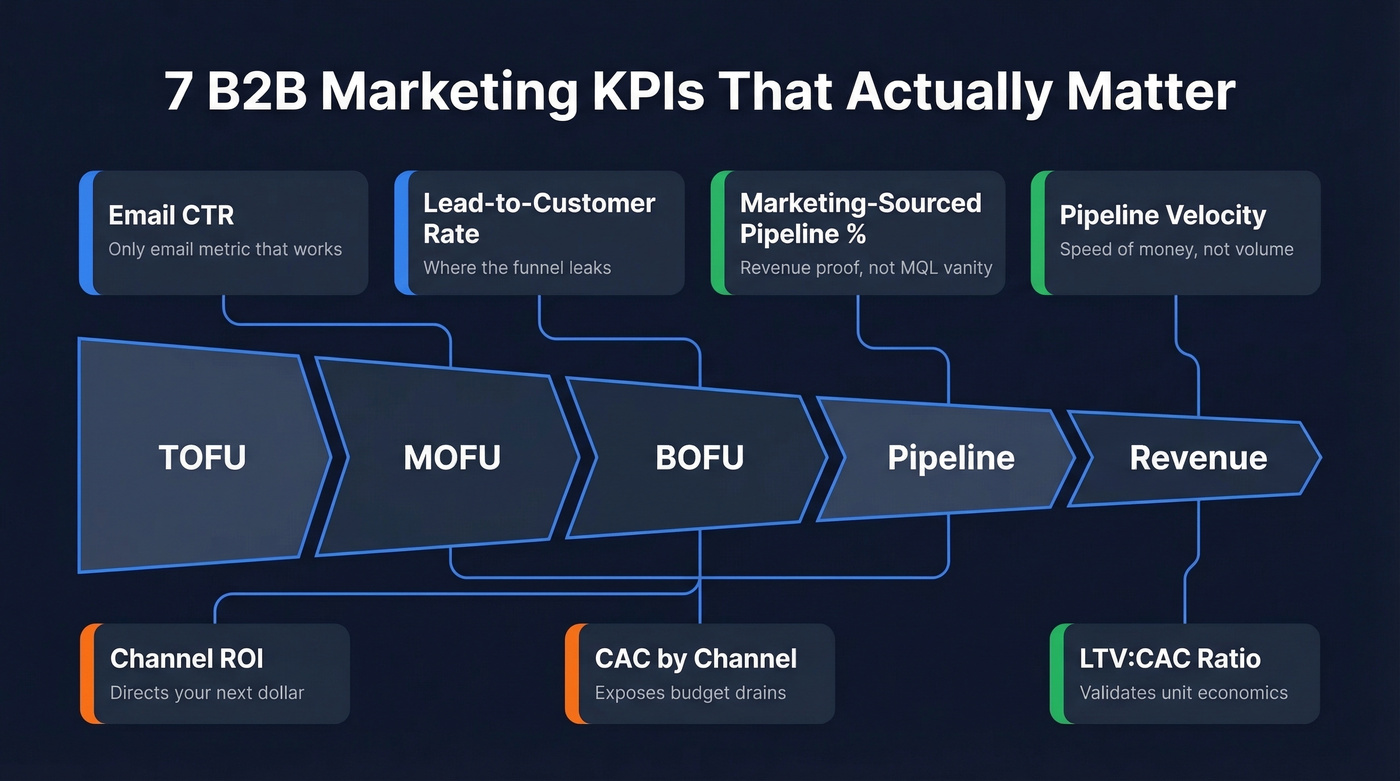
The 7 KPIs at a Glance
Stop tracking 24 metrics. Track these 7:
| Funnel Stage | KPI | Why It Matters |
|---|---|---|
| Revenue | Pipeline Velocity | Speed of money, not volume |
| Efficiency | CAC by Channel | Exposes budget-draining channels |
| MOFU/BOFU | Lead-to-Customer Rate | Pinpoints where the funnel leaks |
| Pipeline | Marketing-Sourced Pipeline % | Revenue proof, not MQL vanity |
| Revenue | LTV:CAC Ratio | Validates unit economics |
| Efficiency | Channel ROI | Directs your next dollar |
| TOFU/MOFU | Email CTR | Only email metric that still works |
Why Most KPI Dashboards Get Ignored
The root problem is time lag. In B2B, the gap between marketing spend and revenue impact runs 9-15 months - the MQLs you're celebrating today often won't close for three to five quarters. If your dashboard doesn't account for that lag, you're reporting activity, not outcomes. Activity reports get ignored. Teams spend 10-20 hours per week on manual reporting that nobody reads, and automated dashboards tied to the right metrics cut that by 80%+.
This isn't just a credibility issue, either. Delaware's 2023 Duty of Oversight expansion means boards face real liability for GTM metrics that mislead investors. Your dashboard isn't just a marketing tool anymore. It's a governance document.
KPIs vs. Metrics: Know the Difference
Every number on your dashboard is a metric. Only a handful are KPIs. The difference? A KPI ties to a business goal and triggers a decision. Leadfeeder's litmus test nails it: "If it changes what you do next week, it's a KPI."
The practical move is pairing leading indicators with lagging ones. Track ICP traffic share and target account engagement (leading) alongside pipeline and revenue (lagging). Leading indicators tell you if you're on course. Lagging indicators tell you if you arrived. You need both, but only the lagging ones go in the board deck.
How to Choose KPIs by GTM Model
Not every team should track the same indicators. Your go-to-market model dictates which B2B marketing metrics actually matter.
| GTM Model | Primary KPIs | Supporting Metrics |
|---|---|---|
| Sales-Led | Pipeline velocity, CAC, Marketing-sourced pipeline % | SQL volume, meeting rate |
| Product-Led (PLG) | Activation rate, LTV:CAC, Free-to-paid conversion | Trial signups, feature adoption |
| ABM | Target account engagement, Deal velocity, Pipeline per account | Account penetration, multi-thread depth |
Start with your company's top goal, translate it into a marketing objective, then assign one or two primary KPIs with a clear owner - marketing, sales, or RevOps. If nobody owns the KPI, nobody improves it.
Here's a concrete example: if your company goal is "grow pipeline 30% in H2," your marketing objective is "increase marketing-sourced pipeline," your primary KPI is marketing-sourced pipeline %, and the owner is demand gen. That chain of logic is what makes a KPI defensible in a leadership meeting rather than just another number on a slide.
Pipeline velocity depends on reaching real buyers with verified contact data. Prospeo delivers 98% email accuracy and 125M+ verified mobiles on a 7-day refresh cycle - so your marketing-sourced pipeline % reflects actual conversations, not bounced emails.
Stop inflating pipeline with bad data. Start with contacts that connect.
The 7 KPIs: Formulas and Benchmarks
Pipeline Velocity
Formula: (# qualified opps x avg deal size x win rate) / sales cycle length
This is the single most important KPI for revenue teams because it captures four variables in one number. The average B2B SaaS sales cycle now runs 134 days, up from 107 in early 2022. That increase means pipeline velocity has slowed even for teams generating the same volume. Watch for sales cycle creep - it's the silent killer of quarterly targets.
Customer Acquisition Cost (by Channel)
Don't track a blended CAC. Break it down by channel and segment. SMB runs $100-$400, mid-market $400-$800, enterprise $800+. Organic CAC averages $942 versus $1,907 for paid, based on a 2019-2023 dataset from 140+ B2B companies.
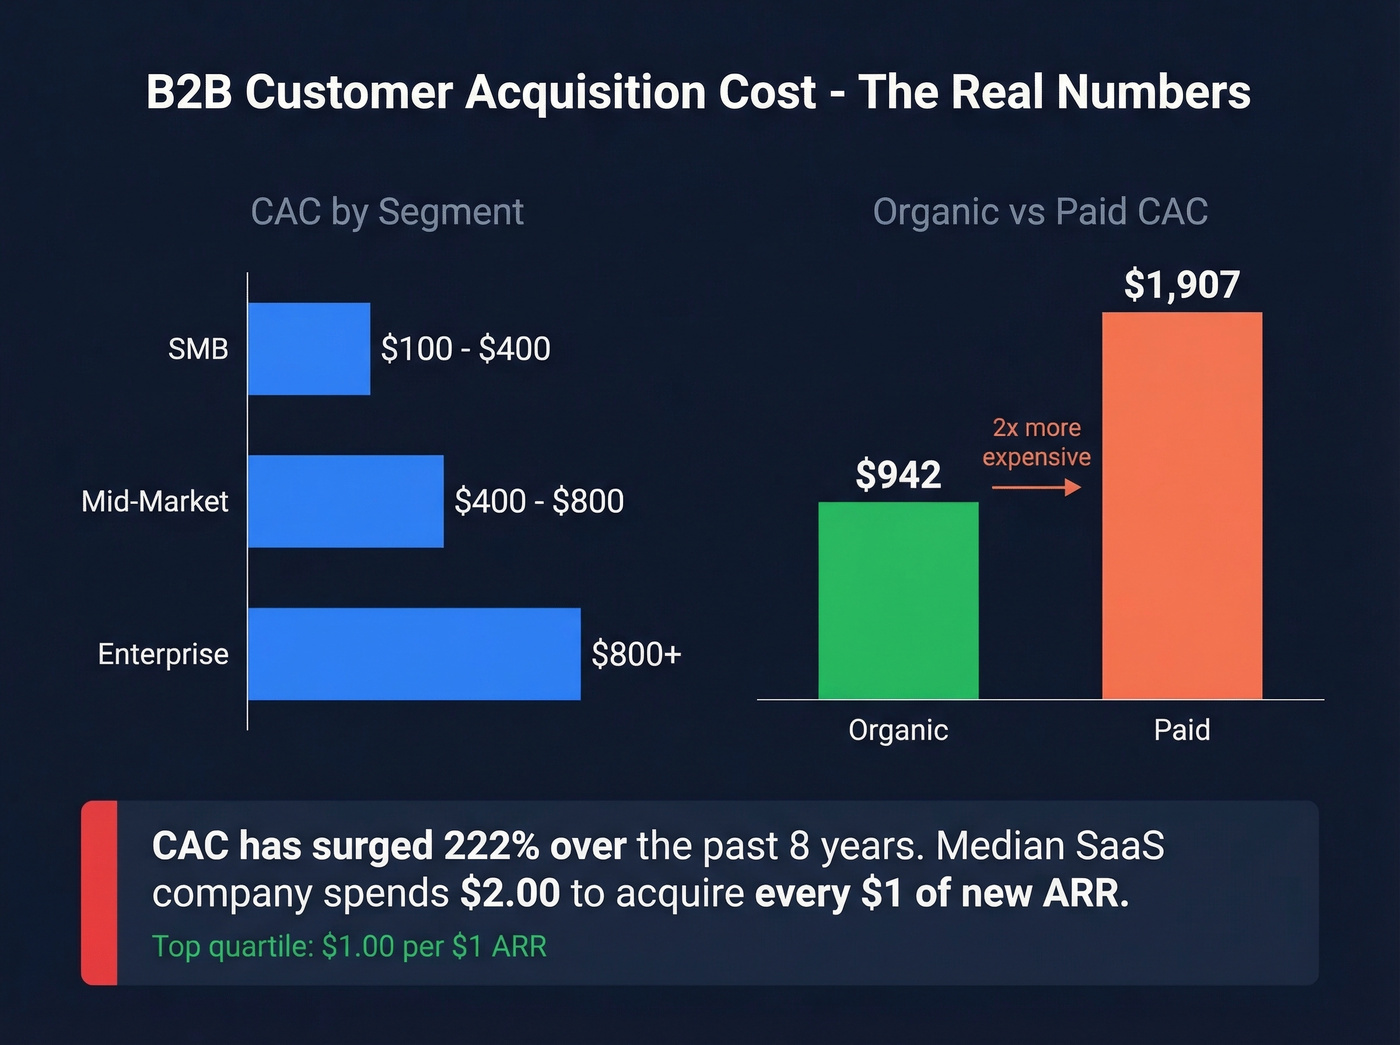
Here's the number that should worry you: CAC has increased 40-60% since 2023, and it's surged 222% over the past eight years. The median SaaS company spends $2.00 to acquire every $1 of new ARR. Top quartile companies do it for $1.00. If you're above $2.00, you've got a channel allocation problem, a conversion problem, or both.
Look - if your average deal size sits below $15k, you probably can't afford a $1,900 paid CAC. Go organic-heavy or go broke.
Lead-to-Customer Conversion Rate
Two benchmarks to know: visitor-to-lead conversion averages 2.2%, and lead-to-win averages 3.7% across 140+ B2B companies. If your visitor-to-lead rate is healthy but lead-to-win is tanking, the problem isn't demand gen - it's qualification or sales handoff. This KPI pinpoints where the funnel breaks.
Marketing-Sourced Pipeline (%)
This replaces MQL volume as the metric that matters. The consensus on r/b2bmarketing is blunt: MQLs measure activity, not buying intent. Sales teams consistently say MQLs are garbage because they're optimized for form fills, not revenue. Enterprise teams especially see "more leads in pipeline" looking good on paper while sales complains about quality.
Marketing-sourced pipeline percentage ties directly to dollars in the funnel. It's harder to game and impossible to argue with.
LTV:CAC Ratio
Minimum viable ratio is 3:1. Target 4:1 to 7:1. Below 3:1, you're spending more to acquire customers than they're worth.
The payback period for organic channels runs 6-9 months, which is why organic-heavy strategies look expensive in Q1 but dominate by Q4. Watch out for teams that inflate LTV with optimistic retention assumptions - use actual cohort data, not projections. We've seen companies report a 5:1 ratio that collapses to 1.8:1 when you swap in real churn numbers. Don't be that team.
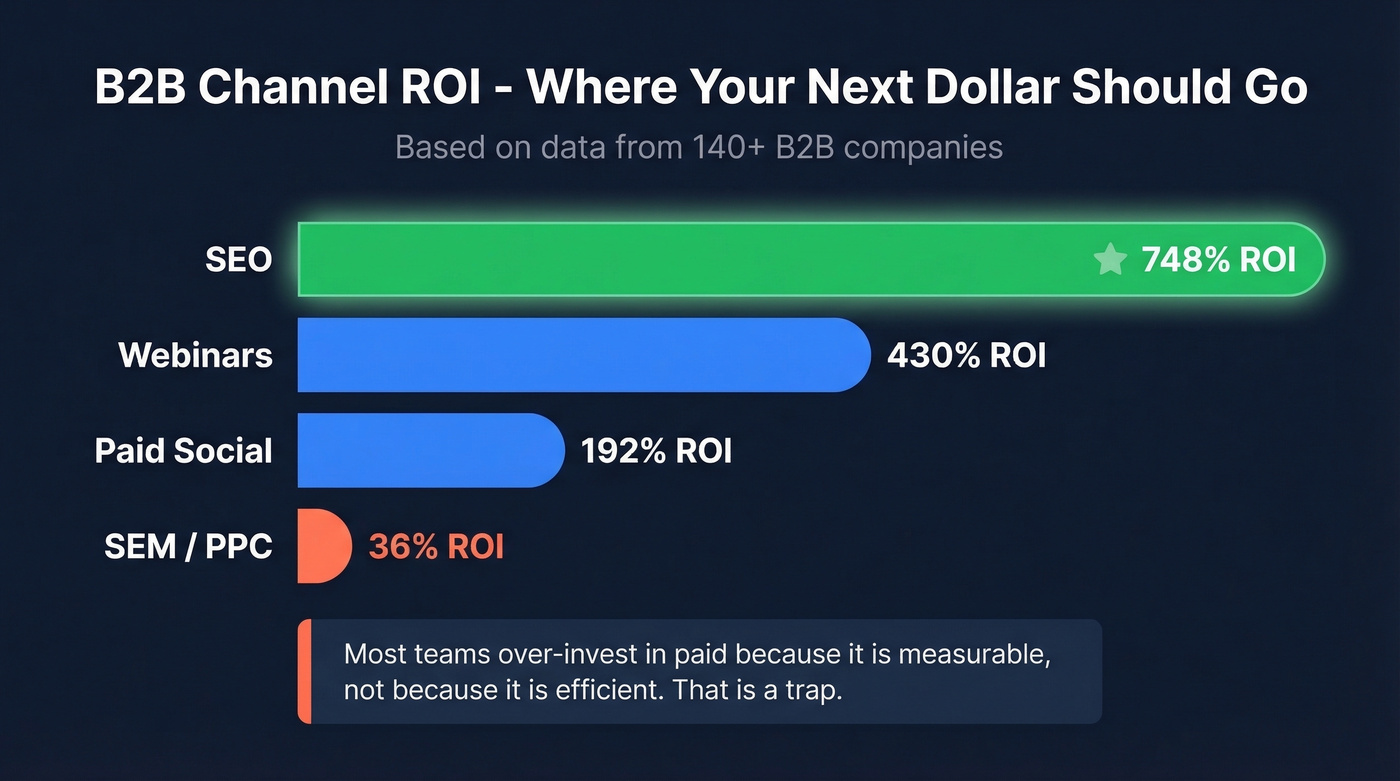
Channel ROI
The benchmarks here are striking. Across 140+ B2B companies: SEO delivers 748% ROI, webinars 430%, paid social 192%, and SEM/PPC just 36%. That doesn't mean kill PPC - it means you should know exactly what each channel returns and allocate accordingly. Most teams over-invest in paid because it's measurable, not because it's efficient. That's a trap.
Email Engagement (CTR, Not Opens)
Apple Mail Privacy Protection made open rates unreliable starting with iOS 15 in late 2021, and by 2026 the data is fiction for any list with significant Apple Mail users. CTR benchmarks sit around 4.0% for B2B email. But even CTR is a proxy - the real signals are reply rate and downstream conversion.
If you're still reporting open rates to leadership, stop. You're reporting noise.
2026 B2B Marketing Benchmarks
Bookmark this table. Every benchmark below reflects pre-2024 baselines - given the 40-60% CAC inflation since 2023, expect acquisition-related figures to run meaningfully higher in 2026.
| KPI | Benchmark | Context |
|---|---|---|
| CAC (SMB) | $100-$400 | Segment-specific |
| CAC (Mid-market) | $400-$800 | Longer evaluation cycles |
| CAC (Enterprise) | $800+ | Multi-stakeholder deals |
| CAC (Organic) | $942 | vs. $1,907 paid |
| CPL (Organic) | $327 | vs. $458 paid |
| Visitor to Lead | 2.2% | 140+ B2B companies |
| Lead to Win | 3.7% | Same dataset |
| LTV:CAC | 4:1 target | Minimum 3:1 |
| CAC Ratio | $2.00 per $1 ARR | Top quartile: $1.00 |
| Sales Cycle | 134 days | Up from 107 in 2022 |
| SEO ROI | 748% | vs. PPC 36% |
| Paid Social ROI | 192% | - |
| Webinar ROI | 430% | - |
| Email CTR | 4.0% | Opens unreliable post-Apple MPP |
What to Stop Tracking
Follower count, raw page views, impressions, and raw MQL count look good in a slide deck and mean nothing to your CEO. They're vanity metrics - easy to inflate, impossible to tie to revenue. Email open rates belong in this bucket now too.
The bigger anti-pattern isn't tracking the wrong things - it's tracking too many things. We've seen teams with 30+ indicators on a dashboard who can't defend five of them in a leadership meeting. Measurement should inform judgment, not replace it. If you can't explain why a metric is on your dashboard in one sentence, cut it. Review quarterly. Be ruthless.
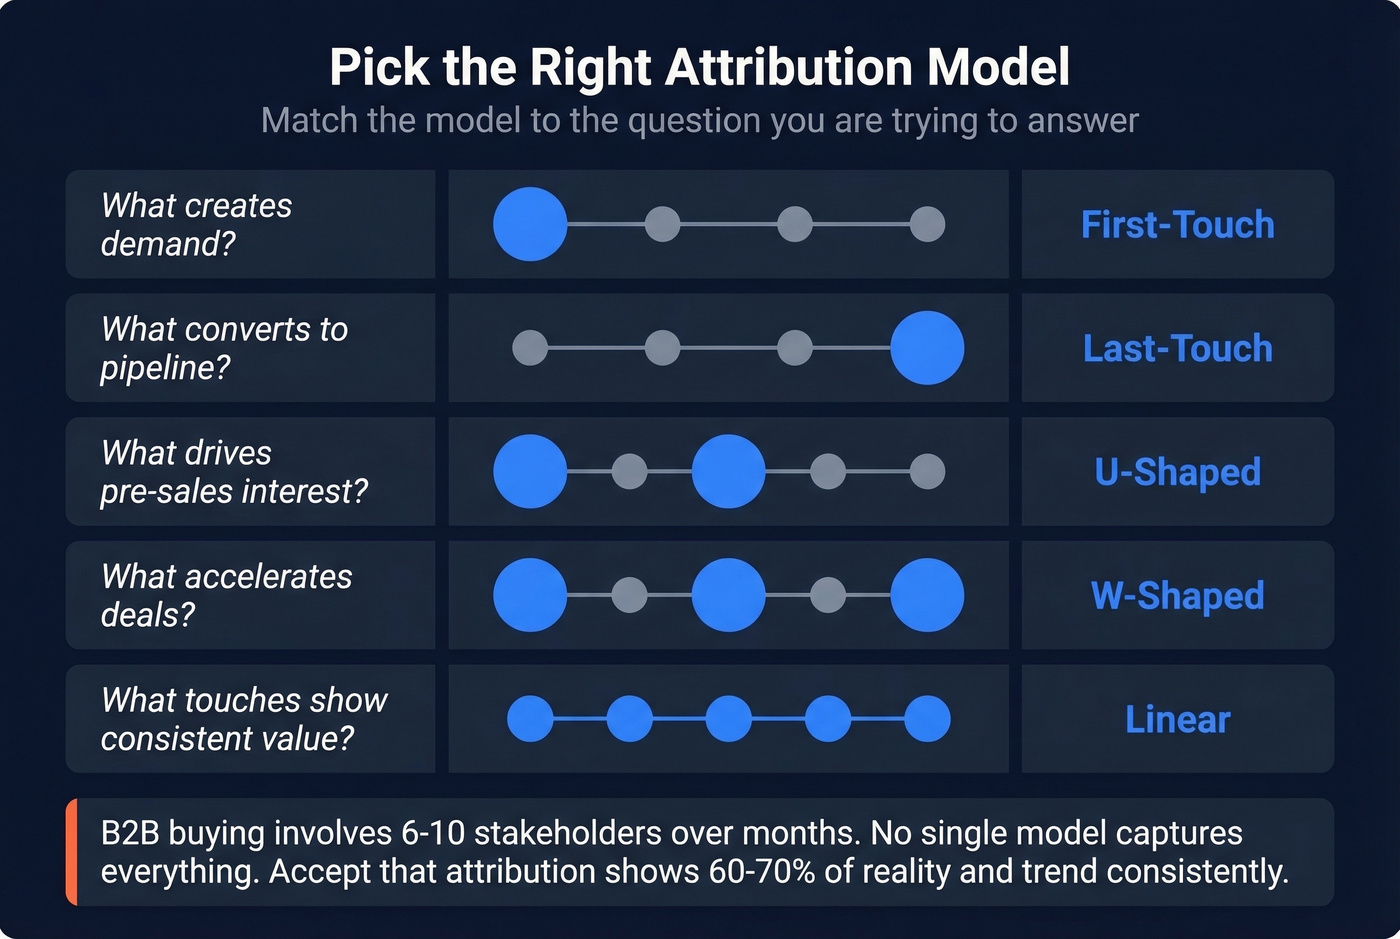
Attribution: Which Model Answers Which Question
Match the model to the business question you're trying to answer.
| Business Question | Attribution Model |
|---|---|
| What creates demand? | First-touch |
| What converts to pipeline? | Last-touch |
| What drives pre-sales interest? | U-shaped |
| What accelerates deals? | W-shaped |
| What touches show consistent value? | Linear |
B2B buying journeys involve 6-10 stakeholders over months. No single model captures everything. Chain-based attribution gives the fullest picture, but it requires 100+ closed-won deals to be statistically meaningful. If you don't have that volume, pick one model and trend it consistently across quarters. Consistency beats precision.
Let's be honest about the dark funnel: Slack communities, podcasts, hallway conversations - they're real and unmeasurable. Accept that your attribution model captures 60-70% of reality and make decisions accordingly. Chasing 100% attribution accuracy is a waste of time that could be spent improving the pipeline those touches feed.
Your KPIs Need Clean Data
Every formula in this article has a denominator. If that denominator is corrupted by bad contact data, every ratio is fiction. Bounced emails reduce deliverability and shrink the number of real people who ever see your outreach, which distorts CPL, conversion rates, and pipeline attribution. Stale records distort conversion rates. Duplicate contacts skew pipeline velocity calculations.
If you're diagnosing deliverability issues, start with email bounce rate and a proper email deliverability audit before you touch your dashboards.
Snyk's sales team was running a 35-40% email bounce rate before cleaning up their data infrastructure. After switching to Prospeo, that dropped to under 5%, and AE-sourced pipeline jumped 180% - generating 200+ new opportunities per month. The KPIs didn't change. The data feeding them did.

You can build the perfect KPI framework, nail your attribution model, and present beautiful dashboards - but if 30% of your emails bounce, none of those numbers mean anything. Skip the fancy dashboard project and fix your data first.
If you need a tighter measurement layer, align your reporting with core funnel metrics and the lead generation metrics that map to revenue.
CAC inflated 40-60% since 2023. One fix: stop paying $1/lead for stale data. Prospeo runs $0.01/email with 92% enrichment match rates - cutting acquisition costs while improving every conversion KPI downstream.
Cut your CAC by 90% without cutting corners on data quality.
FAQ
What's the difference between a KPI and a metric?
A KPI ties to a business goal and triggers a decision - if pipeline velocity drops, you change something. A metric provides context but doesn't demand action on its own. Track 5-7 KPIs; everything else is a supporting metric one layer deeper in your reporting.
How many B2B marketing KPIs should a team track?
Five to seven primary KPIs with clear owners. If you can't explain why each one matters to your CEO in one sentence, cut it. Supporting metrics can number in the dozens, but they stay in the operator dashboard, not the board deck.
Are MQLs still a useful KPI in 2026?
As a standalone KPI, no. MQLs measure engagement activity, not buying intent, and they're the top source of sales-marketing misalignment. Use marketing-sourced pipeline percentage instead - it ties directly to revenue and eliminates the "sales says leads are garbage" argument.
How does data quality affect marketing KPIs?
Directly and significantly. If 35% of your emails bounce, deliverability collapses, conversion rates get distorted, and pipeline attribution becomes noise. Snyk cut bounce rates from 35-40% to under 5% after fixing their data infrastructure and saw pipeline jump 180%.
How often should I review my KPI dashboard?
Weekly for operator-level channel metrics like CTR and CPL. Monthly for leadership reporting on pipeline, CAC, and revenue contribution. Quarterly for a full audit where you ask whether each metric still earns its spot.