CAC in Sales: The Complete Guide for Revenue Teams
Your CFO just pinged you about the quarterly board deck. CAC went up 40%, and nobody in the room can explain why. The real problem isn't that acquisition costs are rising - it's that nearly 70% of SaaS businesses miscalculate CAC in the first place. You can't fix a number you're measuring wrong.
The Short Version
- The real formula isn't just "marketing spend / new customers." Fully-loaded CAC includes SDR/AE comp, tooling, training, overhead, and every dollar that touches the acquisition motion.
- Where your number should land (2026 data): the average startup CAC is $225; B2B SaaS averages $656; enterprise fintech runs $14,772. Your benchmark depends on deal size and segment, not a single industry average.
- The highest-leverage fix most teams miss: it's not cutting budget - it's fixing data quality. Every bounced email and disconnected call is acquisition spend with zero return.
What Is CAC in Sales?
Customer acquisition cost is the total cost of converting a stranger into a paying customer. Not a lead. Not a trial signup. Not an MQL. A customer who's signed a contract and is generating revenue.
This distinction matters more than most teams realize. As Andrew Chen explains, CAC and CPA aren't the same thing. CPA can mean cost per lead, cost per trial, cost per app install - whatever "acquisition" event you define. CAC specifically measures the cost to acquire a paying customer. In sales contexts, always use CAC.
Here's where a lot of popular calculators get it wrong: they define "cost of sales" as production costs, shipping, or COGS. That's not what sales-led CAC measures. When we talk about sales acquisition cost, we mean the sales organization's costs - SDR and AE salaries, commissions, tools, enablement, travel. Not the cost of manufacturing or delivering your product. If you're using a calculator that lumps in COGS, your number is meaningless for sales planning.
The CAC Formula Explained
The Basic Calculation
CAC = (Total Sales Costs + Total Marketing Costs) / New Customers Acquired
Say your sales team costs $180,000/quarter in salaries, commissions, and tools. Marketing spends $120,000/quarter on ads, content, events, and software. You close 60 new customers.
CAC = ($180,000 + $120,000) / 60 = $5,000 per customer
Simple math. The hard part is knowing what goes into the numerator.
Fully-Loaded Cost Checklist
Most teams undercount. Here's what actually belongs in your calculation, based on Amplitude's cost framework:
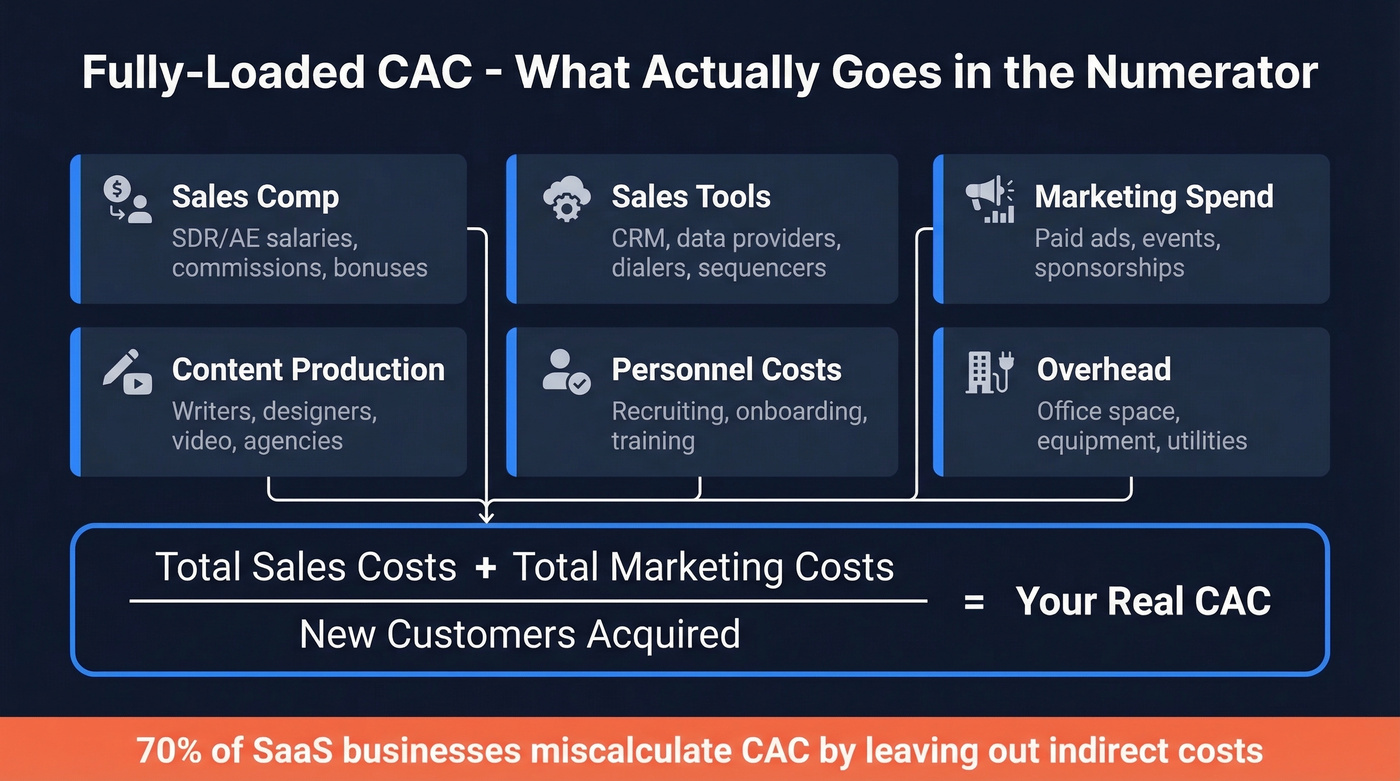
| Category | What to Include |
|---|---|
| Sales comp | SDR/AE salaries, commissions, bonuses |
| Sales tools | CRM ($50-300/user/mo), data providers, dialers, sequencers |
| Marketing spend | Paid ads, events, sponsorships |
| Content | Writers, designers, video, agency fees |
| Personnel | Recruiting, onboarding, training for sales/marketing hires |
| Overhead | Allocated office, equipment, utilities |
The "sales tools" line deserves a closer look. Data providers alone range from free tiers to $15,000-$40,000+/year for legacy platforms, depending on seats and modules. Prospeo's credit-based model works out to roughly $0.01 per verified email - a fraction of legacy costs that adds up fast across a 10-person SDR team. Choosing the right tools is one of the fastest ways to reduce acquisition cost without sacrificing pipeline quality.
Calculating CAC Without Mistakes
Timing Misalignment
This is the mistake that silently wrecks most calculations. If your average sales cycle is 90 days, dividing January's spend by January's closed deals is nonsensical - those January deals were sourced in October. Align spend with the conversion window, not the calendar month. In our experience, quarterly measurement is the minimum useful cadence for enterprise sales teams with 60+ day cycles.
Blended vs. Segmented CAC
A single blended number is comfortable and completely useless.
It hides the fact that your paid search channel might acquire customers at $800 while your outbound motion costs $3,500. Segment by channel, campaign, persona, and region. Tying acquisition cost to your ICP is especially important - you need to know whether your best-fit accounts cost more or less to close than your average. The channel bleeding money won't reveal itself in an average.

Paid search CAC tends to run materially higher than organic inbound, while outbound email costs vary wildly based on data quality and rep efficiency. Tracking cost per opportunity at the channel level reveals which sources generate real pipeline versus vanity metrics. Skip this step and you're flying blind.
Bookings vs. Revenue
Confusing bookings with recognized revenue is another common distortion. If you close a $120,000 annual contract in March, that's $120K in bookings but only $10K in recognized revenue for the month. Using bookings inflates your efficiency metrics. Pick one and be consistent.
Leaving Out Indirect Costs
That 70% miscalculation stat? It mostly comes from teams excluding overhead, training, and tooling costs. If you hired two SDRs last quarter and spent $15,000 on recruiting and onboarding, that's acquisition cost. If your sales enablement team spent 200 hours building playbooks for a new segment, that's acquisition cost. If it touches the new-customer motion, it belongs in the numerator.
PLG vs. Sales-Led CAC
Let's be honest: if your average contract value sits below $10K, you probably don't need a sales-led acquisition motion at all. Product-led growth companies typically see 40-60% lower CAC than sales-led companies because self-serve conversion eliminates SDR comp, demo overhead, and most of the sales tooling stack. But PLG captures lower ACV. Sales-led motions justify their higher cost by landing $50K-$500K contracts that self-serve can't close. The right model depends on your deal size, not a philosophical preference.
You just read that sales tools are one of the fastest CAC levers. Legacy data providers charge $15K-$40K/year and still deliver 20-35% bounce rates - that's acquisition spend with zero return. Prospeo gives your SDR team 98% verified emails at $0.01 each, cutting your tooling line item by up to 90% while improving pipeline quality.
Stop paying enterprise prices for data that bounces.
Benchmarks by Industry (2026)
Broad Startup Benchmarks
These numbers give you a starting point, but they're averages across very different business models:
| Segment | Average CAC |
|---|---|
| All startups | $225 |
| B2B SaaS | $656 |
| Growth-stage B2B SaaS | ~$1,200 |
| eCommerce | $10-$50 |
| Enterprise fintech | $14,772 |
The spread is enormous. Enterprise fintech CAC is roughly 295x higher than eCommerce - which is why benchmarking against "the average startup" is almost meaningless. Growth-stage B2B SaaS companies average closer to $1,200 per customer as they scale sales teams, bridging the gap between the early-stage average and enterprise numbers.
B2B SaaS by Subindustry and Deal Size
This is where benchmarks get useful. First Page Sage's report, covering client data from 2019-2024, remains the most granular public benchmark available:
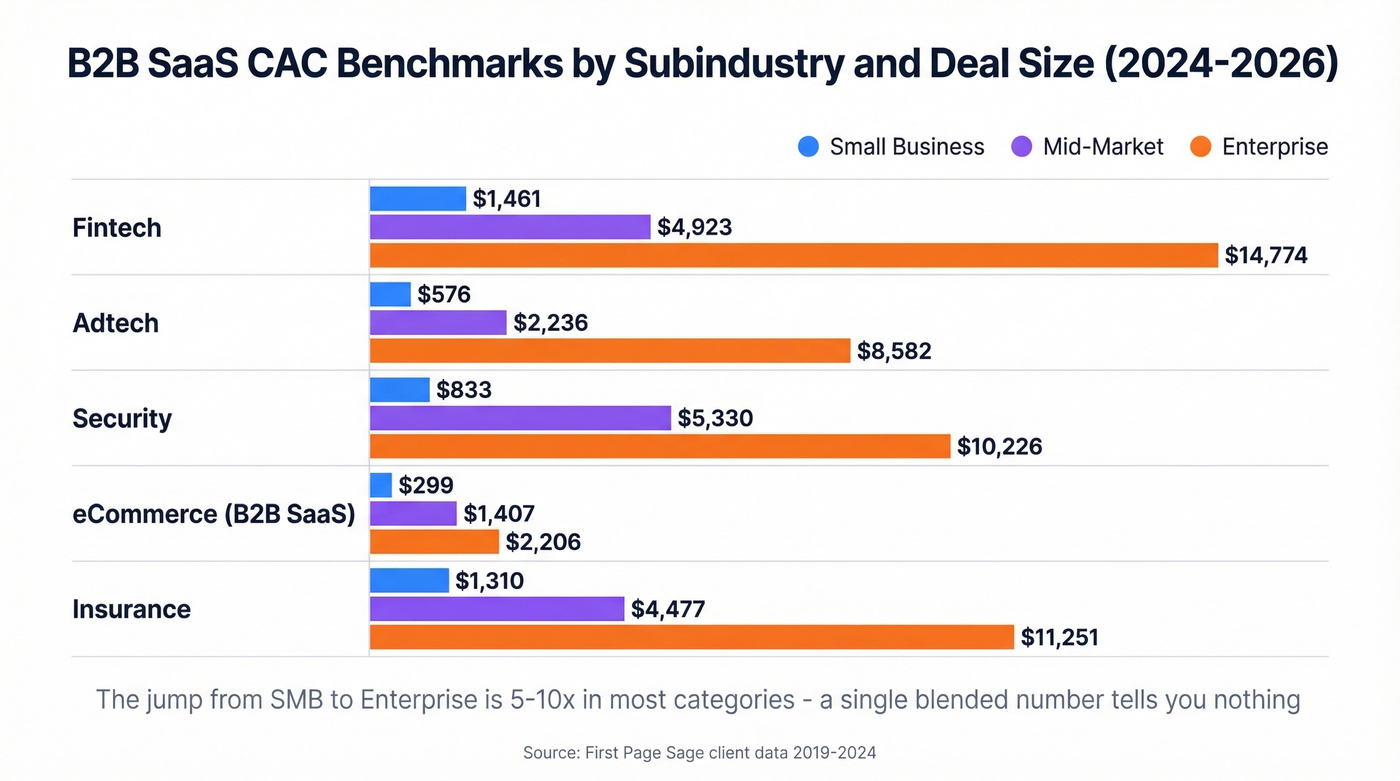
| Subindustry | Small Business | Mid-Market | Enterprise |
|---|---|---|---|
| Fintech | $1,461 | $4,923 | $14,774 |
| Adtech | $576 | $2,236 | $8,582 |
| Security | $833 | $5,330 | $10,226 |
| eCommerce (B2B SaaS) | $299 | $1,407 | $2,206 |
| Insurance | $1,310 | $4,477 | $11,251 |
The jump from SMB to enterprise is 5-10x in most categories. If you're running a single blended number across all segments, you're averaging a $299 eCommerce deal with a $14,774 fintech enterprise deal. That number tells you nothing.
CAC Payback Period - The Metric That Matters More
CAC payback period measures how many months it takes to recoup the cost of acquiring a customer:
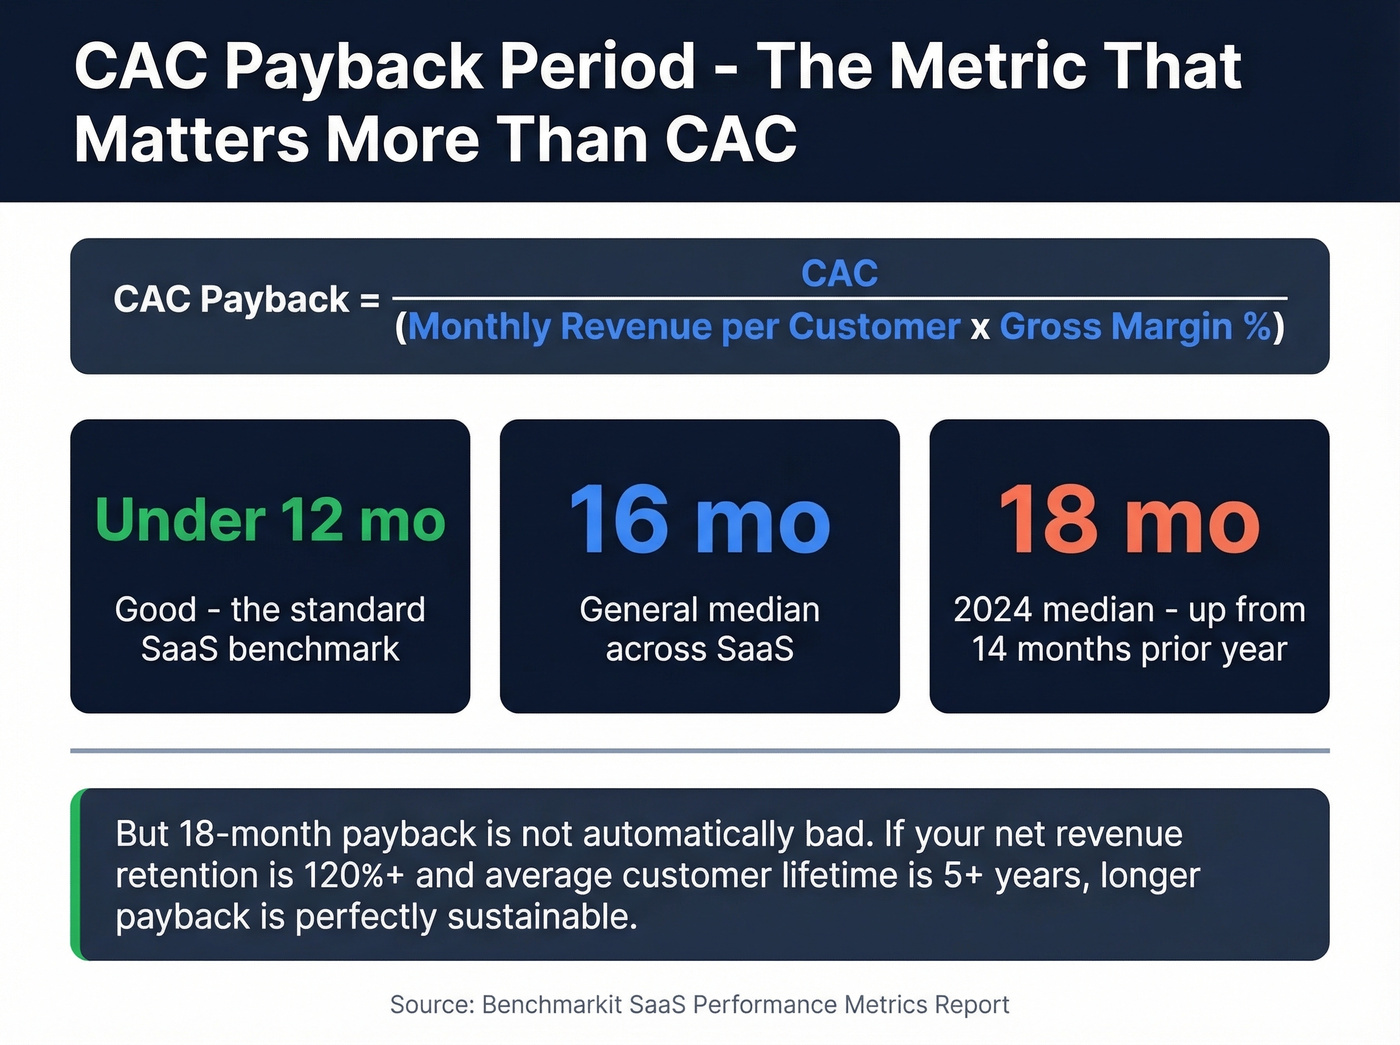
CAC Payback = CAC / (Monthly Revenue per Customer x Gross Margin %)
The general median hovers around 16 months, though the Benchmarkit SaaS Performance Metrics Report pegged it at 18 months for 2024 - up from 14 months the prior year. Under 12 months is the standard "good" benchmark for SaaS.
Here's the thing: 18-month payback isn't automatically bad. If your net revenue retention is 120%+ and average customer lifetime is 5+ years, an 18-month payback is perfectly sustainable. The consensus on r/SaaS reflects this tension - investors push for 12-month payback as a blanket rule, while operators argue it's irrational for low-churn businesses with long lifetimes. Context matters more than the rule of thumb.
LTV:CAC Ratio in Context
The standard target is 3:1 - for every dollar you spend acquiring a customer, you should generate three dollars in lifetime value. If your CAC is $5,000 and average customer LTV is $18,000, your ratio is 3.6:1. Healthy.
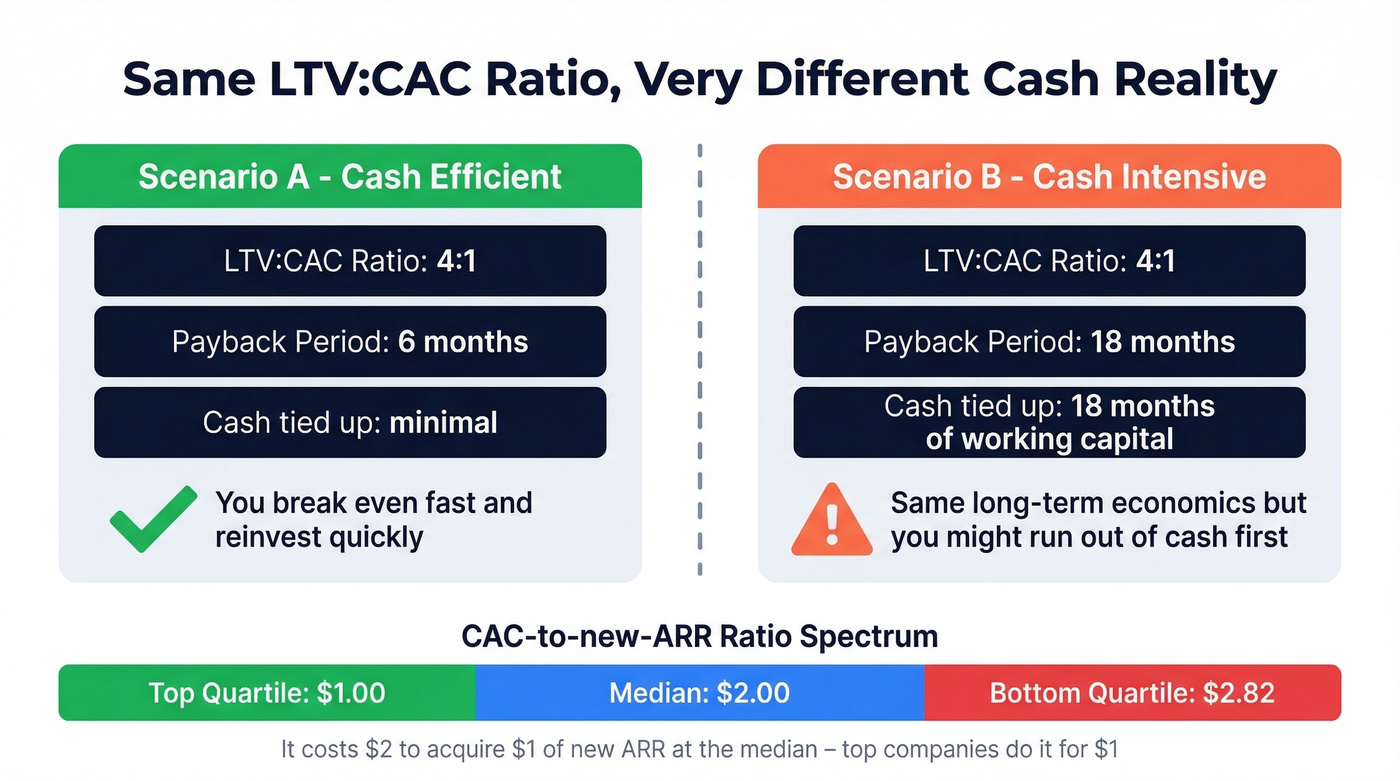
But the ratio alone is incomplete without payback context. A 4:1 LTV:CAC with a 6-month payback is a cash-efficient machine. A 4:1 ratio with an 18-month payback means you're tying up working capital for a year and a half before you break even - even though the long-term economics look identical on paper. As a quick example: a mid-market SaaS customer paying $2,000/month with a 36-month average lifetime and 80% gross margin has an LTV of $57,600, making a $14,000 CAC look very reasonable despite the sticker shock.
The median CAC-to-new-ARR ratio sits at $2.00, meaning it costs $2 to acquire $1 of new annual recurring revenue. Top-quartile companies spend $1.00; bottom-quartile companies spend $2.82. That spread tells you more about sales unit economics than any LTV:CAC ratio. On r/SaaS, you'll find plenty of founders with a 5:1 LTV:CAC who still ran out of cash because payback was 24 months and they couldn't fund the gap.
How Sales Teams Reduce CAC
Fix Data Quality First
Every bounced email is wasted spend. Every disconnected phone number is a rep minute that produced nothing. If your SDRs are spending 30% of their time chasing dead contacts, your effective acquisition cost is 30% higher than it needs to be.
If you're tightening your outbound motion, start with sales prospecting techniques that reduce wasted touches, then fix the underlying data.
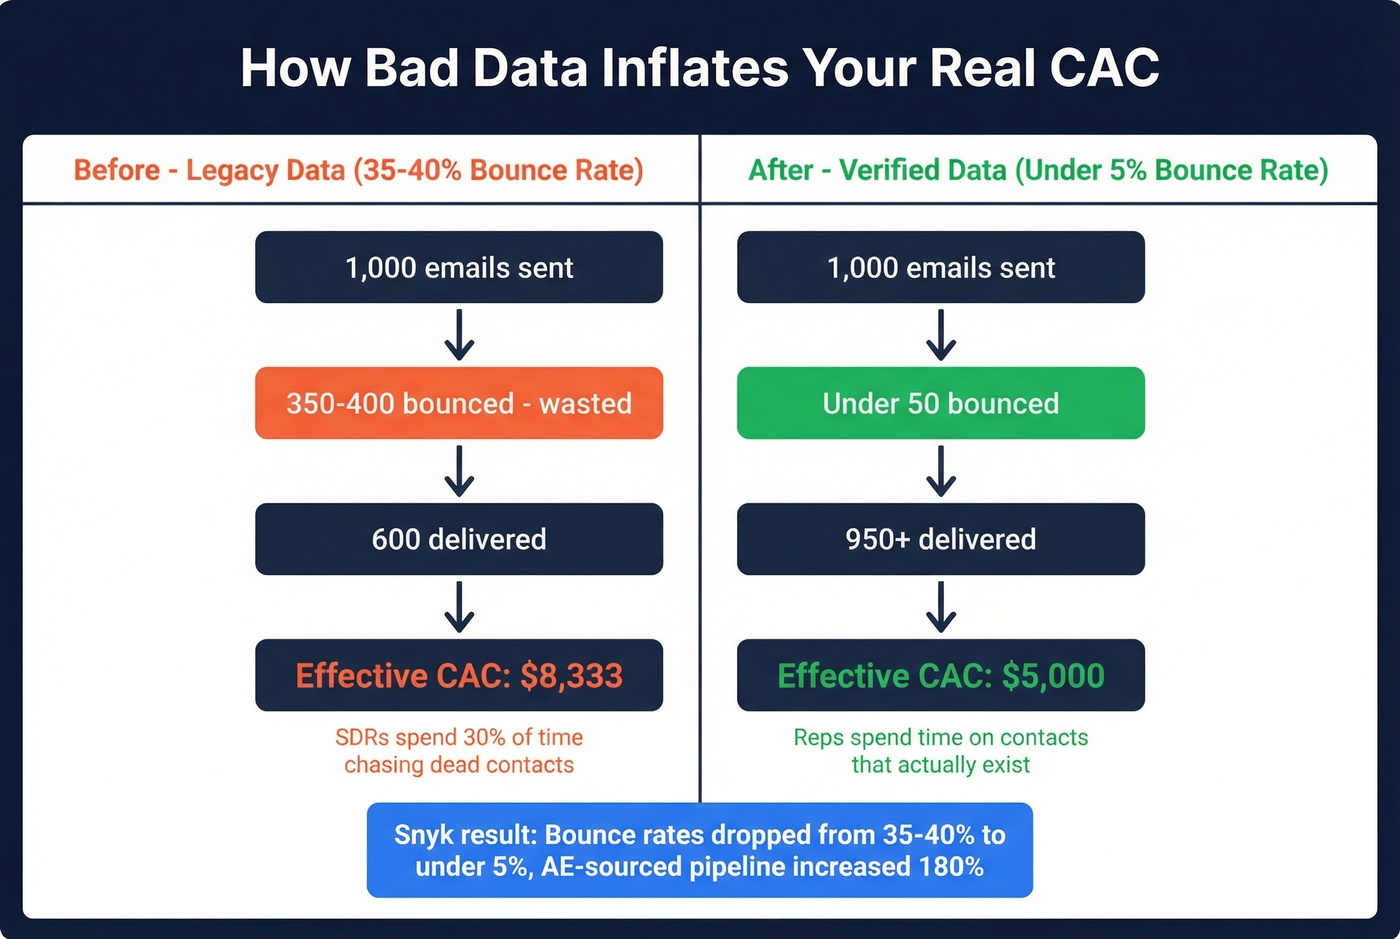
We've seen this play out firsthand. Snyk's 50-person AE team saw bounce rates drop from 35-40% to under 5% after switching to verified contact data, and AE-sourced pipeline increased 180%. That's not a marginal improvement - it's a permanent reduction in wasted acquisition spend. With 98% email accuracy and a 7-day data refresh cycle, reps spend their time on contacts that actually exist instead of calling someone who left the company six weeks ago.
Improve Conversion Rate Alongside CAC
Speed-to-lead is one of the most studied and most ignored metrics in sales. Responding to an inbound lead within 5 minutes makes you 10x more likely to close than waiting 30 minutes. Most teams know this. Most teams still respond far slower than they should.
If you're running paid acquisition and letting leads sit in a queue, you're paying full price for half the conversion rate. The fix isn't complicated - it's routing automation and alerts. The hard part is actually enforcing it.
When you do follow up, using proven sales follow-up templates helps keep response rates consistent.
Route Leads by Skill, Pre-Qualify with AI
Not every lead should go to the next available rep. One insurance company cut CPA by 30% by routing higher-complexity leads to seasoned agents instead of distributing round-robin. Skills-based routing isn't complicated to implement - most modern CRMs support it - but it requires you to actually tag leads by complexity and reps by competency.
Layer AI pre-qualification on top of that and the gains compound. AI bots can weed out roughly 70% of mismatched leads before a rep ever picks up the phone, with some teams reporting CPA reductions of 40% from this single change. The math is simple: if your SDRs spend 20 hours a week on calls and 14 of those hours go to unqualified contacts, you're paying SDR comp for 14 hours of zero-value activity. Let a bot handle the first filter, then route the survivors intelligently.
If you're evaluating tooling for this, start with a shortlist of SDR tools and generative AI sales tools.
Use CRM Segmentation to Cut Waste
We've seen teams run blended numbers for years without realizing their conference sponsorship channel costs 4x more per customer than outbound email. Stop averaging. Break costs down by channel quarterly, rank by efficiency, and reallocate budget from the bottom performers.
Your CRM already has the data to do this - most teams just never build the reports. Brands now lose $29 per new customer in wasted acquisition spend, up from $9 eight years ago - a 222% increase. Most of that waste is concentrated in one or two channels that nobody's bothered to measure independently.
If you're rebuilding reporting, it helps to align on sales operations metrics and basic funnel metrics first.
CAC Trends Heading Into 2026
Digital ad costs are up 5.13% market-wide. The median CAC-to-new-ARR ratio has climbed to $2.00. Payback periods have stretched from 14 to 18 months in a single year. And 75% of software companies reported declining retention rates in 2024, which means the denominator in your LTV:CAC ratio is shrinking while the numerator grows.

The direction is obvious: acquisition is getting more expensive. But here's the contrarian take - stop obsessing over reducing the headline number. Start obsessing over reducing wasted spend. The difference between a top-quartile company spending $1.00 to acquire $1 of ARR and a bottom-quartile company spending $2.82 isn't budget size. It's efficiency. Better data, faster follow-up, smarter routing, tighter segmentation. The companies winning on sales acquisition economics in 2026 aren't spending less - they're wasting less.
For teams looking to lower customer acquisition cost, the playbook is the same: eliminate the spend that produces zero pipeline before you touch the budget that's actually working.
Every disconnected dial and bounced email is CAC dollars wasted. Prospeo's 125M+ verified mobiles hit a 30% pickup rate - nearly 3x the industry average - and emails refresh every 7 days so your reps never work stale lists. Better connect rates mean fewer touches per closed deal and a materially lower fully-loaded CAC.
Fix your data quality and watch your CAC drop.
FAQ
What's the difference between CAC and CPA?
CAC measures the full cost of acquiring a paying customer - from first touch through closed deal - while CPA can refer to cost per lead, trial, or any defined conversion event. In sales, always use CAC because it captures the complete cost through to revenue. CPA is useful for marketing channel optimization but misleading for unit economics.
What's a good CAC for B2B SaaS?
SMB SaaS CAC averages $300-$800; mid-market runs $1,400-$5,000; enterprise lands at $8,000-$15,000+. Benchmark against your specific segment using First Page Sage's data. A "good" number also depends on your LTV:CAC ratio - $10,000 CAC is healthy if LTV exceeds $30,000.
How do you calculate CAC in sales?
Add all sales costs (SDR/AE comp, commissions, tools, training, overhead) plus marketing costs, then divide by new customers acquired in the same conversion window. Align the time period to your sales cycle length - not the calendar month. For 90-day cycles, quarterly calculation is the minimum useful cadence.
What's the fastest way to reduce wasted acquisition spend?
Fix your contact data. Bounced emails and disconnected numbers burn rep time with zero return. Verified email tools alongside proper CRM hygiene can cut wasted outreach by 30%+ immediately. After data, implement speed-to-lead automation and channel-level cost tracking.
Does CAC include existing customer expansion costs?
No. CAC measures new customer acquisition only. Expansion revenue costs like upsell, cross-sell, and account management should be tracked separately. Blending the two inflates your new-customer efficiency metrics and hides problems in both motions.