Cost Per Acquisition: 2026 Benchmarks, Formula & Optimization Guide
CAC jumped 40-60% between 2023 and 2025. If you're running paid campaigns or outbound and your cost per acquisition feels out of control, you're not imagining it - that's the reality across nearly every B2B channel right now, and the r/SaaS threads echo the same frustration.
The bigger issue? Most teams don't measure CPA correctly in the first place, which means they can't fix it.
The Quick Version
The formula: CPA = Total Campaign Cost / Total Conversions.
The distinction that matters: CPA is tactical (campaign-level). CAC is strategic (business-wide). Confusing them will wreck your planning.
Anchor benchmarks: The average Google Ads CPA runs about $31.75. Meta Ads CPA across ecommerce verticals averages $38.19. In B2B, CAC by channel can be far higher - outbound sales CAC hits $1,980 on average.
The macro picture: CAC rose 40-60% from 2023 to 2025, and the pressure hasn't let up heading into 2026.
The diagnostic shortcut: if your LTV:CPA ratio is below 3:1, you've got a problem. Below 2:1, stop scaling immediately.
What Is Cost Per Acquisition?
Cost per acquisition measures what you spend to generate one conversion from a specific campaign or channel. It's the most direct way to evaluate whether your marketing dollars produce results at a sustainable price.
The formula is straightforward:
CPA = Total Campaign Cost / Total Conversions
A worked example: you spend $10,000 on a Google Ads campaign that generates 200 demo requests. Your CPA is $50 per demo request. Simple enough - but the devil is in what you count as "total campaign cost" and what qualifies as a "conversion."
CPA operates at the campaign level. It tells you whether a specific initiative is efficient, not whether your business model works. That's CAC's job (and if you need the business-wide version, see cost to acquire customer).
CPA vs CAC vs CPL
These three metrics get conflated constantly on r/PPC, and the confusion leads to real budgeting mistakes. Google Ads doesn't help by labeling everything "cost per conversion," which could mean a lead, a sale, or a whitepaper download depending on your setup.
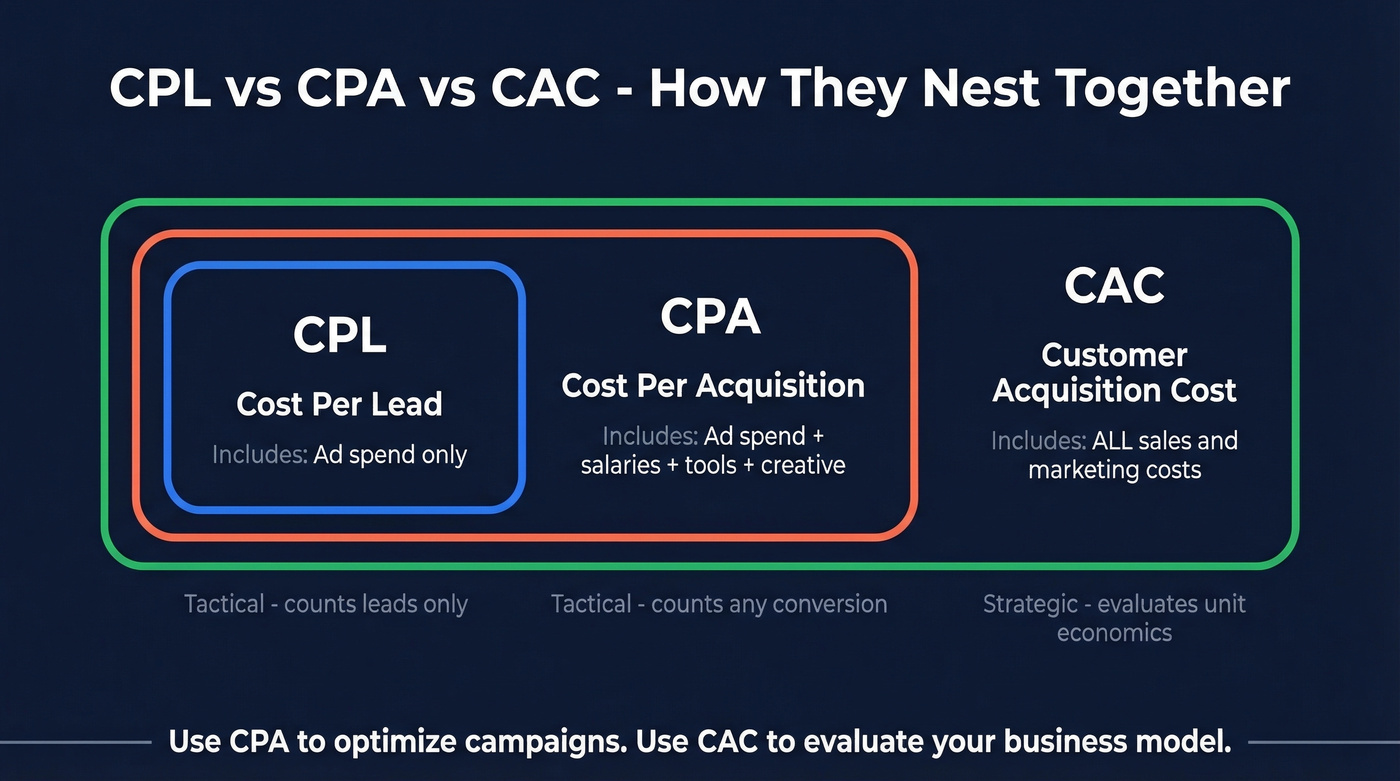
Here's how they nest together:
| Metric | What It Measures | Cost Inputs | Level |
|---|---|---|---|
| CPL | Cost per lead | Ad spend only | Tactical |
| CPA | Cost per conversion | Ad spend + salaries + tools + creative | Tactical |
| CAC | Cost per customer | All sales & marketing costs | Strategic |
CPL is a subset of CPA - it only counts leads. CPA covers any defined conversion action. CAC is the big-picture number that includes salaries, tools, events, and everything else it takes to turn a stranger into a paying customer.
The clean way to think about it: use CPA to optimize campaigns, use CAC to evaluate unit economics. They answer different questions, and mixing them up leads to bad budget decisions.
How to Calculate CPA Correctly
Most teams undercount their CPA. The formula looks simple, but the inputs are where things go wrong.
What actually belongs in "total campaign cost" goes well beyond media spend. You need to include ad spend (the obvious one), salaries for anyone touching the campaign - including fractional time from designers, copywriters, and SDRs - plus tool costs across your CRM, sequencer, data platform, and analytics stack (see sales operations metrics if you want a clean way to standardize this). Creative production like video, landing pages, and ad design counts too. If you're attributing leads from events and trade shows, those belong in the number.
Watch for Time-Lag Mismatch
If your sales cycle runs 60-90 days, matching this month's spend against this month's conversions produces garbage numbers. A SaaS company with a 3-month sales cycle will always look like it has terrible CPA when measured monthly, because the spend and the conversion don't land in the same window. We've seen teams make panic budget cuts based on monthly CPA that looked awful but was perfectly healthy on a quarterly basis.
Pick an Attribution Model and Stick With It
A last-click model will assign a completely different CPA to your Google Ads campaign than a linear or time-decay model will. Before you optimize anything, decide which attribution model reflects your actual buyer journey - then commit.
Blended CPA example: Say you run three channels - Google Ads ($5,000 spend, 50 conversions, $100 CPA), Meta Ads ($3,000 spend, 75 conversions, $40 CPA), and outbound ($7,000 fully loaded cost, 10 conversions, $700 CPA). Your blended CPA is $15,000 / 135 = $111. That blended number is what matters for budget planning, even though individual channel CPAs vary wildly.
That $700 outbound CPA in your blended example? Bad contact data is the biggest hidden driver. When 20-35% of emails bounce, you're paying for sends that never reach a human. Prospeo's 98% email accuracy and 7-day data refresh cycle eliminate wasted spend - at $0.01 per verified email.
Stop inflating your CPA with dead emails. Start with 75 free credits.
CPA Benchmarks for 2026
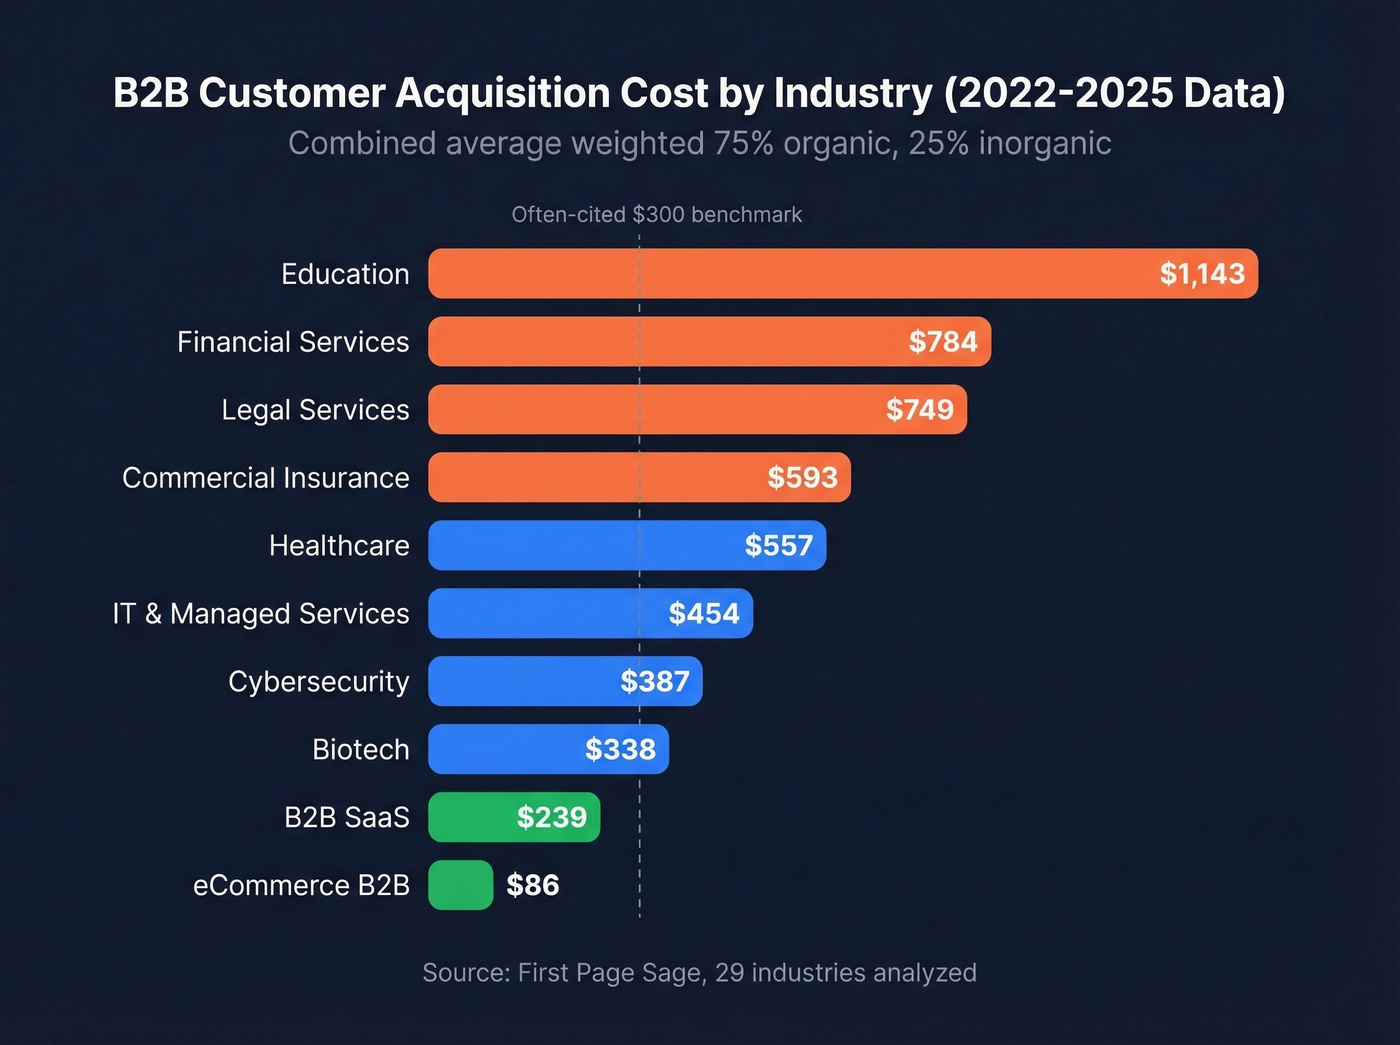
B2B CAC by Industry
First Page Sage published one of the most thorough B2B CAC datasets available, covering 29 industries from January 2022 through August 2025. One caveat: their combined average weights 75% organic / 25% inorganic, reflecting their client mix. Your ratio will differ.
| Industry | Organic CAC | Inorganic CAC | Combined |
|---|---|---|---|
| eCommerce (B2B) | $87 | $81 | $86 |
| B2B SaaS | $205 | $341 | $239 |
| IT & Managed Services | $325 | $840 | $454 |
| Cybersecurity | $345 | $512 | $387 |
| Commercial Insurance | $590 | $600 | $593 |
| Financial Services | $644 | $1,202 | $784 |
| Legal Services | $584 | $1,245 | $749 |
| Healthcare | $357 | $1,155 | $557 |
| Biotech | $284 | $498 | $338 |
| Education | $862 | $1,985 | $1,143 |
The spread is massive. eCommerce B2B runs $86 combined while Education hits $1,143. If someone tells you "a good CAC is $300," they're not wrong - they're just not specific enough to be useful. Your industry context is everything.
Google Ads CPA
The AgencyAnalytics benchmark puts average Google Ads CPA at $31.75. That's a useful anchor, but it's a blended number across all verticals and conversion types.
WordStream's analysis of 16,000+ campaigns adds more texture. CPC increased for 87% of industries, while cost per lead rose for 13 out of 23 industries tracked, averaging about 5% year-over-year. The average CTR hit 6.66%, up from 6.42% the prior year. Conversion rates improved for 65% of industries - clicks are getting more expensive, but they're converting slightly better. The net effect on CPA varies wildly by vertical.
For B2B specifically, expect Google Ads CPA to run $50-$150+ for a qualified lead, depending on your industry and how you define "conversion."
Meta Ads CPA by Vertical
Triple Whale's dataset covers nearly 35,000 brands, making it one of the largest Meta ecommerce benchmark sets available.
| Vertical | Median CPA |
|---|---|
| Lifestyle & Boutique | $29.99 |
| Baby | $30.04 |
| Books & Music | $30.25 |
| Home & Garden | $46.46 |
| Electronics | $49.48 |
| Overall Average | $38.19 |
Meta ecommerce CPA barely moved - $38.19 vs $37.80 the prior year. But CPM jumped 20% to $14.19, which means the flat CPA is masking real cost pressure. Conversion rates improved 8.3% to 1.6%, offsetting the rising CPMs. If your creative stops performing, that CPM increase will hit your acquisition costs hard.
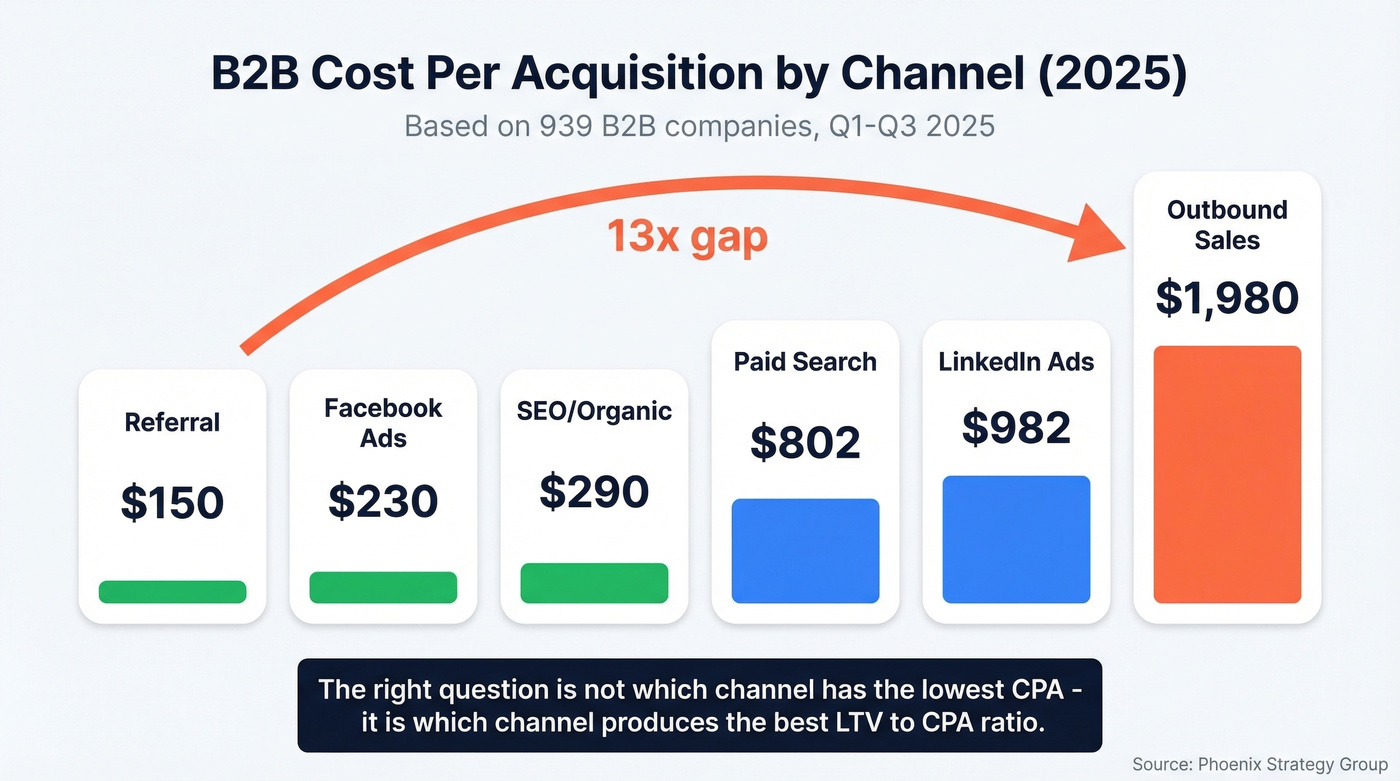
CPA by Channel
The Phoenix Strategy Group analyzed 939 B2B companies from Q1-Q3 2025 to produce channel-level CAC benchmarks. These numbers should drive your budget allocation conversations:
| Channel | Avg B2B CAC |
|---|---|
| Referral | $150 |
| Facebook Ads | $230 |
| SEO / Organic | $290 |
| Paid Search | $802 |
| LinkedIn Ads | $982 |
| Outbound Sales | $1,980 |
The gap between referral ($150) and outbound ($1,980) is over 13x. But outbound often produces higher-value deals with larger contract sizes, so raw CPA doesn't tell the full story. The right question isn't "which channel has the lowest CPA?" It's "which channel produces the best LTV:CPA ratio?"
That said, if your outbound acquisition cost is north of $2,000 and your average deal is $5,000, the math doesn't work. Period.
Why Your CPA Keeps Rising
This isn't a one-year blip. WordStream's 2024 benchmarks covering April 2023-March 2024 showed CPC rising for 86% of industries with cost per lead jumping ~25% year-over-year. Their 2025 data shows the trend continuing. Two years of compounding cost increases, and there's no sign of reversal heading into 2026.
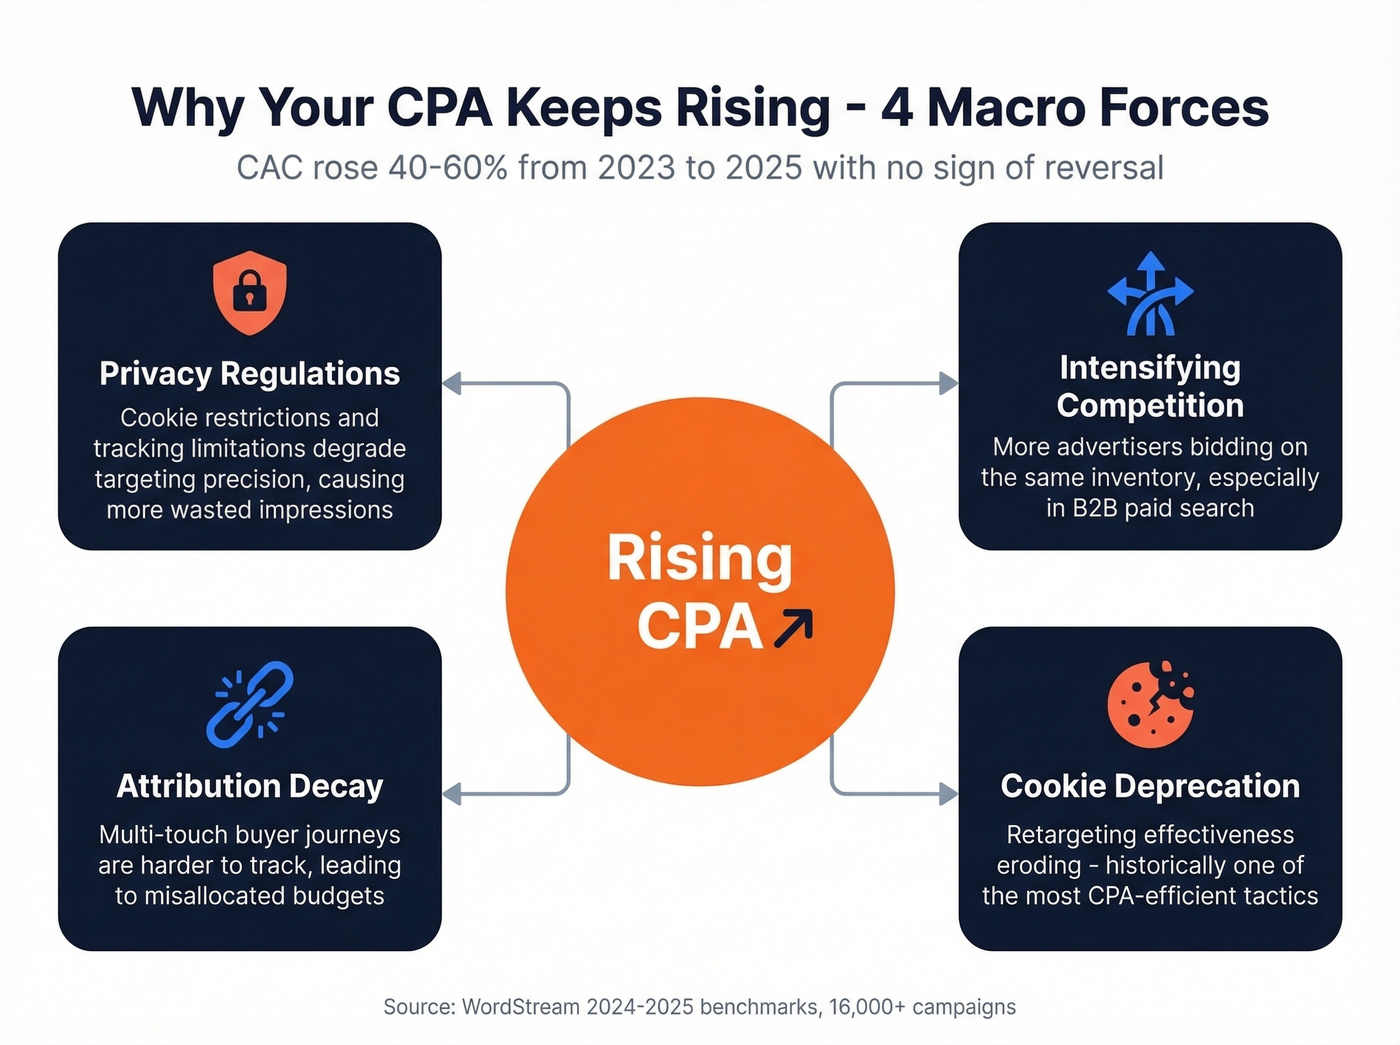
Four macro forces are driving this:
Privacy regulations are degrading targeting precision. Every cookie restriction and tracking limitation makes your audience segments less accurate, which means more wasted impressions and higher effective CPA.
Competition is intensifying. More advertisers are bidding on the same inventory, especially in B2B where every SaaS company discovered paid search simultaneously.
Attribution is decaying. Multi-touch buyer journeys are getting harder to track, so you can't accurately attribute conversions to the channels that drove them. Single-touch models overvalue last-click channels and undervalue top-of-funnel, leading to misallocated budgets.
Cookie deprecation continues to erode retargeting effectiveness, which historically was one of the most CPA-efficient tactics available.
Is Your CPA Too High?
Stop benchmarking your CPA against industry averages. Benchmark it against your own unit economics.
The LTV:CPA ratio is the only framework that actually answers the question:
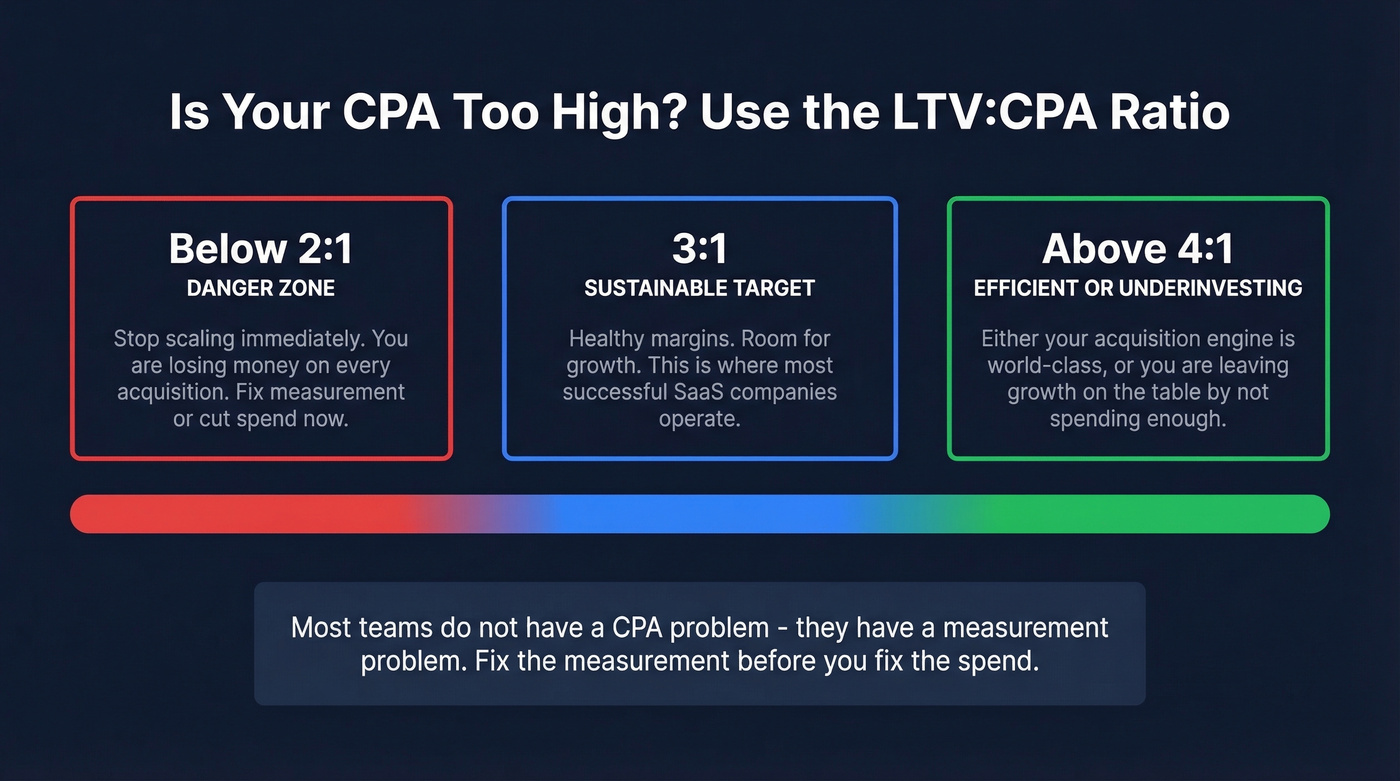
- Below 2:1 - Stop scaling. You're losing money on acquisition.
- 3:1 - The sustainable target. Healthy margins.
- Above 4:1 - Either you're extremely efficient, or you're under-investing in growth.
Here's the thing: most teams don't actually have a CPA problem - they have a measurement problem. We've seen teams panic about a "high" CPA that was perfectly fine once they included full customer lifetime value. And we've seen teams celebrate a "low" CPA that was only low because they forgot to include sales salaries in the calculation. Fix the measurement before you fix the spend.
How to Reduce Your CPA
Eight tactics, ranked by speed-to-impact:
1. Fix your outbound data quality. Bad contact data is a silent CPA killer. Every bounced email wastes send credits, every wrong number wastes rep time, and both inflate your acquisition costs without producing a single conversion. Prospeo's 98% email accuracy and 7-day data refresh cycle directly address this - one customer (Meritt) cut bounce rates from 35% to under 4% and tripled pipeline from $100K to $300K/week. At ~$0.01/email, one hour of wasted sales time costs more than verifying your entire outbound list (more on this in email bounce rate and email deliverability).
2. Improve landing page conversion rates. A 1% CVR improvement on a page getting 10,000 visits/month is 100 more conversions at zero additional ad spend. Test headlines and form length before touching your ad budget.
3. Tighten audience targeting. Use firmographic and intent signals to narrow targeting to accounts actually in-market. Fewer impressions, higher conversion rates, lower CPA.
4. Retarget warm audiences. People who've visited your pricing page or watched a demo video convert better than cold traffic. Skip this if your monthly traffic is under 5,000 - the retargeting pool will be too small to learn from.
5. A/B test ad creative relentlessly. Creative fatigue is real. Swap headlines, images, and CTAs on a regular cycle. The winning variant can cut CPA by 20-40%.
6. Adjust bidding strategy. Still running manual bids on Google Ads? Test target CPA or maximize conversions bidding. Automated bidding often outperforms manual management for mid-volume campaigns.
7. Pause underperforming campaigns. If a campaign is consistently above your target CPA, pause it or restructure it. Don't let losers drain budget from winners.
8. Diversify to lower-cost channels. For teams that are all-in on paid search with CAC averaging $802 in B2B, shifting budget to SEO ($290 CAC) or referral programs ($150 CAC) can meaningfully reduce blended CPA over 6-12 months. This isn't fast, but it's the highest-leverage move for long-term cost structure.
CAC rose 40-60% since 2023, but your data costs don't have to. Teams using Prospeo book 26% more meetings than ZoomInfo users and 35% more than Apollo - meaning more conversions from the same spend. That's a direct CPA reduction without touching your ad budget.
More conversions, same budget. That's how you fix cost per acquisition.
FAQ
What is a good cost per acquisition?
Aim for a minimum 3:1 LTV:CPA ratio - that's the benchmark that matters regardless of industry. For context, B2B SaaS averages $205-$341 CAC while ecommerce Meta CPA runs $29-$49 by vertical. A "good" CPA for a $50,000 ACV enterprise deal looks nothing like one for a $30 consumer product.
What is the CPA formula?
CPA equals total campaign cost divided by total conversions. The critical part is including all costs - ad spend, salaries, tools, creative production, and events - not just media budget. If you're calculating at the business level, sum every sales and marketing expense and divide by total new customers acquired in the same period.
What's the difference between CPA and CAC?
CPA is campaign-level and tactical - it measures the cost of a specific conversion action from a single initiative. CAC is business-wide and strategic, including all sales and marketing costs divided by total new customers. Use CPA to optimize campaigns, CAC to evaluate your business model.
Why is my CPA increasing in 2026?
CPC rose for 87% of industries in 2025, continuing a two-year trend into 2026. The drivers are increased ad competition, privacy regulations degrading targeting precision, attribution challenges across longer buyer journeys, and cookie deprecation reducing retargeting effectiveness.
How does data quality affect CPA?
Bad contact data wastes outreach budget on bounced emails and wrong numbers, inflating your CPA without generating conversions. Verified data ensures outbound spend reaches real prospects. One Prospeo customer (Meritt) cut bounce rates from 35% to under 4%, directly lowering their effective acquisition cost and tripling weekly pipeline.