The Cost Per Customer Formula: Calculate, Benchmark, and Reduce Your CAC
Your CFO just asked why customer acquisition cost went up 40% this year. You pulled the numbers, and honestly, you're not sure they're right. That's the problem with the cost per customer formula - most teams calculate it wrong, undercount meaningfully, and then make budget decisions on a number that's basically fiction.
A study of 939 B2B companies found CAC jumped 40-60% between 2023 and 2025, driven by rising ad costs, privacy changes, and attribution chaos. If your number went up, you're not alone.
The Short Version
- The basic formula: CAC = Total Sales & Marketing Costs / New Customers Acquired
- Many companies undercount by 30-50%. Use the fully-loaded variant - include salaries, tools, agency fees, and overhead. The basic version lies to you.
- "Good" CAC depends entirely on your industry. B2B SaaS averages $239, financial services averages $784, and real estate hits $791. Comparing your number to a generic benchmark without industry context is meaningless.
Now let's break down how to actually get this right.
How the CAC Formula Works
The formula itself is deceptively simple:
CAC = Total Sales & Marketing Costs / New Customers Acquired
Take everything you spent to acquire customers in a given period, divide by the number of new paying customers you closed in that same period. This acquisition formula is the foundation of every unit economics model, regardless of industry or company size.
Say your company spent $500,000 on sales and marketing last quarter - ad spend, SDR salaries, tooling, events, the works. You closed 1,000 new customers. Your CAC is $500.
Simple math. The hard part isn't the division - it's deciding what goes in the numerator. Most teams only count ad spend and call it a day, which gives you a number that looks great on a slide deck and means almost nothing in practice.
What to Include in Your CAC
This is where teams get it wrong. As one practitioner on r/SaaS put it, CAC is "mostly misunderstood" - and the misunderstanding almost always skews optimistic.
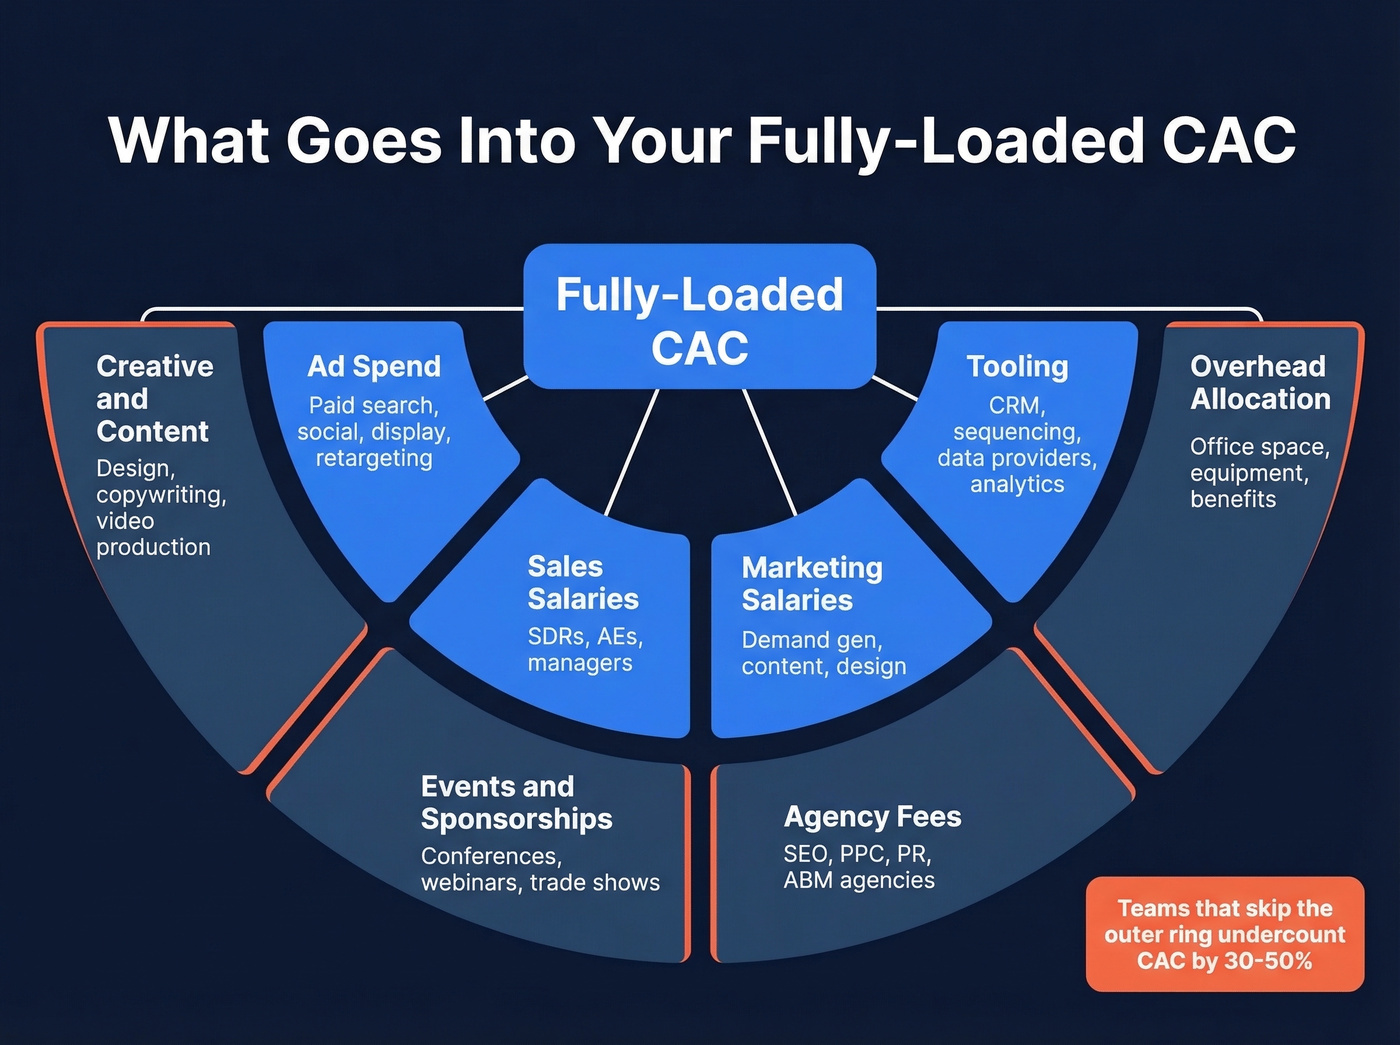
A fully-loaded CAC includes everything that touches customer acquisition. The obvious costs are ad spend across paid search, social, display, and retargeting, plus sales and marketing salaries for SDRs, AEs, demand gen, content marketers, and their managers. Then there's the tooling layer - CRM, sequencing software, data providers, analytics platforms - which adds up faster than most teams realize.
The costs people forget are the ones that blow up the gap between your reported CAC and reality:
- Creative and content production - design, copywriting, video
- Events and sponsorships - conferences, webinars, trade shows
- Agency fees - SEO, PPC, PR, ABM agencies
- Overhead allocation - office space, equipment, benefits tied to S&M headcount
Think about it concretely: $200K in SDR salaries, $50K in tooling, $30K in events - that's $280K before you've spent a dollar on ads. Leave those out and your CAC is a fantasy. We've audited companies that undercounted CAC by 40% simply because SDR salaries sat in a different budget line than "marketing."
CAC vs. CPA: Know the Difference
These get confused constantly. CPA measures the cost of any conversion action at the campaign level - a lead form fill, a demo request, a free trial signup. It tells you how a specific campaign performed.
CAC is a business-level metric. It captures the total cost of turning someone into a paying customer, across every touchpoint and cost center. CPA is tactical; CAC is strategic. When your board asks about unit economics, they want CAC.
5 CAC Variants and When to Use Each
A single CAC number is almost useless. You need at least two variants to make real decisions.
| Variant | Formula | Best For | Primary Audience |
|---|---|---|---|
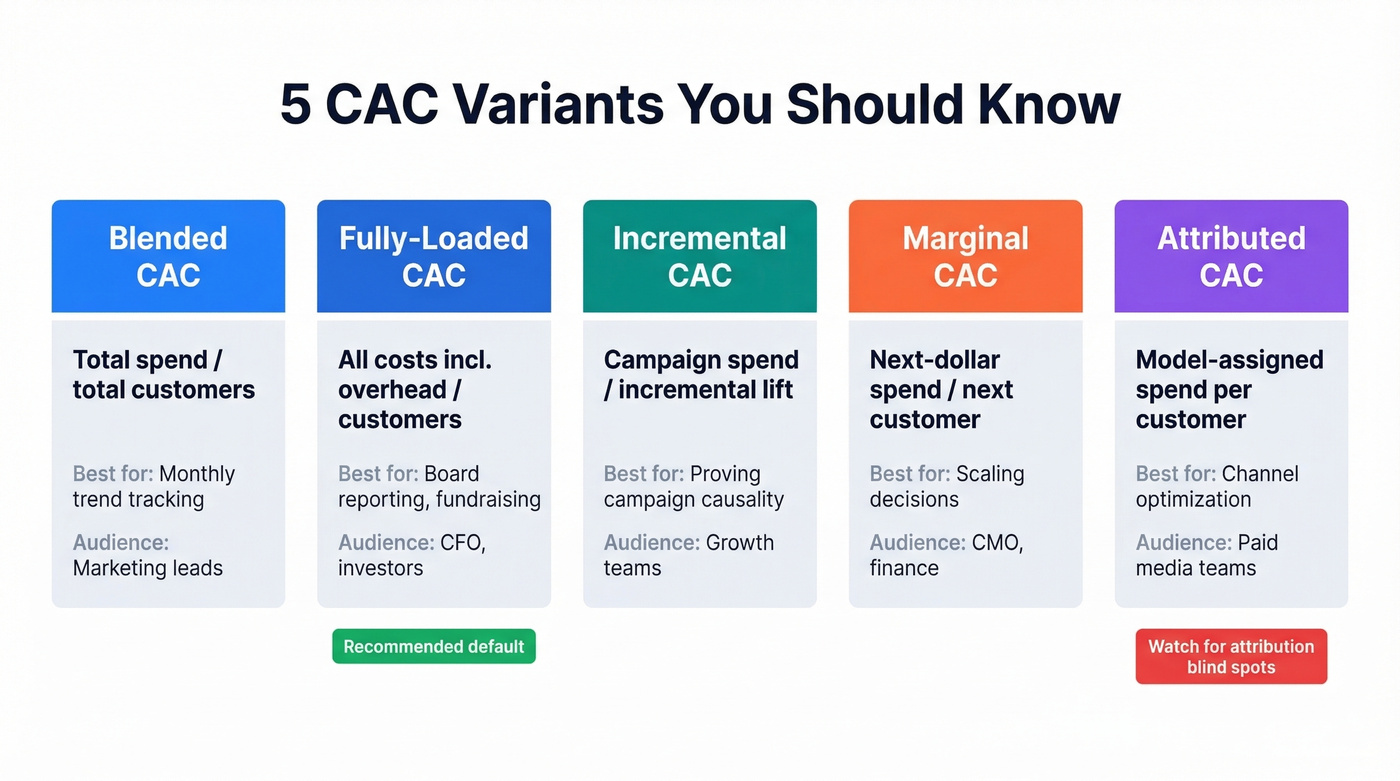
| Blended | Total spend / total customers | Monthly trend tracking | Marketing leads |
| Fully-loaded | All costs incl. overhead / customers | Board reporting, fundraising | CFO, investors |
| Incremental | Campaign spend / incremental lift | Proving campaign causality | Growth teams |
| Marginal | Next-dollar spend / next customer | Scaling decisions | CMO, finance |
| Attributed | Model-assigned spend per customer | Channel optimization | Paid media teams |
Blended CAC is the simplest - total marketing spend divided by total customers. No attribution assumptions, no allocation debates. It's deterministic and useful for spotting trends over time, but it can't tell you what's working.
Fully-loaded CAC is the honest number. It uses the total acquisition cost formula - direct spend plus indirect overhead like salaries, tools, legal, creative, and agencies - divided by new customers. This is what your board and investors actually care about, and it's the number you should default to. In our experience, teams that track fully-loaded CAC alongside one other variant make meaningfully better budget decisions than those relying on a single number.
Incremental CAC isolates the impact of a specific campaign by measuring only the incremental customers it generated. This requires lift tests or control groups, which makes it harder to calculate but far more useful for proving causality.
Marginal CAC answers the scaling question: what does the next customer cost? Stop spending when marginal CAC exceeds marginal LTV. If your 1,001st customer costs more to acquire than they'll ever be worth, you've hit the wall.
Attributed CAC uses platform or model attribution to assign costs per customer by channel. Great for tactical optimization, dangerous for total economics - attribution models always have blind spots.
Tooling costs are a hidden CAC driver most teams undercount. Prospeo replaces expensive data stacks at $0.01 per verified email - 90% cheaper than ZoomInfo - while delivering 98% accuracy that keeps bounce rates under 4%. Fewer bounces, less waste, lower fully-loaded CAC.
Cut the biggest line item in your CAC numerator today.
2026 CAC Benchmarks by Industry
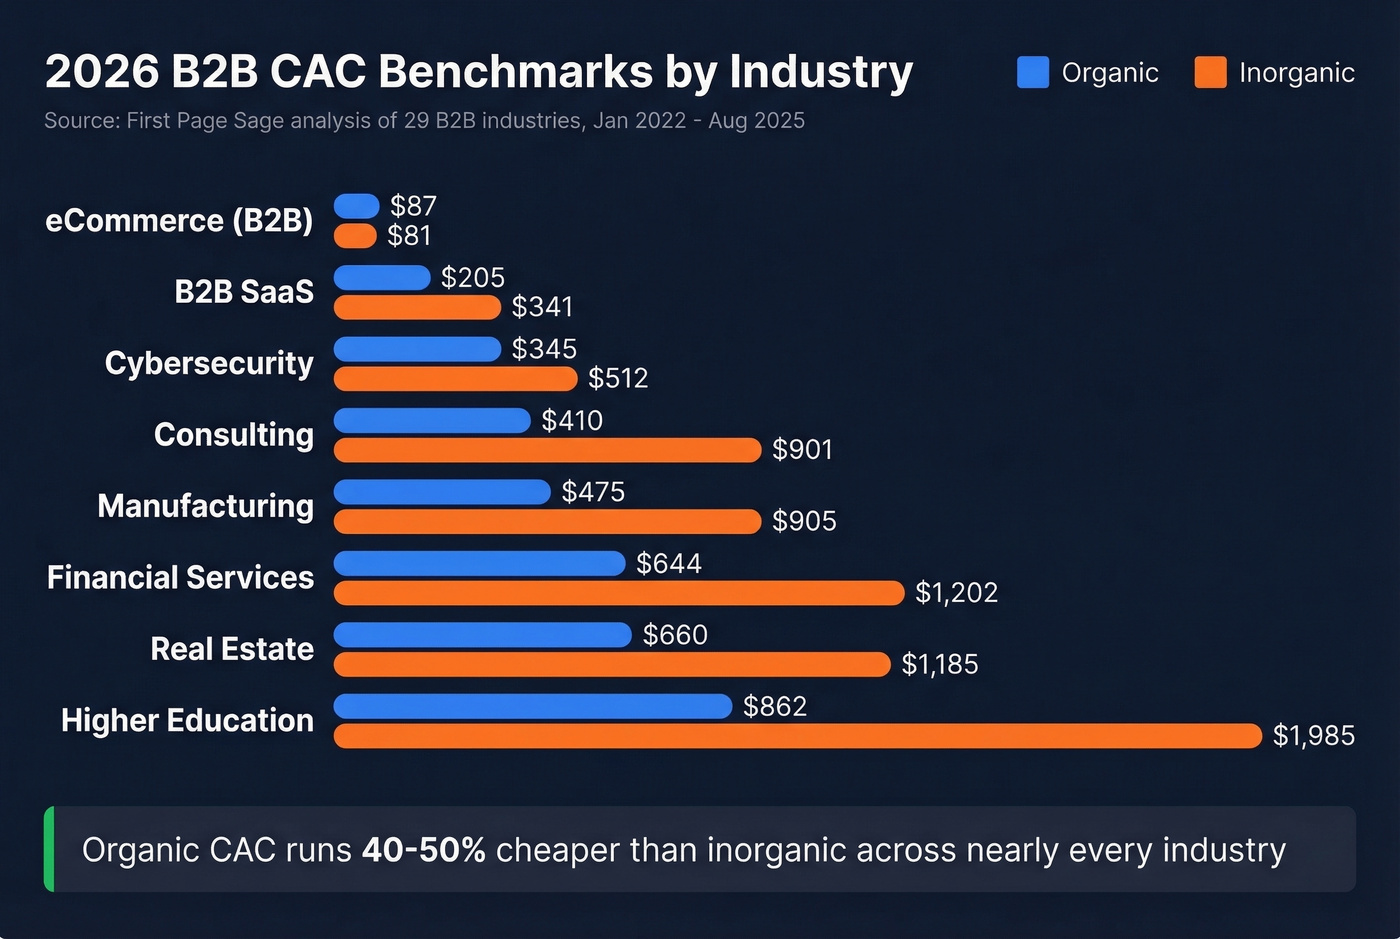
Every benchmark you've read was calculated differently. The numbers below come from First Page Sage's analysis of 29 B2B industries, using client data from January 2022 through August 2025. Their combined average weights 75% organic and 25% inorganic, which reflects their client mix. If your mix is heavier on paid, your numbers will run higher.
| Industry | Organic CAC | Inorganic CAC | Combined |
|---|---|---|---|
| eCommerce (B2B) | $87 | $81 | $86 |
| IT & Managed Services | $150 | $285 | $184 |
| B2B SaaS | $205 | $341 | $239 |
| Consulting | $410 | $901 | $533 |
| Healthcare | $502 | $1,003 | $627 |
| Manufacturing | $475 | $905 | $583 |
| Cybersecurity | $345 | $512 | $387 |
| Financial Services | $644 | $1,202 | $784 |
| Legal Services | $584 | $1,245 | $749 |
| Real Estate | $660 | $1,185 | $791 |
| Higher Education | $862 | $1,985 | $1,143 |
| Telecom | $315 | $498 | $361 |
The gap between organic and inorganic CAC is striking. In financial services, inorganic CAC runs nearly double the organic number. That's the compounding value of content and SEO - it takes longer to build, but the unit economics are dramatically better once it's working.
Here's the thing: if your average deal size is under $15K, you probably can't afford inorganic-heavy acquisition in most of these industries. The math only works when your deal sizes justify the paid premium. Most mid-market teams should be running 60%+ organic and treating paid as a supplement, not a foundation.
CAC by Marketing Channel
Channel-level benchmarks tell a different story than industry averages. These come from First Page Sage's analysis of ~120 firms across campaigns run from December 2021 through November 2024.
| Channel | B2B CAC | B2C CAC |
|---|---|---|
| PPC/SEM | $802 | $290 |
| LinkedIn Ads | $982 | - |
| Facebook Ads | - | $230 |
| Email Marketing | $510 | $287 |
| SDRs (Outbound) | $1,980 | - |
That $1,980 SDR CAC looks brutal until you realize the deals those SDRs close are often worth $30K+. For context, the average B2B LTV in this dataset was $32,414. Channel CAC without LTV context is just a scary number on a spreadsheet.
LTV:CAC Ratio and Payback Period
The LTV:CAC Ratio
LTV:CAC = Customer Lifetime Value / Customer Acquisition Cost.
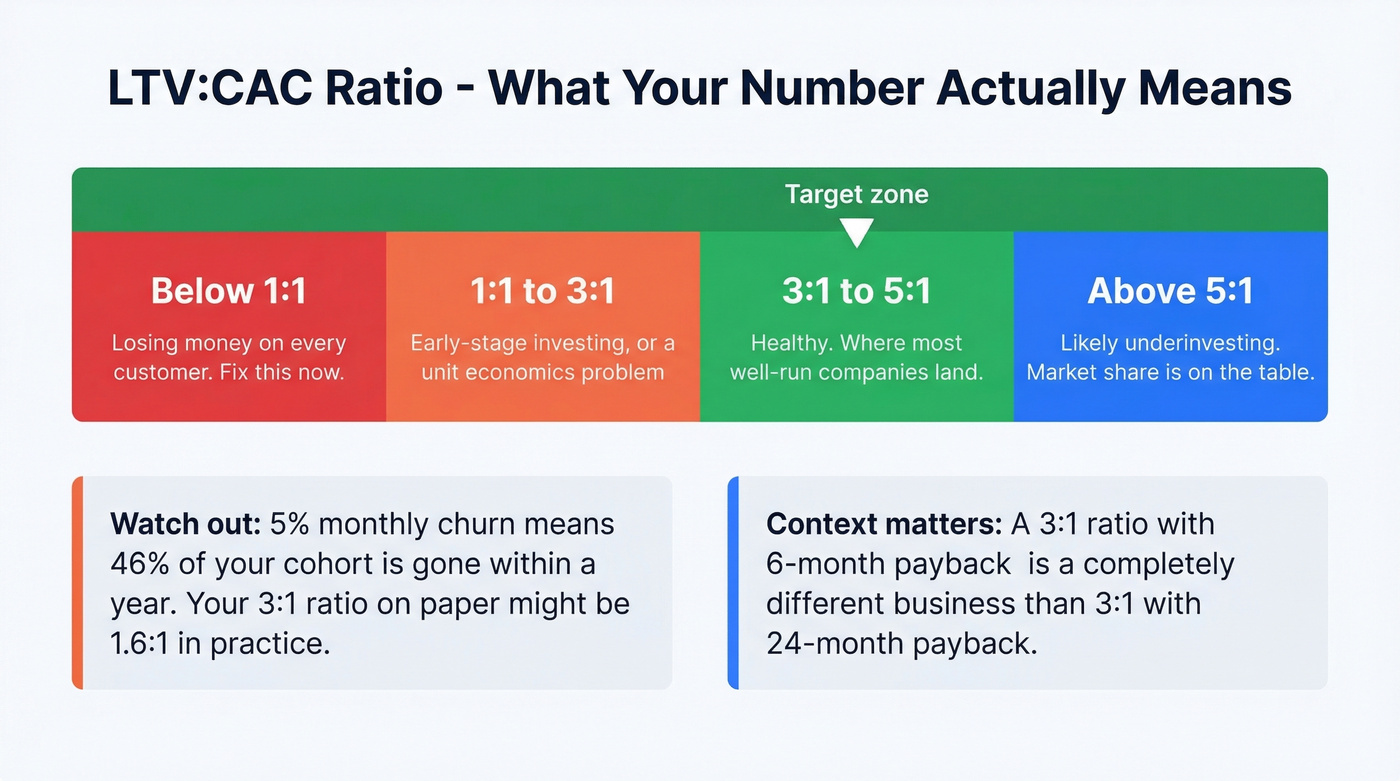
The standard benchmark is 3:1 - every dollar spent on acquisition returns three dollars in lifetime value. Harvard Business School and the Corporate Finance Institute both cite this as the baseline for sustainable unit economics. Here's how to read the scale:
- Below 1:1 - You're losing money on every customer. Fix this immediately.
- 1:1 to 3:1 - Watch closely. You're either early-stage and investing ahead of growth, or you have a unit economics problem.
- 3:1 to 5:1 - Healthy. This is where most well-run companies land.
- Above 5:1 - You're likely underinvesting in growth. There's market share sitting on the table.
But 3:1 is a starting point, not a strategy. A 3:1 ratio with a 24-month payback is a very different business than 3:1 with a 6-month payback.
Churn erodes the ratio faster than most teams realize. A 5% monthly churn rate means 46% of your cohort is gone within a year. Your 3:1 LTV:CAC ratio on paper might be 1.6:1 in practice once you account for the customers who leave before they've generated enough revenue to justify their acquisition cost. I've seen this blindside teams who looked healthy on a slide deck and were actually underwater.
CAC Payback Period
Payback period tells you how long it takes to recoup your acquisition cost from a single customer's revenue:
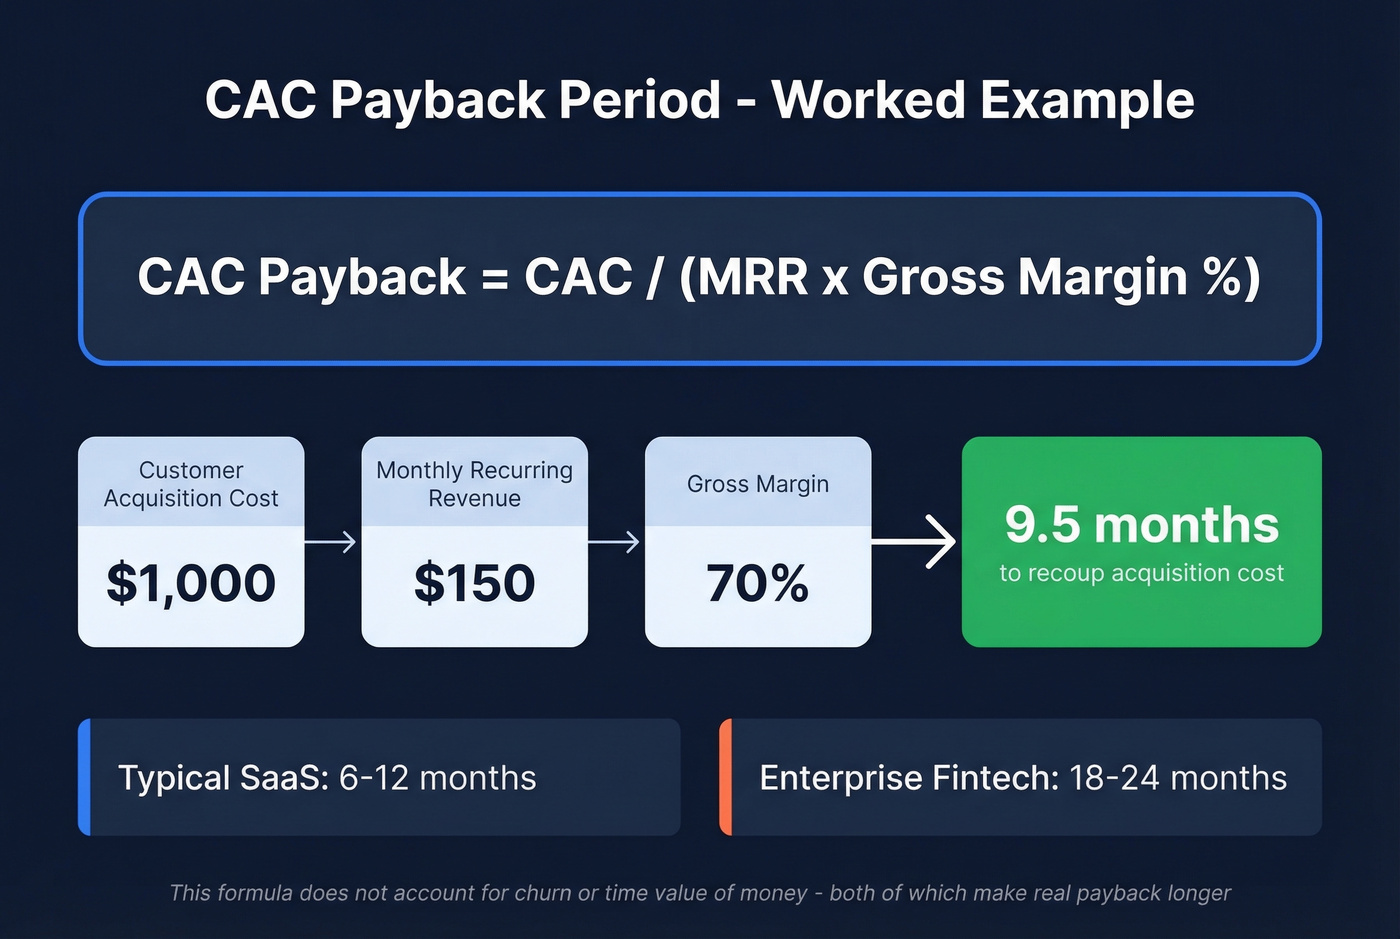
CAC Payback = CAC / (MRR x Gross Margin %)
Worked example: $1,000 CAC, $150 MRR, 70% gross margin. That's $1,000 / ($150 x 0.70) = 9.5 months. Not bad for most SaaS companies. Enterprise fintech? Expect 18-24 months due to longer, more complex sales cycles. That's fine if your retention is strong enough to justify the wait.
Two caveats most payback calculations ignore: the formula doesn't factor in churn - if customers leave before payback, you never recoup - and it doesn't account for the time value of money. A 20-month payback at today's cost of capital is meaningfully worse than the same payback five years ago.
Common CAC Calculation Mistakes
There's no GAAP standard for CAC. Every company calculates it differently, and most of those calculations have holes. These are the mistakes we see most often:
Including existing-customer costs. Retention marketing, customer success salaries, and expansion revenue efforts don't belong in CAC. Mix them in and your number looks artificially high - and you can't tell where the real problem is.
Counting only ad spend. This is the most common mistake by far. Your CAC isn't $50 because that's what Google charged per conversion. It's $50 plus the SDR salary, the CRM license, the content team, and the conference booth.
Ignoring free trial and POC costs. Server costs, implementation support, and sales engineering time during proof-of-concept phases are real acquisition costs. They're easy to forget because they sit in different budget lines.
Not accounting for bad data waste. If your email provider has a 20% bounce rate, one-fifth of your outbound budget is going to contacts that don't exist. That's a hidden CAC inflator that never shows up in the formula but eats your budget every month.
Our recommendation: create a CAC policy document. Spell out exactly what you include, what you exclude, and why. Then stick to it quarter over quarter so your trend data actually means something.
How to Reduce Your CAC
Knowing your cost per customer is step one. Bringing it down is where the money is.
Fix Your Data First
This is the most overlooked lever, and it frustrates us because it's the easiest to fix. Your outbound team sent 10,000 emails last month. If 3,200 bounced, that's 32% of your budget burned on contacts that don't exist. The reps still got paid. The sequencing tool still charged you. The domain reputation still took the hit.
Snyk's team of 50 AEs saw bounce rates drop from 35-40% to under 5% after switching to Prospeo, and AE-sourced pipeline jumped 180%. That's not a marginal improvement - it's a structural reduction in CAC driven by 98% email accuracy and a 7-day data refresh cycle.
Double Down on Organic
The benchmark data is clear - organic CAC is often 40-60% cheaper than inorganic across almost every industry. Content, SEO, and community take longer to build but compound over time. Every organic customer you acquire lowers your blended CAC. If you need a system for this, start with B2B content marketing and build from there.
Improve Conversion Rates
Before: 1,000 demos/month -> 10% close rate -> 100 customers -> $500 CAC. After: 1,000 demos/month -> 20% close rate -> 200 customers -> $250 CAC.
Same top-of-funnel spend, half the CAC. Look at every stage - landing page to lead, lead to demo, demo to close - and find the biggest drop-off. A 2x improvement in demo-to-close rate cuts your effective CAC in half without spending an additional dollar on acquisition. To benchmark your funnel, compare against the average B2B lead conversion rate.
Target Higher-Intent Prospects
How much of your ad budget reaches people who'll never buy? For most teams, the answer is "more than half." Intent data lets you focus spend on companies actively researching your category. Conversion rates go up, sales cycles get shorter, and CAC drops accordingly. If you want a practical framework, use intent based segmentation.
Reduce Sales Cycle Length
Every extra week in your sales cycle adds cost - rep time, tool usage, opportunity cost. Better qualification, faster follow-up, and tighter proposals all compress the cycle. We've seen teams cut 2-3 weeks off their average cycle just by sending proposals within 24 hours of the discovery call instead of waiting a week. Tightening your sales process optimization is usually the fastest win here.
Invest in Retention
Lower churn means higher LTV, which improves your LTV:CAC ratio even if CAC stays flat. Sometimes the best way to "reduce" CAC is to make each acquired customer worth more. A 10% improvement in annual retention can shift your LTV:CAC ratio by a full point. If you need to diagnose what's driving churn, run a proper churn analysis.
Skip this if your churn is already under 3% monthly - at that point, the bigger wins are on the acquisition side.
SDRs spending hours on bad contact data inflate your cost per customer faster than any ad campaign. Prospeo gives your team 300M+ verified profiles with 30+ filters - intent data, technographics, job changes - so reps connect with real buyers instead of burning cycles. Teams using Prospeo book 26% more meetings than ZoomInfo users.
Stop paying to acquire customers with data that doesn't connect.
Cost Per Customer FAQ
Does CAC include existing customer costs?
No. CAC should only include costs tied to acquiring new customers. Retention marketing, customer success salaries, and expansion revenue efforts belong in separate metrics like CRC (customer retention cost). Mixing them in distorts your unit economics and makes it impossible to isolate acquisition efficiency.
What's a good LTV:CAC ratio?
3:1 is the standard benchmark, meaning every dollar spent on acquisition returns three in lifetime value. Below 1:1 means you're losing money per customer; above 5:1 signals you're likely underinvesting in growth. Always pair the ratio with payback period and stress-test against your actual churn rate.
How does bad data inflate CAC?
Every bounced email and dead phone number is budget wasted on contacts that don't exist. If 30% of your outreach bounces, your effective CAC is roughly 43% higher than reported because the denominator (customers acquired) stays the same while the numerator (total spend) includes all that waste.
Should I use blended or fully-loaded CAC?
Default to fully-loaded - it's the most honest number and what investors care about. Use blended for quick monthly trend tracking, and channel-level CAC for optimizing specific campaigns. Most mature teams track at least two variants simultaneously.
How often should I recalculate?
Monthly for channel-level CAC so you catch spend inefficiencies fast. Quarterly for fully-loaded CAC, which smooths seasonal variation and accounts for longer sales cycles. Annual recalculation is too slow - by the time you spot a problem, you've already burned three quarters of budget.